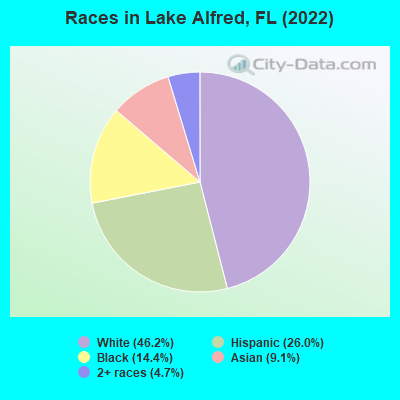
Races in Lake Alfred, Florida (FL) Detailed Stats
Data:
Races - White alone (%)
Races - White alone (% change since 2000)
Races - Black alone (%)
Races - Black alone (% change since 2000)
Races - American Indian alone (%)
Races - American Indian alone (% change since 2000)
Races - Asian alone (%)
Races - Asian alone (% change since 2000)
Races - Hispanic (%)
Races - Hispanic (% change since 2000)
Races - Native Hawaiian and Other Pacific Islander alone (%)
Races - Native Hawaiian and Other Pacific Islander alone (% change since 2000)
Races - Two or more races(%)
Races - Two or more races(% change since 2000)
Races - Other race alone (%)
Races - Other race alone (% change since 2000)
Racial diversity
Place of birth - Born in state of residence (%)
Place of birth - Born in state of residence (%) - White
Place of birth - Born in state of residence (%) - Black or African American
Place of birth - Born in state of residence (%) - Asian
Place of birth - Born in state of residence (%) - Hispanic or Latino
Place of birth - Born in state of residence (%) - American Indian and Alaska Native
Place of birth - Born in state of residence (%) - Multirace
Place of birth - Born in state of residence (%) - Other Race
Place of birth - Born in other state (%)
Place of birth - Born in other state (%) - White
Place of birth - Born in other state (%) - Black or African American
Place of birth - Born in other state (%) - Asian
Place of birth - Born in other state (%) - Hispanic or Latino
Place of birth - Born in other state (%) - American Indian and Alaska Native
Place of birth - Born in other state (%) - Multirace
Place of birth - Born in other state (%) - Other Race
Place of birth - Native, outside of US (%)
Place of birth - Native, outside of US (%) - White
Place of birth - Native, outside of US (%) - Black or African American
Place of birth - Native, outside of US (%) - Asian
Place of birth - Native, outside of US (%) - Hispanic or Latino
Place of birth - Native, outside of US (%) - American Indian and Alaska Native
Place of birth - Native, outside of US (%) - Multirace
Place of birth - Native, outside of US (%) - Other Race
Place of birth - Foreign born (%)
Place of birth - Foreign born (%) - White
Place of birth - Foreign born (%) - Black or African American
Place of birth - Foreign born (%) - Asian
Place of birth - Foreign born (%) - Hispanic or Latino
Place of birth - Foreign born (%) - American Indian and Alaska Native
Place of birth - Foreign born (%) - Multirace
Place of birth - Foreign born (%) - Other Race
Residents speaking English at home (%)
Residents speaking English at home - Born in the United States (%)
Residents speaking English at home - Native, born elsewhere (%)
Residents speaking English at home - Foreign born (%)
Residents speaking Spanish at home (%)
Residents speaking Spanish at home - Born in the United States (%)
Residents speaking Spanish at home - Native, born elsewhere (%)
Residents speaking Spanish at home - Foreign born (%)
Residents speaking other language at home (%)
Residents speaking other language at home - Born in the United States (%)
Residents speaking other language at home - Native, born elsewhere (%)
Residents speaking other language at home - Foreign born (%)
Marital status - Never married (%)
Marital status - Now married (%)
Marital status - Separated (%)
Marital status - Widowed (%)
Marital status - Divorced (%)
Ancestries Reported - Arab (%)
Ancestries Reported - Czech (%)
Ancestries Reported - Danish (%)
Ancestries Reported - Dutch (%)
Ancestries Reported - English (%)
Ancestries Reported - French (%)
Ancestries Reported - French Canadian (%)
Ancestries Reported - German (%)
Ancestries Reported - Greek (%)
Ancestries Reported - Hungarian (%)
Ancestries Reported - Irish (%)
Ancestries Reported - Italian (%)
Ancestries Reported - Lithuanian (%)
Ancestries Reported - Norwegian (%)
Ancestries Reported - Polish (%)
Ancestries Reported - Portuguese (%)
Ancestries Reported - Russian (%)
Ancestries Reported - Scotch-Irish (%)
Ancestries Reported - Scottish (%)
Ancestries Reported - Slovak (%)
Ancestries Reported - Subsaharan African (%)
Ancestries Reported - Swedish (%)
Ancestries Reported - Swiss (%)
Ancestries Reported - Ukrainian (%)
Ancestries Reported - United States (%)
Ancestries Reported - Welsh (%)
Ancestries Reported - West Indian (%)
Ancestries Reported - Other (%)
Geographical mobility - Same house 1 year ago (%)
Geographical mobility - Same house 1 year ago (%) - White
Geographical mobility - Same house 1 year ago (%) - Black or African American
Geographical mobility - Same house 1 year ago (%) - Asian
Geographical mobility - Same house 1 year ago (%) - Hispanic or Latino
Geographical mobility - Same house 1 year ago (%) - American Indian and Alaska Native
Geographical mobility - Same house 1 year ago (%) - Multirace
Geographical mobility - Same house 1 year ago (%) - Other Race
Geographical mobility - Moved within same county (%)
Geographical mobility - Moved within same county (%) - White
Geographical mobility - Moved within same county (%) - Black or African American
Geographical mobility - Moved within same county (%) - Asian
Geographical mobility - Moved within same county (%) - Hispanic or Latino
Geographical mobility - Moved within same county (%) - American Indian and Alaska Native
Geographical mobility - Moved within same county (%) - Multirace
Geographical mobility - Moved within same county (%) - Other Race
Geographical mobility - Moved from different county within same state (%)
Geographical mobility - Moved from different county within same state (%) - White
Geographical mobility - Moved from different county within same state (%) - Black or African American
Geographical mobility - Moved from different county within same state (%) - Asian
Geographical mobility - Moved from different county within same state (%) - Hispanic or Latino
Geographical mobility - Moved from different county within same state (%) - American Indian and Alaska Native
Geographical mobility - Moved from different county within same state (%) - Multirace
Geographical mobility - Moved from different county within same state (%) - Other Race
Geographical mobility - Moved from different state (%)
Geographical mobility - Moved from different state (%) - White
Geographical mobility - Moved from different state (%) - Black or African American
Geographical mobility - Moved from different state (%) - Asian
Geographical mobility - Moved from different state (%) - Hispanic or Latino
Geographical mobility - Moved from different state (%) - American Indian and Alaska Native
Geographical mobility - Moved from different state (%) - Multirace
Geographical mobility - Moved from different state (%) - Other Race
Geographical mobility - Moved from abroad (%)
Geographical mobility - Moved from abroad (%) - White
Geographical mobility - Moved from abroad (%) - Black or African American
Geographical mobility - Moved from abroad (%) - Asian
Geographical mobility - Moved from abroad (%) - Hispanic or Latino
Geographical mobility - Moved from abroad (%) - American Indian and Alaska Native
Geographical mobility - Moved from abroad (%) - Multirace
Geographical mobility - Moved from abroad (%) - Other Race
Place of birth for the foreign-born population - Ireland (%)
Place of birth for the foreign-born population - Denmark (%)
Place of birth for the foreign-born population - Norway (%)
Place of birth for the foreign-born population - Sweden (%)
Place of birth for the foreign-born population - United Kingdom (%)
Place of birth for the foreign-born population - England (%)
Place of birth for the foreign-born population - Scotland (%)
Place of birth for the foreign-born population - Other Northern Europe (%)
Place of birth for the foreign-born population - Austria (%)
Place of birth for the foreign-born population - Belgium (%)
Place of birth for the foreign-born population - France (%)
Place of birth for the foreign-born population - Germany (%)
Place of birth for the foreign-born population - Netherlands (%)
Place of birth for the foreign-born population - Switzerland (%)
Place of birth for the foreign-born population - Other Western Europe (%)
Place of birth for the foreign-born population - Greece (%)
Place of birth for the foreign-born population - Italy (%)
Place of birth for the foreign-born population - Portugal (%)
Place of birth for the foreign-born population - Spain (%)
Place of birth for the foreign-born population - Other Southern Europe (%)
Place of birth for the foreign-born population - Albania (%)
Place of birth for the foreign-born population - Belarus (%)
Place of birth for the foreign-born population - Bosnia and Herzegovina (%)
Place of birth for the foreign-born population - Bulgaria (%)
Place of birth for the foreign-born population - Croatia (%)
Place of birth for the foreign-born population - Czechoslovakia (%)
Place of birth for the foreign-born population - Hungary (%)
Place of birth for the foreign-born population - Latvia (%)
Place of birth for the foreign-born population - Lithuania (%)
Place of birth for the foreign-born population - North Macedonia (Macedonia) (%)
Place of birth for the foreign-born population - Moldova (%)
Place of birth for the foreign-born population - Poland (%)
Place of birth for the foreign-born population - Romania (%)
Place of birth for the foreign-born population - Russia (%)
Place of birth for the foreign-born population - Serbia (%)
Place of birth for the foreign-born population - Ukraine (%)
Place of birth for the foreign-born population - Other Eastern Europe (%)
Place of birth for the foreign-born population - China (%)
Place of birth for the foreign-born population - Hong Kong (%)
Place of birth for the foreign-born population - Taiwan (%)
Place of birth for the foreign-born population - Japan (%)
Place of birth for the foreign-born population - Korea (%)
Place of birth for the foreign-born population - Other Eastern Asia (%)
Place of birth for the foreign-born population - Afghanistan (%)
Place of birth for the foreign-born population - Bangladesh (%)
Place of birth for the foreign-born population - India (%)
Place of birth for the foreign-born population - Iran (%)
Place of birth for the foreign-born population - Kazakhstan (%)
Place of birth for the foreign-born population - Nepal (%)
Place of birth for the foreign-born population - Pakistan (%)
Place of birth for the foreign-born population - Sri Lanka (%)
Place of birth for the foreign-born population - Uzbekistan (%)
Place of birth for the foreign-born population - Other South Central Asia (%)
Place of birth for the foreign-born population - Burma (%)
Place of birth for the foreign-born population - Cambodia (%)
Place of birth for the foreign-born population - Indonesia (%)
Place of birth for the foreign-born population - Laos (%)
Place of birth for the foreign-born population - Malaysia (%)
Place of birth for the foreign-born population - Philippines (%)
Place of birth for the foreign-born population - Singapore (%)
Place of birth for the foreign-born population - Thailand (%)
Place of birth for the foreign-born population - Vietnam (%)
Place of birth for the foreign-born population - Other South Eastern Asia (%)
Place of birth for the foreign-born population - Armenia (%)
Place of birth for the foreign-born population - Iraq (%)
Place of birth for the foreign-born population - Israel (%)
Place of birth for the foreign-born population - Jordan (%)
Place of birth for the foreign-born population - Kuwait (%)
Place of birth for the foreign-born population - Lebanon (%)
Place of birth for the foreign-born population - Saudi Arabia (%)
Place of birth for the foreign-born population - Syria (%)
Place of birth for the foreign-born population - Turkey (%)
Place of birth for the foreign-born population - Yemen (%)
Place of birth for the foreign-born population - Other Western Asia (%)
Place of birth for the foreign-born population - Eritrea (%)
Place of birth for the foreign-born population - Ethiopia (%)
Place of birth for the foreign-born population - Kenya (%)
Place of birth for the foreign-born population - Somalia (%)
Place of birth for the foreign-born population - Uganda (%)
Place of birth for the foreign-born population - Zimbabwe (%)
Place of birth for the foreign-born population - Other Eastern Africa (%)
Place of birth for the foreign-born population - Cameroon (%)
Place of birth for the foreign-born population - Congo (%)
Place of birth for the foreign-born population - Democratic Republic of Congo (Zaire) (%)
Place of birth for the foreign-born population - Other Middle Africa (%)
Place of birth for the foreign-born population - Egypt (%)
Place of birth for the foreign-born population - Morocco (%)
Place of birth for the foreign-born population - Sudan (%)
Place of birth for the foreign-born population - Other Northern Africa (%)
Place of birth for the foreign-born population - South Africa (%)
Place of birth for the foreign-born population - Other Southern Africa (%)
Place of birth for the foreign-born population - Cabo Verde (%)
Place of birth for the foreign-born population - Ghana (%)
Place of birth for the foreign-born population - Liberia (%)
Place of birth for the foreign-born population - Nigeria (%)
Place of birth for the foreign-born population - Senegal (%)
Place of birth for the foreign-born population - Sierra Leone (%)
Place of birth for the foreign-born population - Other Western Africa (%)
Place of birth for the foreign-born population - Australia (%)
Place of birth for the foreign-born population - New Zealand (%)
Place of birth for the foreign-born population - Fiji (%)
Place of birth for the foreign-born population - Micronesia (%)
Place of birth for the foreign-born population - Bahamas (%)
Place of birth for the foreign-born population - Barbados (%)
Place of birth for the foreign-born population - Cuba (%)
Place of birth for the foreign-born population - Dominica (%)
Place of birth for the foreign-born population - Dominican Republic (%)
Place of birth for the foreign-born population - Grenada (%)
Place of birth for the foreign-born population - Haiti (%)
Place of birth for the foreign-born population - Jamaica (%)
Place of birth for the foreign-born population - St. Vincent and the Grenadines (%)
Place of birth for the foreign-born population - Trinidad and Tobago (%)
Place of birth for the foreign-born population - West Indies (%)
Place of birth for the foreign-born population - Other Caribbean (%)
Place of birth for the foreign-born population - Belize (%)
Place of birth for the foreign-born population - Costa Rica (%)
Place of birth for the foreign-born population - El Salvador (%)
Place of birth for the foreign-born population - Guatemala (%)
Place of birth for the foreign-born population - Honduras (%)
Place of birth for the foreign-born population - Mexico (%)
Place of birth for the foreign-born population - Nicaragua (%)
Place of birth for the foreign-born population - Panama (%)
Place of birth for the foreign-born population - Other Central America (%)
Place of birth for the foreign-born population - Argentina (%)
Place of birth for the foreign-born population - Bolivia (%)
Place of birth for the foreign-born population - Brazil (%)
Place of birth for the foreign-born population - Chile (%)
Place of birth for the foreign-born population - Colombia (%)
Place of birth for the foreign-born population - Ecuador (%)
Place of birth for the foreign-born population - Guyana (%)
Place of birth for the foreign-born population - Peru (%)
Place of birth for the foreign-born population - Uruguay (%)
Place of birth for the foreign-born population - Venezuela (%)
Place of birth for the foreign-born population - Other South America (%)
Place of birth for the foreign-born population - Canada (%)
Place of birth for the foreign-born population - Other Northern America (%)
Place of birth for the foreign-born population - Other (%)
According to 2022 data, the most numerous races in Lake Alfred, FL are White alone (3,237 residents), Hispanic (1,822 residents), and Black alone (1,006 residents). 68.1% of Lake Alfred residents speak English at home. 12.2% of Lake Alfred, FL residents are foreign-born (5.8% born in Asia, 3.0% born in Latin America, 2.7% born in Europe), which is 72.6% less than the foreign-born rate of 21.0% across the entire state of Florida.
Race distribution in Lake Alfred
2000 2022
10,458,509 65.4% White alone 2,682,715 16.8% Hispanic 2,264,268 14.2% Black alone 261,693 1.6% Asian alone 236,954 1.5% Two or more races 42,358 0.3% American Indian alone 28,994 0.2% Other race alone 6,887 0.04% Native Hawaiian and Other
11,309,403 50.8% White alone 6,025,039 27.1% Hispanic 3,241,015 14.6% Black alone 861,630 3.9% Two or more races 623,692 2.8% Asian alone 152,054 0.7% Other race alone 22,504 0.1% American Indian alone 9,486 0.04% Native Hawaiian and Other
Income and house value in Lake Alfred Median household income in 2022 $73,515 White non-Hispanic householders$42,192 Black householders$150,997 Asian householders$82,228 Two or more races householders$59,536 Hispanic or Latino race householdersMedian 2022 house value $269,879 White Non-Hispanic householders$199,565 Black or African American householders $775,515 Asian householders$281,598 Hispanic or Latino householders
Median age by race in Lake Alfred
42.5 Median age for White residents44.9 35.5 33.9 Median age for Black or African American residents28.6 35.7 -898,856,639.4 Median age for American Indian / Alaska Native residents-899,908,171.7 -834,555,826.4 36.0 Median age for Asian residents36.6 20.0 -679,849,340.2 Median age for Native Hawaiian / Pacific Islander residents-858,307,848.3 -443,298,968.6 31.6 Median age for Other race residents25.7 43.4 39.6 Median age for Two or more races residents43.0 35.5 40.7 Median age for White alone residents49.2 33.7 39.1 Median age for Hispanic or Latino residents34.7 42.7
Owner/renter occupied households by race in Lake Alfred
House owners and renters - White residents 1,105 80.5% Owner occupied268 19.5% Renter occupiedHouse owners and renters - Black or African American residents 154 48.7% Owner occupied162 51.3% Renter occupiedHouse owners and renters - Asian residents 139 100.0% Owner occupiedHouse owners and renters - Other race residents 127 30.2% Owner occupied294 69.8% Renter occupiedHouse owners and renters - Two or more races residents 284 86.1% Owner occupied46 13.9% Renter occupiedHouse owners and renters - White alone residents 990 76.5% Owner occupied305 23.5% Renter occupiedHouse owners and renters - Hispanic or Latino residents 510 68.3% Owner occupied237 31.7% Renter occupied
Language usage in Lake Alfred
English speakers - Total 68.1% of residents of Lake Alfred speak English at home.
24.4% of residents speak Spanish at home 778 49.6% Speak English very well792 50.4% Speak English less than very well8.3% of residents speak other language at home 418 78.0% Speak English very well118 22.0% Speak English less than very well
English speakers - Born in the United States 89.3% of residents of Lake Alfred speak English at home.
10.7% of residents speak Spanish at home 149 84.2% Speak English very well28 15.8% Speak English less than very well
English speakers - Native, born elsewhere 12.0% of residents of Lake Alfred speak English at home.
86.7% of residents speak Spanish at home 477 45.1% Speak English very well581 54.9% Speak English less than very well
English speakers - Foreign-born 30.6% of residents of Lake Alfred speak English at home.
15.9% of residents speak Spanish at home 57 36.3% Speak English very well100 63.7% Speak English less than very well48.6% of residents speak other language at home 350 73.1% Speak English very well129 26.9% Speak English less than very well
White (Caucasian) - Speak only English Native:
99.3% (2,909)Foreign-born:
100.0% (170)
White (Caucasian) - Speak another language Native:
3.1% (91)Foreign-born:
27.9% (47)
Black or African American - Speak only English Native:
99.5% (874)Foreign-born:
5.2% (6)
Black or African American - Speak another language Native:
0.7% (6)Foreign-born:
100.0% (120)
Asian - Speak another language Native:
100.0% (33)Foreign-born:
88.6% (359)
Other race - Speak another language Native:
100.0% (879)Foreign-born:
100.0% (57)
Two or more races - Speak only English Native:
29.6% (300)Foreign-born:
100.0% (55)
Two or more races - Speak another language Native:
71.5% (723)Foreign-born:
17.0% (9)
White alone - Speak only English Native:
100.0% (2,908)Foreign-born:
90.2% (194)
Hispanic or Latino - Speak another language Native:
96.1% (1,387)Foreign-born:
99.3% (112)
Foreign-born residents in Lake Alfred 853 residents are foreign born (5.8% Asia , 3.0% Latin America , 2.7% Europe ).
This city:
12.2%Florida:
21.1%
Marital status for residents in Lake Alfred Marital status - White (Caucasian) population 15 years and over
Males 25.3% Never married46.1% Now married0.0% Separated3.0% Widowed25.5% DivorcedFemales 34.2% Never married47.5% Now married1.0% Separated9.0% Widowed8.4% DivorcedWomen who gave birth in the past 12 months Now married:
100.0% (20)Unmarried:
0.0% (0)
Women who did not give birth in the past 12 months Now married:
40.6% (337)Unmarried:
59.4% (493)
Marital status - Black or African American population 15 years and over
Males 43.2% Never married48.5% Now married0.0% Separated8.4% Widowed0.0% DivorcedFemales 38.4% Never married44.3% Now married11.7% Separated5.6% Widowed0.0% DivorcedWomen who gave birth in the past 12 months Now married:
100.0% (29)Unmarried:
0.0% (0)
Women who did not give birth in the past 12 months Now married:
45.6% (109)Unmarried:
54.4% (130)
Marital status - Asian population 15 years and over
Males 9.0% Never married91.0% Now married0.0% Separated0.0% Widowed0.0% DivorcedFemales 32.8% Never married67.2% Now married0.0% Separated0.0% Widowed0.0% DivorcedWomen who gave birth in the past 12 months Now married:
100.0% (100)Unmarried:
0.0% (0)
Women who did not give birth in the past 12 months Now married:
38.2% (52)Unmarried:
61.8% (84)
Marital status - Other race population 15 years and over
Males 32.8% Never married67.2% Now married0.0% Separated0.0% Widowed0.0% DivorcedFemales 26.5% Never married46.1% Now married0.0% Separated0.0% Widowed27.5% DivorcedWomen who did not give birth in the past 12 months Now married:
35.3% (158)Unmarried:
64.7% (291)
Marital status - Two or more races population 15 years and over
Males 55.5% Never married44.5% Now married0.0% Separated0.0% Widowed0.0% DivorcedFemales 34.7% Never married37.6% Now married0.0% Separated0.0% Widowed27.8% DivorcedWomen who gave birth in the past 12 months Now married:
0.0% (0)Unmarried:
100.0% (86)
Women who did not give birth in the past 12 months Now married:
30.3% (61)Unmarried:
69.7% (140)
Marital status - White alone, not Hispanic / Latino population 15 years and over
Males 27.1% Never married42.4% Now married0.0% Separated3.3% Widowed27.2% DivorcedFemales 34.7% Never married46.7% Now married1.1% Separated9.9% Widowed7.6% DivorcedWomen who gave birth in the past 12 months Now married:
100.0% (23)Unmarried:
0.0% (0)
Women who did not give birth in the past 12 months Now married:
39.0% (338)Unmarried:
61.0% (527)
Marital status - Hispanic or Latino population 15 years and over
Males 39.1% Never married60.9% Now married0.0% Separated0.0% Widowed0.0% DivorcedFemales 21.3% Never married49.4% Now married0.0% Separated0.0% Widowed29.3% DivorcedWomen who gave birth in the past 12 months Now married:
0.0% (0)Unmarried:
100.0% (62)
Women who did not give birth in the past 12 months Now married:
45.6% (212)Unmarried:
54.4% (253)
Ancestries in Lake Alfred
933 20.2% American343 7.4% English247 5.4% German243 5.3% Northern European71 1.5% Italian57 1.2% European56 1.2% Irish49 1.1% Jamaican42 0.9% Haitian35 0.8% French35 0.8% Scottish31 0.7% French Canadian27 0.6% Canadian26 0.6% Serbian16 0.3% Scotch-Irish14 0.3% Russian6 0.1% Trinidadian and Tobagonian
Children Nativity (place of birth) in Lake Alfred
Children under 6 years - Living with two parents Both parents native 220 100.0% NativeBoth parents foreign-born 265 100.0% NativeOne native, one foreign-born parent 22 100.0% NativeChildren under 6 years - Living with one parent Native parent 42 100.0% NativeForeign-born parent 55 100.0% NativeChildren 6 to 17 years - Living with two parents Both parents native 411 100.0% NativeBoth parents foreign-born 39 100.0% NativeOne native, one foreign-born parent 87 100.0% NativeChildren 6 to 17 years - Living with one parent Native parent 190 100.0% NativeForeign-born parent 70 48.9% Native73 51.1% Foreign-born
Grandparents responsible for own grandchildren in Lake Alfred
Grandparents (30 to 59 years) White / Caucasian 10 100.0% Responsible for grandchildrenWhite alone, not Hispanic / Latino 11 100.0% Responsible for grandchildrenGrandparents (60 years and over) White / Caucasian 15 15.8% Responsible for grandchildren82 84.2% Not responsible for grandchildrenWhite alone, not Hispanic / Latino 18 17.5% Responsible for grandchildren85 82.5% Not responsible for grandchildren