Races in Lake City, Georgia (GA) Detailed Stats
Data:
Races - White alone (%)
Races - White alone (% change since 2000)
Races - Black alone (%)
Races - Black alone (% change since 2000)
Races - American Indian alone (%)
Races - American Indian alone (% change since 2000)
Races - Asian alone (%)
Races - Asian alone (% change since 2000)
Races - Hispanic (%)
Races - Hispanic (% change since 2000)
Races - Native Hawaiian and Other Pacific Islander alone (%)
Races - Native Hawaiian and Other Pacific Islander alone (% change since 2000)
Races - Two or more races(%)
Races - Two or more races(% change since 2000)
Races - Other race alone (%)
Races - Other race alone (% change since 2000)
Racial diversity
Place of birth - Born in state of residence (%)
Place of birth - Born in state of residence (%) - White
Place of birth - Born in state of residence (%) - Black or African American
Place of birth - Born in state of residence (%) - Asian
Place of birth - Born in state of residence (%) - Hispanic or Latino
Place of birth - Born in state of residence (%) - American Indian and Alaska Native
Place of birth - Born in state of residence (%) - Multirace
Place of birth - Born in state of residence (%) - Other Race
Place of birth - Born in other state (%)
Place of birth - Born in other state (%) - White
Place of birth - Born in other state (%) - Black or African American
Place of birth - Born in other state (%) - Asian
Place of birth - Born in other state (%) - Hispanic or Latino
Place of birth - Born in other state (%) - American Indian and Alaska Native
Place of birth - Born in other state (%) - Multirace
Place of birth - Born in other state (%) - Other Race
Place of birth - Native, outside of US (%)
Place of birth - Native, outside of US (%) - White
Place of birth - Native, outside of US (%) - Black or African American
Place of birth - Native, outside of US (%) - Asian
Place of birth - Native, outside of US (%) - Hispanic or Latino
Place of birth - Native, outside of US (%) - American Indian and Alaska Native
Place of birth - Native, outside of US (%) - Multirace
Place of birth - Native, outside of US (%) - Other Race
Place of birth - Foreign born (%)
Place of birth - Foreign born (%) - White
Place of birth - Foreign born (%) - Black or African American
Place of birth - Foreign born (%) - Asian
Place of birth - Foreign born (%) - Hispanic or Latino
Place of birth - Foreign born (%) - American Indian and Alaska Native
Place of birth - Foreign born (%) - Multirace
Place of birth - Foreign born (%) - Other Race
Residents speaking English at home (%)
Residents speaking English at home - Born in the United States (%)
Residents speaking English at home - Native, born elsewhere (%)
Residents speaking English at home - Foreign born (%)
Residents speaking Spanish at home (%)
Residents speaking Spanish at home - Born in the United States (%)
Residents speaking Spanish at home - Native, born elsewhere (%)
Residents speaking Spanish at home - Foreign born (%)
Residents speaking other language at home (%)
Residents speaking other language at home - Born in the United States (%)
Residents speaking other language at home - Native, born elsewhere (%)
Residents speaking other language at home - Foreign born (%)
Marital status - Never married (%)
Marital status - Now married (%)
Marital status - Separated (%)
Marital status - Widowed (%)
Marital status - Divorced (%)
Ancestries Reported - Arab (%)
Ancestries Reported - Czech (%)
Ancestries Reported - Danish (%)
Ancestries Reported - Dutch (%)
Ancestries Reported - English (%)
Ancestries Reported - French (%)
Ancestries Reported - French Canadian (%)
Ancestries Reported - German (%)
Ancestries Reported - Greek (%)
Ancestries Reported - Hungarian (%)
Ancestries Reported - Irish (%)
Ancestries Reported - Italian (%)
Ancestries Reported - Lithuanian (%)
Ancestries Reported - Norwegian (%)
Ancestries Reported - Polish (%)
Ancestries Reported - Portuguese (%)
Ancestries Reported - Russian (%)
Ancestries Reported - Scotch-Irish (%)
Ancestries Reported - Scottish (%)
Ancestries Reported - Slovak (%)
Ancestries Reported - Subsaharan African (%)
Ancestries Reported - Swedish (%)
Ancestries Reported - Swiss (%)
Ancestries Reported - Ukrainian (%)
Ancestries Reported - United States (%)
Ancestries Reported - Welsh (%)
Ancestries Reported - West Indian (%)
Ancestries Reported - Other (%)
Geographical mobility - Same house 1 year ago (%)
Geographical mobility - Same house 1 year ago (%) - White
Geographical mobility - Same house 1 year ago (%) - Black or African American
Geographical mobility - Same house 1 year ago (%) - Asian
Geographical mobility - Same house 1 year ago (%) - Hispanic or Latino
Geographical mobility - Same house 1 year ago (%) - American Indian and Alaska Native
Geographical mobility - Same house 1 year ago (%) - Multirace
Geographical mobility - Same house 1 year ago (%) - Other Race
Geographical mobility - Moved within same county (%)
Geographical mobility - Moved within same county (%) - White
Geographical mobility - Moved within same county (%) - Black or African American
Geographical mobility - Moved within same county (%) - Asian
Geographical mobility - Moved within same county (%) - Hispanic or Latino
Geographical mobility - Moved within same county (%) - American Indian and Alaska Native
Geographical mobility - Moved within same county (%) - Multirace
Geographical mobility - Moved within same county (%) - Other Race
Geographical mobility - Moved from different county within same state (%)
Geographical mobility - Moved from different county within same state (%) - White
Geographical mobility - Moved from different county within same state (%) - Black or African American
Geographical mobility - Moved from different county within same state (%) - Asian
Geographical mobility - Moved from different county within same state (%) - Hispanic or Latino
Geographical mobility - Moved from different county within same state (%) - American Indian and Alaska Native
Geographical mobility - Moved from different county within same state (%) - Multirace
Geographical mobility - Moved from different county within same state (%) - Other Race
Geographical mobility - Moved from different state (%)
Geographical mobility - Moved from different state (%) - White
Geographical mobility - Moved from different state (%) - Black or African American
Geographical mobility - Moved from different state (%) - Asian
Geographical mobility - Moved from different state (%) - Hispanic or Latino
Geographical mobility - Moved from different state (%) - American Indian and Alaska Native
Geographical mobility - Moved from different state (%) - Multirace
Geographical mobility - Moved from different state (%) - Other Race
Geographical mobility - Moved from abroad (%)
Geographical mobility - Moved from abroad (%) - White
Geographical mobility - Moved from abroad (%) - Black or African American
Geographical mobility - Moved from abroad (%) - Asian
Geographical mobility - Moved from abroad (%) - Hispanic or Latino
Geographical mobility - Moved from abroad (%) - American Indian and Alaska Native
Geographical mobility - Moved from abroad (%) - Multirace
Geographical mobility - Moved from abroad (%) - Other Race
Place of birth for the foreign-born population - Ireland (%)
Place of birth for the foreign-born population - Denmark (%)
Place of birth for the foreign-born population - Norway (%)
Place of birth for the foreign-born population - Sweden (%)
Place of birth for the foreign-born population - United Kingdom (%)
Place of birth for the foreign-born population - England (%)
Place of birth for the foreign-born population - Scotland (%)
Place of birth for the foreign-born population - Other Northern Europe (%)
Place of birth for the foreign-born population - Austria (%)
Place of birth for the foreign-born population - Belgium (%)
Place of birth for the foreign-born population - France (%)
Place of birth for the foreign-born population - Germany (%)
Place of birth for the foreign-born population - Netherlands (%)
Place of birth for the foreign-born population - Switzerland (%)
Place of birth for the foreign-born population - Other Western Europe (%)
Place of birth for the foreign-born population - Greece (%)
Place of birth for the foreign-born population - Italy (%)
Place of birth for the foreign-born population - Portugal (%)
Place of birth for the foreign-born population - Spain (%)
Place of birth for the foreign-born population - Other Southern Europe (%)
Place of birth for the foreign-born population - Albania (%)
Place of birth for the foreign-born population - Belarus (%)
Place of birth for the foreign-born population - Bosnia and Herzegovina (%)
Place of birth for the foreign-born population - Bulgaria (%)
Place of birth for the foreign-born population - Croatia (%)
Place of birth for the foreign-born population - Czechoslovakia (%)
Place of birth for the foreign-born population - Hungary (%)
Place of birth for the foreign-born population - Latvia (%)
Place of birth for the foreign-born population - Lithuania (%)
Place of birth for the foreign-born population - North Macedonia (Macedonia) (%)
Place of birth for the foreign-born population - Moldova (%)
Place of birth for the foreign-born population - Poland (%)
Place of birth for the foreign-born population - Romania (%)
Place of birth for the foreign-born population - Russia (%)
Place of birth for the foreign-born population - Serbia (%)
Place of birth for the foreign-born population - Ukraine (%)
Place of birth for the foreign-born population - Other Eastern Europe (%)
Place of birth for the foreign-born population - China (%)
Place of birth for the foreign-born population - Hong Kong (%)
Place of birth for the foreign-born population - Taiwan (%)
Place of birth for the foreign-born population - Japan (%)
Place of birth for the foreign-born population - Korea (%)
Place of birth for the foreign-born population - Other Eastern Asia (%)
Place of birth for the foreign-born population - Afghanistan (%)
Place of birth for the foreign-born population - Bangladesh (%)
Place of birth for the foreign-born population - India (%)
Place of birth for the foreign-born population - Iran (%)
Place of birth for the foreign-born population - Kazakhstan (%)
Place of birth for the foreign-born population - Nepal (%)
Place of birth for the foreign-born population - Pakistan (%)
Place of birth for the foreign-born population - Sri Lanka (%)
Place of birth for the foreign-born population - Uzbekistan (%)
Place of birth for the foreign-born population - Other South Central Asia (%)
Place of birth for the foreign-born population - Burma (%)
Place of birth for the foreign-born population - Cambodia (%)
Place of birth for the foreign-born population - Indonesia (%)
Place of birth for the foreign-born population - Laos (%)
Place of birth for the foreign-born population - Malaysia (%)
Place of birth for the foreign-born population - Philippines (%)
Place of birth for the foreign-born population - Singapore (%)
Place of birth for the foreign-born population - Thailand (%)
Place of birth for the foreign-born population - Vietnam (%)
Place of birth for the foreign-born population - Other South Eastern Asia (%)
Place of birth for the foreign-born population - Armenia (%)
Place of birth for the foreign-born population - Iraq (%)
Place of birth for the foreign-born population - Israel (%)
Place of birth for the foreign-born population - Jordan (%)
Place of birth for the foreign-born population - Kuwait (%)
Place of birth for the foreign-born population - Lebanon (%)
Place of birth for the foreign-born population - Saudi Arabia (%)
Place of birth for the foreign-born population - Syria (%)
Place of birth for the foreign-born population - Turkey (%)
Place of birth for the foreign-born population - Yemen (%)
Place of birth for the foreign-born population - Other Western Asia (%)
Place of birth for the foreign-born population - Eritrea (%)
Place of birth for the foreign-born population - Ethiopia (%)
Place of birth for the foreign-born population - Kenya (%)
Place of birth for the foreign-born population - Somalia (%)
Place of birth for the foreign-born population - Uganda (%)
Place of birth for the foreign-born population - Zimbabwe (%)
Place of birth for the foreign-born population - Other Eastern Africa (%)
Place of birth for the foreign-born population - Cameroon (%)
Place of birth for the foreign-born population - Congo (%)
Place of birth for the foreign-born population - Democratic Republic of Congo (Zaire) (%)
Place of birth for the foreign-born population - Other Middle Africa (%)
Place of birth for the foreign-born population - Egypt (%)
Place of birth for the foreign-born population - Morocco (%)
Place of birth for the foreign-born population - Sudan (%)
Place of birth for the foreign-born population - Other Northern Africa (%)
Place of birth for the foreign-born population - South Africa (%)
Place of birth for the foreign-born population - Other Southern Africa (%)
Place of birth for the foreign-born population - Cabo Verde (%)
Place of birth for the foreign-born population - Ghana (%)
Place of birth for the foreign-born population - Liberia (%)
Place of birth for the foreign-born population - Nigeria (%)
Place of birth for the foreign-born population - Senegal (%)
Place of birth for the foreign-born population - Sierra Leone (%)
Place of birth for the foreign-born population - Other Western Africa (%)
Place of birth for the foreign-born population - Australia (%)
Place of birth for the foreign-born population - New Zealand (%)
Place of birth for the foreign-born population - Fiji (%)
Place of birth for the foreign-born population - Micronesia (%)
Place of birth for the foreign-born population - Bahamas (%)
Place of birth for the foreign-born population - Barbados (%)
Place of birth for the foreign-born population - Cuba (%)
Place of birth for the foreign-born population - Dominica (%)
Place of birth for the foreign-born population - Dominican Republic (%)
Place of birth for the foreign-born population - Grenada (%)
Place of birth for the foreign-born population - Haiti (%)
Place of birth for the foreign-born population - Jamaica (%)
Place of birth for the foreign-born population - St. Vincent and the Grenadines (%)
Place of birth for the foreign-born population - Trinidad and Tobago (%)
Place of birth for the foreign-born population - West Indies (%)
Place of birth for the foreign-born population - Other Caribbean (%)
Place of birth for the foreign-born population - Belize (%)
Place of birth for the foreign-born population - Costa Rica (%)
Place of birth for the foreign-born population - El Salvador (%)
Place of birth for the foreign-born population - Guatemala (%)
Place of birth for the foreign-born population - Honduras (%)
Place of birth for the foreign-born population - Mexico (%)
Place of birth for the foreign-born population - Nicaragua (%)
Place of birth for the foreign-born population - Panama (%)
Place of birth for the foreign-born population - Other Central America (%)
Place of birth for the foreign-born population - Argentina (%)
Place of birth for the foreign-born population - Bolivia (%)
Place of birth for the foreign-born population - Brazil (%)
Place of birth for the foreign-born population - Chile (%)
Place of birth for the foreign-born population - Colombia (%)
Place of birth for the foreign-born population - Ecuador (%)
Place of birth for the foreign-born population - Guyana (%)
Place of birth for the foreign-born population - Peru (%)
Place of birth for the foreign-born population - Uruguay (%)
Place of birth for the foreign-born population - Venezuela (%)
Place of birth for the foreign-born population - Other South America (%)
Place of birth for the foreign-born population - Canada (%)
Place of birth for the foreign-born population - Other Northern America (%)
Place of birth for the foreign-born population - Other (%)
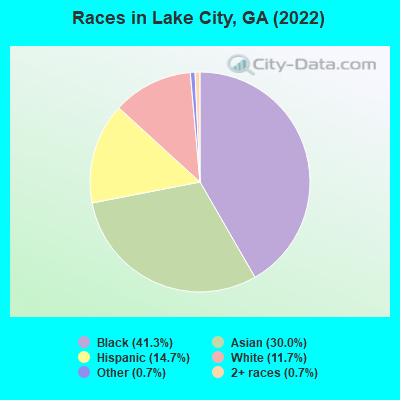
According to 2022 data, the most numerous races in Lake City, GA are White alone (340 residents), Black alone (1,206 residents), and Hispanic (429 residents). 53.4% of Lake City residents speak English at home. 37.3% of Lake City, GA residents are foreign-born (27.5% born in Asia, 8.2% born in Latin America), which is 73.2% greater than the foreign-born rate of 10.0% across the entire state of Georgia.
Race distribution in Lake City
2000 2022
5,128,661 62.6% White alone 2,331,465 28.5% Black alone 435,227 5.3% Hispanic 171,513 2.1% Asian alone 87,364 1.1% Two or more races 17,670 0.2% American Indian alone 11,275 0.1% Other race alone 3,278 0.04% Native Hawaiian and Other
5,415,657 49.6% White alone 3,349,240 30.7% Black alone 1,132,604 10.4% Hispanic 479,156 4.4% Asian alone 462,923 4.2% Two or more races 54,416 0.5% Other race alone 11,923 0.1% American Indian alone 6,957 0.06% Native Hawaiian and Other
Income and house value in Lake City Median household income in 2022 $37,652 White non-Hispanic householders$62,614 Black householders$124,358 Some other race householders$2,894 Two or more races householdersMedian 2022 house value $195,303 White Non-Hispanic householders$181,765 Black or African American householders $130,054 Asian householders$232,588 Some other race householders$249,677 Two or more races householders$249,677 Hispanic or Latino householders
Median age by race in Lake City
68.1 Median age for White residents59.9 67.5 31.8 Median age for Black or African American residents38.7 25.6 -566,666,666.1 Median age for American Indian / Alaska Native residents-560,327,197.8 -508,361,203.5 52.2 Median age for Asian residents54.0 46.5 -657,243,815.6 Median age for Native Hawaiian / Pacific Islander residents-693,227,090.9 -776,776,776.0 37.0 Median age for Other race residents44.8 37.3 24.7 Median age for Two or more races residents38.3 25.5 59.9 Median age for White alone residents60.4 59.5 30.7 Median age for Hispanic or Latino residents37.3 25.8
Owner/renter occupied households by race in Lake City
House owners and renters - White residents 72 32.5% Owner occupied150 67.5% Renter occupiedHouse owners and renters - Black or African American residents 69 20.9% Owner occupied261 79.1% Renter occupiedHouse owners and renters - Asian residents 280 96.2% Owner occupied11 3.8% Renter occupiedHouse owners and renters - Other race residents 40 100.0% Owner occupiedHouse owners and renters - Two or more races residents 22 31.2% Owner occupied48 68.8% Renter occupiedHouse owners and renters - White alone residents 82 38.0% Owner occupied133 62.0% Renter occupiedHouse owners and renters - Hispanic or Latino residents 49 36.8% Owner occupied85 63.2% Renter occupied
Language usage in Lake City
English speakers - Total 53.4% of residents of Lake City speak English at home.
14.8% of residents speak Spanish at home 168 40.8% Speak English very well244 59.2% Speak English less than very well37.9% of residents speak other language at home 316 29.9% Speak English very well740 70.1% Speak English less than very well
English speakers - Born in the United States 90.5% of residents of Lake City speak English at home.
11.8% of residents speak other language at home 56 100.0% Speak English very well
All residents speak only English at home
English speakers - Foreign-born 0.3% of residents of Lake City speak English at home.
21.7% of residents speak Spanish at home 40 15.9% Speak English very well211 84.1% Speak English less than very well80.4% of residents speak other language at home 186 20.0% Speak English very well744 80.0% Speak English less than very well
White (Caucasian) - Speak another language Native:
11.4% (39)Foreign-born:
89.1% (20)
Asian - Speak another language Native:
93.6% (22)Foreign-born:
95.8% (774)
Other race - Speak another language Native:
68.8% (108)Foreign-born:
93.5% (203)
Hispanic or Latino - Speak another language Native:
81.7% (150)Foreign-born:
98.9% (253)
Foreign-born residents in Lake City 1,087 residents are foreign born (27.5% Asia , 8.2% Latin America ).
This city:
37.3%Georgia:
10.4%
Marital status for residents in Lake City Marital status - White (Caucasian) population 15 years and over
Males 38.5% Never married29.1% Now married7.4% Separated14.2% Widowed10.8% DivorcedFemales 59.1% Never married15.2% Now married2.6% Separated6.7% Widowed16.4% DivorcedWomen who did not give birth in the past 12 months Now married:
38.8% (16)Unmarried:
61.2% (26)
Marital status - Black or African American population 15 years and over
Males 45.9% Never married35.0% Now married0.0% Separated7.3% Widowed11.8% DivorcedFemales 59.5% Never married24.2% Now married1.2% Separated5.5% Widowed9.5% DivorcedWomen who did not give birth in the past 12 months Now married:
16.8% (61)Unmarried:
83.2% (303)
Marital status - Asian population 15 years and over
Males 48.9% Never married34.4% Now married0.0% Separated3.0% Widowed13.6% DivorcedFemales 29.4% Never married32.0% Now married18.3% Separated13.5% Widowed6.9% DivorcedWomen who gave birth in the past 12 months Now married:
87.9% (27)Unmarried:
12.1% (4)
Women who did not give birth in the past 12 months Now married:
24.7% (39)Unmarried:
75.3% (117)
Marital status - Other race population 15 years and over
Males 44.5% Never married51.8% Now married0.0% Separated0.0% Widowed3.6% DivorcedFemales 54.1% Never married39.6% Now married0.0% Separated0.0% Widowed6.3% DivorcedWomen who did not give birth in the past 12 months Now married:
32.9% (43)Unmarried:
67.1% (87)
Marital status - Two or more races population 15 years and over
Males 20.0% Never married33.3% Now married0.0% Separated0.0% Widowed46.7% DivorcedFemales 88.2% Never married11.8% Now married0.0% Separated0.0% Widowed0.0% DivorcedWomen who did not give birth in the past 12 months Now married:
8.2% (6)Unmarried:
91.8% (69)
Marital status - White alone, not Hispanic / Latino population 15 years and over
Males 36.9% Never married32.8% Now married0.0% Separated17.2% Widowed13.1% DivorcedFemales 60.6% Never married15.4% Now married0.0% Separated6.1% Widowed17.9% DivorcedWomen who did not give birth in the past 12 months Now married:
30.2% (14)Unmarried:
69.8% (32)
Marital status - Hispanic or Latino population 15 years and over
Males 42.7% Never married42.0% Now married7.7% Separated0.0% Widowed7.7% DivorcedFemales 63.6% Never married26.7% Now married4.0% Separated1.7% Widowed4.0% DivorcedWomen who did not give birth in the past 12 months Now married:
25.0% (39)Unmarried:
75.0% (117)
Ancestries in Lake City
54 2.9% American16 0.9% Jamaican14 0.8% Polish9 0.5% Guyanese9 0.5% Nigerian9 0.5% African7 0.4% English7 0.4% European7 0.4% German7 0.4% Hungarian
Children Nativity (place of birth) in Lake City
Children under 6 years - Living with two parents Both parents native 54 100.0% NativeBoth parents foreign-born 36 100.0% NativeChildren under 6 years - Living with one parent Native parent 23 100.0% NativeForeign-born parent 33 100.0% NativeChildren 6 to 17 years - Living with two parents Both parents native 44 80.0% Native11 20.0% Foreign-bornBoth parents foreign-born 51 80.2% Native12 19.8% Foreign-bornOne native, one foreign-born parent 32 100.0% NativeChildren 6 to 17 years - Living with one parent Native parent 1 53.2% Foreign-bornForeign-born parent 139 71.8% Native55 28.2% Foreign-born
Grandparents responsible for own grandchildren in Lake City
Grandparents (30 to 59 years) Black or African American 13 100.0% Not responsible for grandchildrenAsian 8 85.6% Responsible for grandchildren1 14.4% Not responsible for grandchildrenOther race 19 100.0% Not responsible for grandchildrenHispanic or Latino 14 100.0% Not responsible for grandchildren
Grandparents (60 years and over) Black or African American 5 100.0% Not responsible for grandchildrenAsian 26 100.0% Not responsible for grandchildrenOther race 11 100.0% Not responsible for grandchildrenHispanic or Latino 16 100.0% Not responsible for grandchildren