Races in Lake Jackson, Texas (TX) Detailed Stats
Data:
Races - White alone (%)
Races - White alone (% change since 2000)
Races - Black alone (%)
Races - Black alone (% change since 2000)
Races - American Indian alone (%)
Races - American Indian alone (% change since 2000)
Races - Asian alone (%)
Races - Asian alone (% change since 2000)
Races - Hispanic (%)
Races - Hispanic (% change since 2000)
Races - Native Hawaiian and Other Pacific Islander alone (%)
Races - Native Hawaiian and Other Pacific Islander alone (% change since 2000)
Races - Two or more races(%)
Races - Two or more races(% change since 2000)
Races - Other race alone (%)
Races - Other race alone (% change since 2000)
Racial diversity
Place of birth - Born in state of residence (%)
Place of birth - Born in state of residence (%) - White
Place of birth - Born in state of residence (%) - Black or African American
Place of birth - Born in state of residence (%) - Asian
Place of birth - Born in state of residence (%) - Hispanic or Latino
Place of birth - Born in state of residence (%) - American Indian and Alaska Native
Place of birth - Born in state of residence (%) - Multirace
Place of birth - Born in state of residence (%) - Other Race
Place of birth - Born in other state (%)
Place of birth - Born in other state (%) - White
Place of birth - Born in other state (%) - Black or African American
Place of birth - Born in other state (%) - Asian
Place of birth - Born in other state (%) - Hispanic or Latino
Place of birth - Born in other state (%) - American Indian and Alaska Native
Place of birth - Born in other state (%) - Multirace
Place of birth - Born in other state (%) - Other Race
Place of birth - Native, outside of US (%)
Place of birth - Native, outside of US (%) - White
Place of birth - Native, outside of US (%) - Black or African American
Place of birth - Native, outside of US (%) - Asian
Place of birth - Native, outside of US (%) - Hispanic or Latino
Place of birth - Native, outside of US (%) - American Indian and Alaska Native
Place of birth - Native, outside of US (%) - Multirace
Place of birth - Native, outside of US (%) - Other Race
Place of birth - Foreign born (%)
Place of birth - Foreign born (%) - White
Place of birth - Foreign born (%) - Black or African American
Place of birth - Foreign born (%) - Asian
Place of birth - Foreign born (%) - Hispanic or Latino
Place of birth - Foreign born (%) - American Indian and Alaska Native
Place of birth - Foreign born (%) - Multirace
Place of birth - Foreign born (%) - Other Race
Residents speaking English at home (%)
Residents speaking English at home - Born in the United States (%)
Residents speaking English at home - Native, born elsewhere (%)
Residents speaking English at home - Foreign born (%)
Residents speaking Spanish at home (%)
Residents speaking Spanish at home - Born in the United States (%)
Residents speaking Spanish at home - Native, born elsewhere (%)
Residents speaking Spanish at home - Foreign born (%)
Residents speaking other language at home (%)
Residents speaking other language at home - Born in the United States (%)
Residents speaking other language at home - Native, born elsewhere (%)
Residents speaking other language at home - Foreign born (%)
Marital status - Never married (%)
Marital status - Now married (%)
Marital status - Separated (%)
Marital status - Widowed (%)
Marital status - Divorced (%)
Ancestries Reported - Arab (%)
Ancestries Reported - Czech (%)
Ancestries Reported - Danish (%)
Ancestries Reported - Dutch (%)
Ancestries Reported - English (%)
Ancestries Reported - French (%)
Ancestries Reported - French Canadian (%)
Ancestries Reported - German (%)
Ancestries Reported - Greek (%)
Ancestries Reported - Hungarian (%)
Ancestries Reported - Irish (%)
Ancestries Reported - Italian (%)
Ancestries Reported - Lithuanian (%)
Ancestries Reported - Norwegian (%)
Ancestries Reported - Polish (%)
Ancestries Reported - Portuguese (%)
Ancestries Reported - Russian (%)
Ancestries Reported - Scotch-Irish (%)
Ancestries Reported - Scottish (%)
Ancestries Reported - Slovak (%)
Ancestries Reported - Subsaharan African (%)
Ancestries Reported - Swedish (%)
Ancestries Reported - Swiss (%)
Ancestries Reported - Ukrainian (%)
Ancestries Reported - United States (%)
Ancestries Reported - Welsh (%)
Ancestries Reported - West Indian (%)
Ancestries Reported - Other (%)
Geographical mobility - Same house 1 year ago (%)
Geographical mobility - Same house 1 year ago (%) - White
Geographical mobility - Same house 1 year ago (%) - Black or African American
Geographical mobility - Same house 1 year ago (%) - Asian
Geographical mobility - Same house 1 year ago (%) - Hispanic or Latino
Geographical mobility - Same house 1 year ago (%) - American Indian and Alaska Native
Geographical mobility - Same house 1 year ago (%) - Multirace
Geographical mobility - Same house 1 year ago (%) - Other Race
Geographical mobility - Moved within same county (%)
Geographical mobility - Moved within same county (%) - White
Geographical mobility - Moved within same county (%) - Black or African American
Geographical mobility - Moved within same county (%) - Asian
Geographical mobility - Moved within same county (%) - Hispanic or Latino
Geographical mobility - Moved within same county (%) - American Indian and Alaska Native
Geographical mobility - Moved within same county (%) - Multirace
Geographical mobility - Moved within same county (%) - Other Race
Geographical mobility - Moved from different county within same state (%)
Geographical mobility - Moved from different county within same state (%) - White
Geographical mobility - Moved from different county within same state (%) - Black or African American
Geographical mobility - Moved from different county within same state (%) - Asian
Geographical mobility - Moved from different county within same state (%) - Hispanic or Latino
Geographical mobility - Moved from different county within same state (%) - American Indian and Alaska Native
Geographical mobility - Moved from different county within same state (%) - Multirace
Geographical mobility - Moved from different county within same state (%) - Other Race
Geographical mobility - Moved from different state (%)
Geographical mobility - Moved from different state (%) - White
Geographical mobility - Moved from different state (%) - Black or African American
Geographical mobility - Moved from different state (%) - Asian
Geographical mobility - Moved from different state (%) - Hispanic or Latino
Geographical mobility - Moved from different state (%) - American Indian and Alaska Native
Geographical mobility - Moved from different state (%) - Multirace
Geographical mobility - Moved from different state (%) - Other Race
Geographical mobility - Moved from abroad (%)
Geographical mobility - Moved from abroad (%) - White
Geographical mobility - Moved from abroad (%) - Black or African American
Geographical mobility - Moved from abroad (%) - Asian
Geographical mobility - Moved from abroad (%) - Hispanic or Latino
Geographical mobility - Moved from abroad (%) - American Indian and Alaska Native
Geographical mobility - Moved from abroad (%) - Multirace
Geographical mobility - Moved from abroad (%) - Other Race
Place of birth for the foreign-born population - Ireland (%)
Place of birth for the foreign-born population - Denmark (%)
Place of birth for the foreign-born population - Norway (%)
Place of birth for the foreign-born population - Sweden (%)
Place of birth for the foreign-born population - United Kingdom (%)
Place of birth for the foreign-born population - England (%)
Place of birth for the foreign-born population - Scotland (%)
Place of birth for the foreign-born population - Other Northern Europe (%)
Place of birth for the foreign-born population - Austria (%)
Place of birth for the foreign-born population - Belgium (%)
Place of birth for the foreign-born population - France (%)
Place of birth for the foreign-born population - Germany (%)
Place of birth for the foreign-born population - Netherlands (%)
Place of birth for the foreign-born population - Switzerland (%)
Place of birth for the foreign-born population - Other Western Europe (%)
Place of birth for the foreign-born population - Greece (%)
Place of birth for the foreign-born population - Italy (%)
Place of birth for the foreign-born population - Portugal (%)
Place of birth for the foreign-born population - Spain (%)
Place of birth for the foreign-born population - Other Southern Europe (%)
Place of birth for the foreign-born population - Albania (%)
Place of birth for the foreign-born population - Belarus (%)
Place of birth for the foreign-born population - Bosnia and Herzegovina (%)
Place of birth for the foreign-born population - Bulgaria (%)
Place of birth for the foreign-born population - Croatia (%)
Place of birth for the foreign-born population - Czechoslovakia (%)
Place of birth for the foreign-born population - Hungary (%)
Place of birth for the foreign-born population - Latvia (%)
Place of birth for the foreign-born population - Lithuania (%)
Place of birth for the foreign-born population - North Macedonia (Macedonia) (%)
Place of birth for the foreign-born population - Moldova (%)
Place of birth for the foreign-born population - Poland (%)
Place of birth for the foreign-born population - Romania (%)
Place of birth for the foreign-born population - Russia (%)
Place of birth for the foreign-born population - Serbia (%)
Place of birth for the foreign-born population - Ukraine (%)
Place of birth for the foreign-born population - Other Eastern Europe (%)
Place of birth for the foreign-born population - China (%)
Place of birth for the foreign-born population - Hong Kong (%)
Place of birth for the foreign-born population - Taiwan (%)
Place of birth for the foreign-born population - Japan (%)
Place of birth for the foreign-born population - Korea (%)
Place of birth for the foreign-born population - Other Eastern Asia (%)
Place of birth for the foreign-born population - Afghanistan (%)
Place of birth for the foreign-born population - Bangladesh (%)
Place of birth for the foreign-born population - India (%)
Place of birth for the foreign-born population - Iran (%)
Place of birth for the foreign-born population - Kazakhstan (%)
Place of birth for the foreign-born population - Nepal (%)
Place of birth for the foreign-born population - Pakistan (%)
Place of birth for the foreign-born population - Sri Lanka (%)
Place of birth for the foreign-born population - Uzbekistan (%)
Place of birth for the foreign-born population - Other South Central Asia (%)
Place of birth for the foreign-born population - Burma (%)
Place of birth for the foreign-born population - Cambodia (%)
Place of birth for the foreign-born population - Indonesia (%)
Place of birth for the foreign-born population - Laos (%)
Place of birth for the foreign-born population - Malaysia (%)
Place of birth for the foreign-born population - Philippines (%)
Place of birth for the foreign-born population - Singapore (%)
Place of birth for the foreign-born population - Thailand (%)
Place of birth for the foreign-born population - Vietnam (%)
Place of birth for the foreign-born population - Other South Eastern Asia (%)
Place of birth for the foreign-born population - Armenia (%)
Place of birth for the foreign-born population - Iraq (%)
Place of birth for the foreign-born population - Israel (%)
Place of birth for the foreign-born population - Jordan (%)
Place of birth for the foreign-born population - Kuwait (%)
Place of birth for the foreign-born population - Lebanon (%)
Place of birth for the foreign-born population - Saudi Arabia (%)
Place of birth for the foreign-born population - Syria (%)
Place of birth for the foreign-born population - Turkey (%)
Place of birth for the foreign-born population - Yemen (%)
Place of birth for the foreign-born population - Other Western Asia (%)
Place of birth for the foreign-born population - Eritrea (%)
Place of birth for the foreign-born population - Ethiopia (%)
Place of birth for the foreign-born population - Kenya (%)
Place of birth for the foreign-born population - Somalia (%)
Place of birth for the foreign-born population - Uganda (%)
Place of birth for the foreign-born population - Zimbabwe (%)
Place of birth for the foreign-born population - Other Eastern Africa (%)
Place of birth for the foreign-born population - Cameroon (%)
Place of birth for the foreign-born population - Congo (%)
Place of birth for the foreign-born population - Democratic Republic of Congo (Zaire) (%)
Place of birth for the foreign-born population - Other Middle Africa (%)
Place of birth for the foreign-born population - Egypt (%)
Place of birth for the foreign-born population - Morocco (%)
Place of birth for the foreign-born population - Sudan (%)
Place of birth for the foreign-born population - Other Northern Africa (%)
Place of birth for the foreign-born population - South Africa (%)
Place of birth for the foreign-born population - Other Southern Africa (%)
Place of birth for the foreign-born population - Cabo Verde (%)
Place of birth for the foreign-born population - Ghana (%)
Place of birth for the foreign-born population - Liberia (%)
Place of birth for the foreign-born population - Nigeria (%)
Place of birth for the foreign-born population - Senegal (%)
Place of birth for the foreign-born population - Sierra Leone (%)
Place of birth for the foreign-born population - Other Western Africa (%)
Place of birth for the foreign-born population - Australia (%)
Place of birth for the foreign-born population - New Zealand (%)
Place of birth for the foreign-born population - Fiji (%)
Place of birth for the foreign-born population - Micronesia (%)
Place of birth for the foreign-born population - Bahamas (%)
Place of birth for the foreign-born population - Barbados (%)
Place of birth for the foreign-born population - Cuba (%)
Place of birth for the foreign-born population - Dominica (%)
Place of birth for the foreign-born population - Dominican Republic (%)
Place of birth for the foreign-born population - Grenada (%)
Place of birth for the foreign-born population - Haiti (%)
Place of birth for the foreign-born population - Jamaica (%)
Place of birth for the foreign-born population - St. Vincent and the Grenadines (%)
Place of birth for the foreign-born population - Trinidad and Tobago (%)
Place of birth for the foreign-born population - West Indies (%)
Place of birth for the foreign-born population - Other Caribbean (%)
Place of birth for the foreign-born population - Belize (%)
Place of birth for the foreign-born population - Costa Rica (%)
Place of birth for the foreign-born population - El Salvador (%)
Place of birth for the foreign-born population - Guatemala (%)
Place of birth for the foreign-born population - Honduras (%)
Place of birth for the foreign-born population - Mexico (%)
Place of birth for the foreign-born population - Nicaragua (%)
Place of birth for the foreign-born population - Panama (%)
Place of birth for the foreign-born population - Other Central America (%)
Place of birth for the foreign-born population - Argentina (%)
Place of birth for the foreign-born population - Bolivia (%)
Place of birth for the foreign-born population - Brazil (%)
Place of birth for the foreign-born population - Chile (%)
Place of birth for the foreign-born population - Colombia (%)
Place of birth for the foreign-born population - Ecuador (%)
Place of birth for the foreign-born population - Guyana (%)
Place of birth for the foreign-born population - Peru (%)
Place of birth for the foreign-born population - Uruguay (%)
Place of birth for the foreign-born population - Venezuela (%)
Place of birth for the foreign-born population - Other South America (%)
Place of birth for the foreign-born population - Canada (%)
Place of birth for the foreign-born population - Other Northern America (%)
Place of birth for the foreign-born population - Other (%)
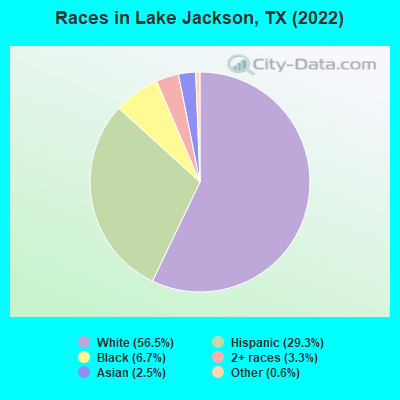
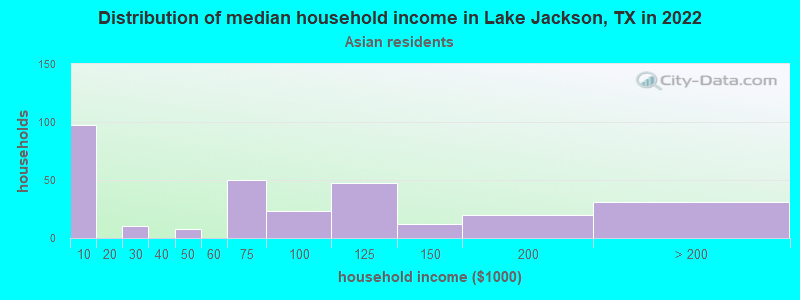
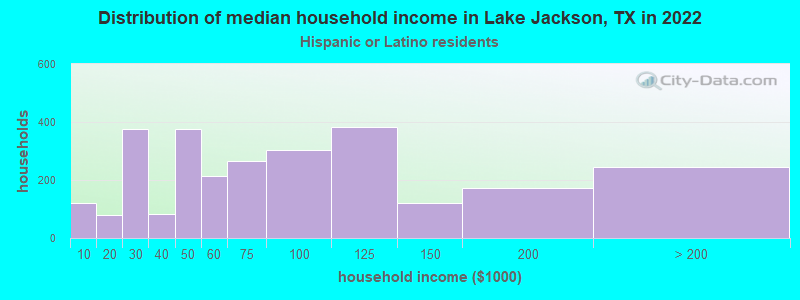
According to 2022 data, the most numerous races in Lake Jackson, TX are Hispanic (8,480 residents), White alone (16,370 residents), and Black alone (1,955 residents). 78.9% of Lake Jackson residents speak English at home. 8.2% of Lake Jackson, TX residents are foreign-born (5.0% born in Latin America, 2.1% born in Asia), which is 106.6% less than the foreign-born rate of 17.0% across the entire state of Texas.
Race distribution in Lake Jackson
2000 2022
10,933,313 52.4% White alone 6,669,666 32.0% Hispanic 2,364,255 11.3% Black alone 554,445 2.7% Asian alone 230,567 1.1% Two or more races 68,859 0.3% American Indian alone 19,958 0.10% Other race alone 10,757 0.05% Native Hawaiian and Other
12,070,642 40.2% Hispanic 11,683,430 38.9% White alone 3,508,706 11.7% Black alone 1,608,173 5.4% Asian alone 956,560 3.2% Two or more races 125,763 0.4% Other race alone 47,023 0.2% American Indian alone 29,275 0.10% Native Hawaiian and Other
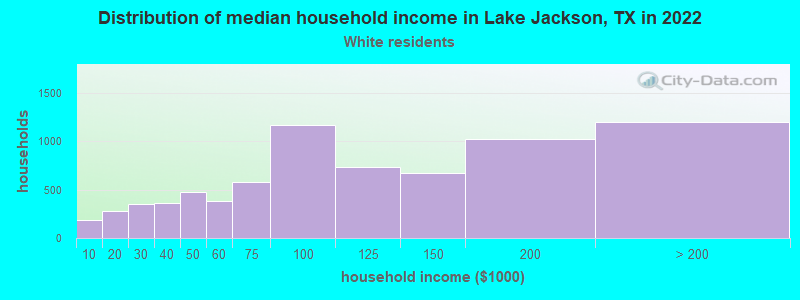
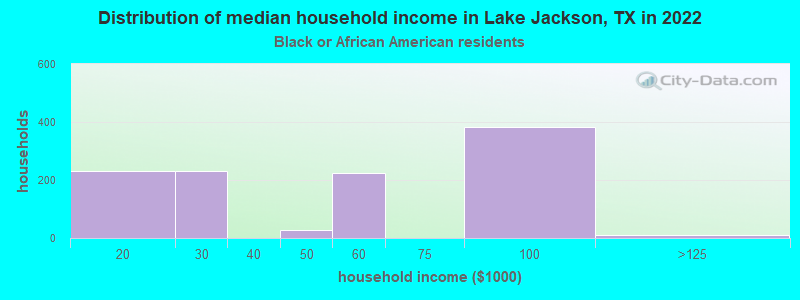
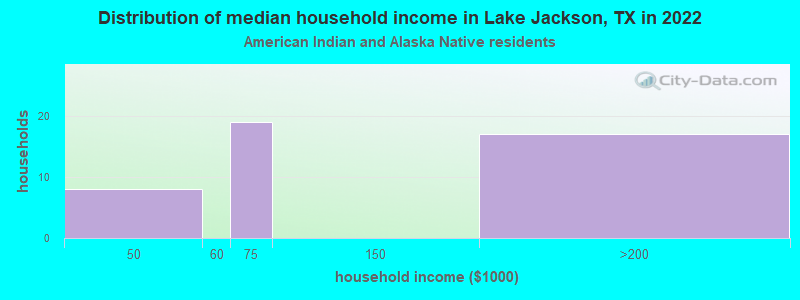
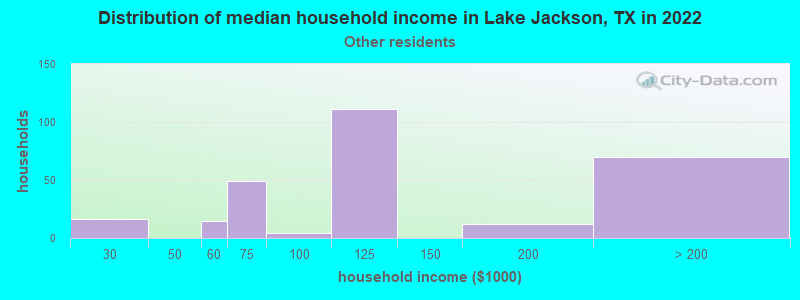
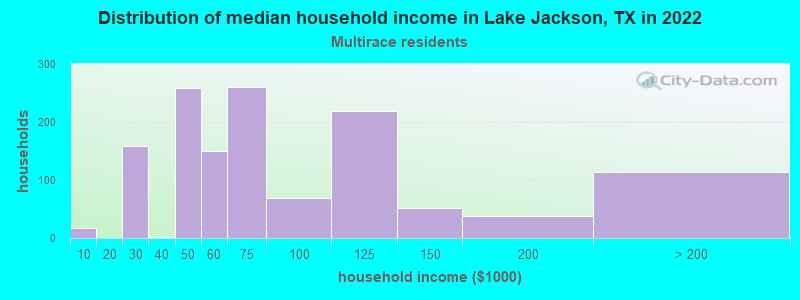
Income and house value in Lake Jackson Median household income in 2022 $102,135 White non-Hispanic householders$48,703 Black householders$88,196 Asian householders$86,702 Some other race householders$62,829 Two or more races householders$70,685 Hispanic or Latino race householdersMedian 2022 house value $261,151 White Non-Hispanic householders$284,097 Black or African American householders$102,439 American Indian or Alaska Native householders $396,370 Asian householders$216,351 Some other race householders$207,063 Two or more races householders$214,165 Hispanic or Latino householders
Median age by race in Lake Jackson
37.8 Median age for White residents34.4 42.4 26.2 Median age for Black or African American residents25.2 31.1 74.3 Median age for American Indian / Alaska Native residents53.3 -726,368,158.5 41.0 Median age for Asian residents31.0 44.5 -1,307,359,306.1 Median age for Native Hawaiian / Pacific Islander residents-688,430,698.1 -577,777,777.2 41.4 Median age for Other race residents34.3 42.6 29.8 Median age for Two or more races residents23.5 32.3 41.5 Median age for White alone residents38.0 44.2 26.5 Median age for Hispanic or Latino residents25.8 30.8
Owner/renter occupied households by race in Lake Jackson
House owners and renters - White residents 5,183 70.8% Owner occupied2,133 29.2% Renter occupiedHouse owners and renters - Black or African American residents 345 38.9% Owner occupied543 61.1% Renter occupiedHouse owners and renters - American Indian / Alaska Native residents 18 100.0% Owner occupiedHouse owners and renters - Asian residents 88 28.0% Owner occupied227 72.0% Renter occupiedHouse owners and renters - Other race residents 124 44.8% Owner occupied153 55.2% Renter occupiedHouse owners and renters - Two or more races residents 1,046 83.6% Owner occupied204 16.4% Renter occupiedHouse owners and renters - White alone residents 4,899 73.5% Owner occupied1,764 26.5% Renter occupiedHouse owners and renters - Hispanic or Latino residents 1,528 56.8% Owner occupied1,162 43.2% Renter occupied
Language usage in Lake Jackson
English speakers - Total 78.9% of residents of Lake Jackson speak English at home.
17.7% of residents speak Spanish at home 3,912 81.3% Speak English very well899 18.7% Speak English less than very well3.1% of residents speak other language at home 709 83.3% Speak English very well142 16.7% Speak English less than very well
English speakers - Born in the United States 91.1% of residents of Lake Jackson speak English at home.
5.4% of residents speak Spanish at home 413 100.0% Speak English very well3.2% of residents speak other language at home 242 96.8% Speak English very well8 3.2% Speak English less than very well
English speakers - Native, born elsewhere 60.3% of residents of Lake Jackson speak English at home.
39.4% of residents speak Spanish at home 96 82.1% Speak English very well21 17.9% Speak English less than very well2.7% of residents speak other language at home 8 100.0% Speak English very well
English speakers - Foreign-born 13.5% of residents of Lake Jackson speak English at home.
62.2% of residents speak Spanish at home 818 57.4% Speak English very well607 42.6% Speak English less than very well24.1% of residents speak other language at home 433 78.6% Speak English very well118 21.4% Speak English less than very well
White (Caucasian) - Speak only English Native:
93.2% (15,571)Foreign-born:
21.8% (102)
White (Caucasian) - Speak another language Native:
7.1% (1,189)Foreign-born:
76.6% (358)
Black or African American - Speak only English Native:
100.0% (1,917)Foreign-born:
51.4% (25)
Asian - Speak only English Native:
76.0% (112)Foreign-born:
12.9% (73)
Asian - Speak another language Native:
18.8% (28)Foreign-born:
87.1% (490)
Other race - Speak another language Native:
62.1% (607)Foreign-born:
98.9% (313)
Two or more races - Speak only English Native:
61.3% (2,305)Foreign-born:
14.9% (112)
Two or more races - Speak another language Native:
38.5% (1,447)Foreign-born:
80.6% (605)
White alone - Speak only English Native:
96.8% (14,817)Foreign-born:
37.0% (111)
White alone - Speak another language Native:
2.9% (451)Foreign-born:
62.6% (187)
Hispanic or Latino - Speak only English Native:
50.8% (3,274)Foreign-born:
5.6% (80)
Hispanic or Latino - Speak another language Native:
49.2% (3,169)Foreign-born:
94.4% (1,341)
Foreign-born residents in Lake Jackson 2,384 residents are foreign born (5.0% Latin America , 2.1% Asia ).
This city:
8.2%Texas:
17.1%
Marital status for residents in Lake Jackson Marital status - White (Caucasian) population 15 years and over
Males 37.5% Never married54.4% Now married0.4% Separated2.0% Widowed5.7% DivorcedFemales 21.3% Never married54.7% Now married2.6% Separated8.5% Widowed13.0% DivorcedWomen who gave birth in the past 12 months Now married:
48.9% (75)Unmarried:
51.1% (78)
Women who did not give birth in the past 12 months Now married:
51.9% (1,749)Unmarried:
48.1% (1,624)
Marital status - Black or African American population 15 years and over
Males 66.5% Never married29.3% Now married0.0% Separated0.8% Widowed3.4% DivorcedFemales 48.1% Never married32.6% Now married0.8% Separated9.5% Widowed9.0% DivorcedWomen who gave birth in the past 12 months Now married:
100.0% (17)Unmarried:
0.0% (0)
Women who did not give birth in the past 12 months Now married:
30.9% (153)Unmarried:
69.1% (341)
Marital status - American Indian / Alaska Native population 15 years and over
Males 0.0% Never married86.2% Now married0.0% Separated0.0% Widowed13.8% DivorcedFemales 0.0% Never married0.0% Now married0.0% Separated100.0% Widowed0.0% DivorcedMarital status - Asian population 15 years and over
Males 48.6% Never married49.7% Now married0.0% Separated1.7% Widowed0.0% DivorcedFemales 6.2% Never married79.9% Now married0.0% Separated5.3% Widowed8.6% DivorcedWomen who did not give birth in the past 12 months Now married:
75.1% (156)Unmarried:
24.9% (52)
Marital status - Other race population 15 years and over
Males 59.5% Never married38.4% Now married0.0% Separated0.0% Widowed2.1% DivorcedFemales 38.9% Never married49.8% Now married0.0% Separated0.0% Widowed11.3% DivorcedWomen who did not give birth in the past 12 months Now married:
45.3% (334)Unmarried:
54.7% (404)
Marital status - Two or more races population 15 years and over
Males 51.2% Never married46.5% Now married0.0% Separated2.0% Widowed0.2% DivorcedFemales 35.2% Never married45.8% Now married0.0% Separated7.9% Widowed11.1% DivorcedWomen who gave birth in the past 12 months Now married:
100.0% (69)Unmarried:
0.0% (0)
Women who did not give birth in the past 12 months Now married:
27.3% (333)Unmarried:
72.7% (886)
Marital status - White alone, not Hispanic / Latino population 15 years and over
Males 33.3% Never married56.9% Now married0.5% Separated2.5% Widowed6.8% DivorcedFemales 17.1% Never married57.6% Now married2.0% Separated8.9% Widowed14.4% DivorcedWomen who gave birth in the past 12 months Now married:
83.3% (74)Unmarried:
16.7% (15)
Women who did not give birth in the past 12 months Now married:
54.6% (1,669)Unmarried:
45.4% (1,388)
Marital status - Hispanic or Latino population 15 years and over
Males 55.7% Never married42.9% Now married0.0% Separated0.4% Widowed1.0% DivorcedFemales 36.8% Never married44.5% Now married2.6% Separated6.2% Widowed9.9% DivorcedWomen who gave birth in the past 12 months Now married:
35.5% (46)Unmarried:
64.5% (84)
Women who did not give birth in the past 12 months Now married:
38.6% (805)Unmarried:
61.4% (1,281)
Ancestries in Lake Jackson
1,404 9.1% American1,030 6.7% English858 5.5% German524 3.4% Irish341 2.2% Italian215 1.4% European200 1.3% French184 1.2% Russian123 0.8% Scotch-Irish106 0.7% Czech102 0.7% Polish98 0.6% British85 0.5% Scottish69 0.4% French Canadian65 0.4% Haitian50 0.3% Canadian49 0.3% Cajun49 0.3% Swedish40 0.3% Danish35 0.2% Czechoslovakian34 0.2% Northern European31 0.2% Dutch30 0.2% Basque30 0.2% Hungarian27 0.2% Slavic24 0.2% Lebanese21 0.1% Scandinavian9 0.06% Austrian6 0.04% Greek5 0.03% Swiss
Geographical mobility in Lake Jackson Same house 1 year ago 13,890 77.4% White (Caucasian)1,942 94.7% Black or African American45 90.5% American Indian / Alaska Native547 74.4% Asian1,150 91.1% Other race4,076 82.4% Two or more races12,983 79.6% White alone, not Hispanic / Latino6,499 76.9% Hispanic or LatinoMoved within same county 2,137 11.9% White / Caucasian32 1.5% Black or African American5 9.6% American Indian / Alaska Native31 2.4% Other race515 10.4% Two or more races1,811 11.1% White alone, not Hispanic / Latino912 10.8% Hispanic or LatinoMoved within same state 1,779 9.9% White / Caucasian9 0.5% Black or African American227 4.6% Two or more races1,255 7.7% White alone, not Hispanic / Latino1,032 12.2% Hispanic or LatinoMoved from different state 247 1.4% White / Caucasian201 27.4% Asian12 1.0% Other race23 0.5% Two or more races234 1.4% White alone, not Hispanic / Latino64 0.8% Hispanic or LatinoMoved from abroad 87 0.5% White82 11.2% Asian16 1.3% Other race98 0.6% White alone, not Hispanic / Latino
Children Nativity (place of birth) in Lake Jackson
Children under 6 years - Living with two parents Both parents native 1,138 100.0% NativeOne native, one foreign-born parent 203 100.0% NativeChildren under 6 years - Living with one parent Native parent 582 100.0% NativeForeign-born parent 60 100.0% NativeChildren 6 to 17 years - Living with two parents Both parents native 2,076 98.0% Native41 2.0% Foreign-bornBoth parents foreign-born 256 100.0% NativeOne native, one foreign-born parent 420 100.0% NativeChildren 6 to 17 years - Living with one parent Native parent 1,900 100.0% NativeForeign-born parent 262 52.5% Native237 47.5% Foreign-born
Grandparents responsible for own grandchildren in Lake Jackson
Grandparents (30 to 59 years) White / Caucasian 62 58.7% Responsible for grandchildren43 41.3% Not responsible for grandchildrenTwo or more races 20 100.0% Responsible for grandchildrenWhite alone, not Hispanic / Latino 68 66.2% Responsible for grandchildren35 33.8% Not responsible for grandchildrenHispanic or Latino 48 59.8% Responsible for grandchildren32 40.2% Not responsible for grandchildrenGrandparents (60 years and over) White / Caucasian 49 25.1% Responsible for grandchildren146 74.9% Not responsible for grandchildrenWhite alone, not Hispanic / Latino 64 28.0% Responsible for grandchildren164 72.0% Not responsible for grandchildrenHispanic or Latino 35 100.0% Not responsible for grandchildren