Races in Lakewood, Ohio (OH) Detailed Stats
Data:
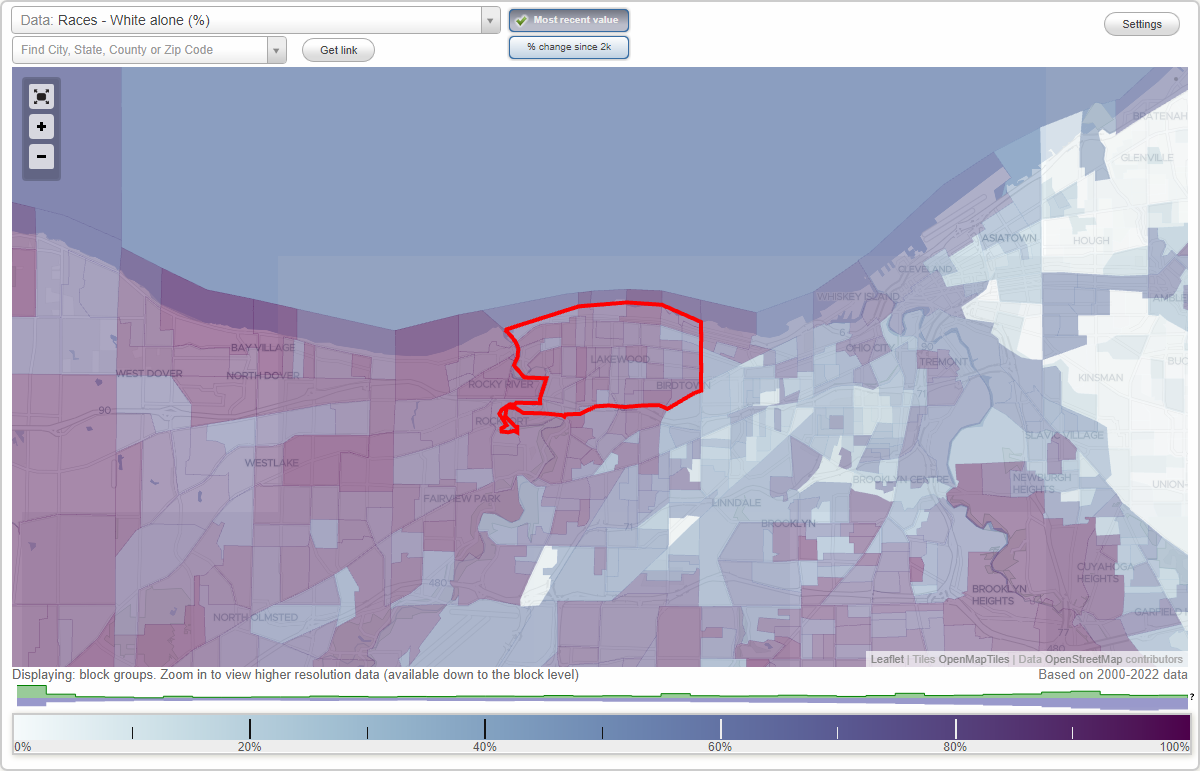
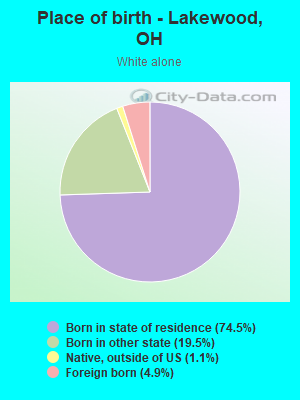
Races - White alone (%)
Races - White alone (% change since 2000)
Races - Black alone (%)
Races - Black alone (% change since 2000)
Races - American Indian alone (%)
Races - American Indian alone (% change since 2000)
Races - Asian alone (%)
Races - Asian alone (% change since 2000)
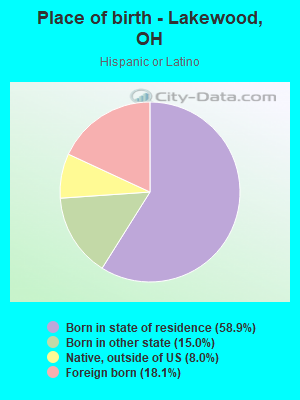
Races - Hispanic (%)
Races - Hispanic (% change since 2000)
Races - Native Hawaiian and Other Pacific Islander alone (%)
Races - Native Hawaiian and Other Pacific Islander alone (% change since 2000)
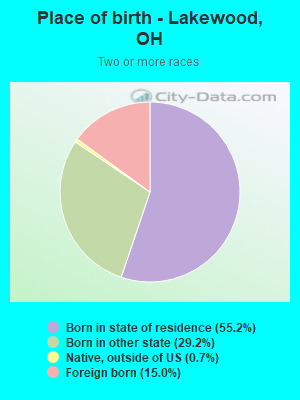
Races - Two or more races(%)
Races - Two or more races(% change since 2000)
Races - Other race alone (%)
Races - Other race alone (% change since 2000)
Racial diversity
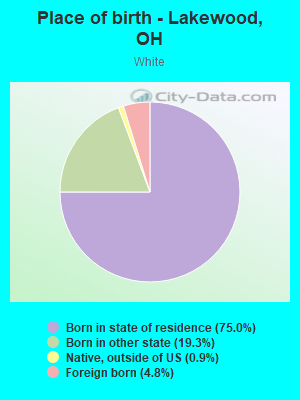
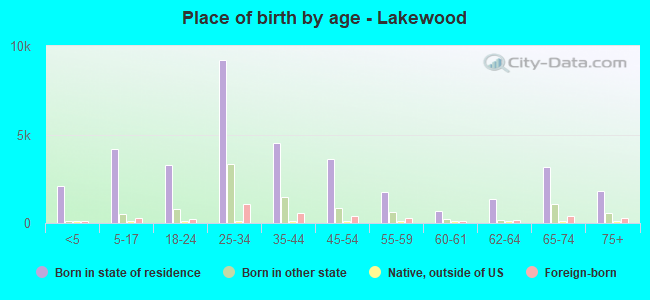
Place of birth - Born in state of residence (%)
Place of birth - Born in state of residence (%) - White
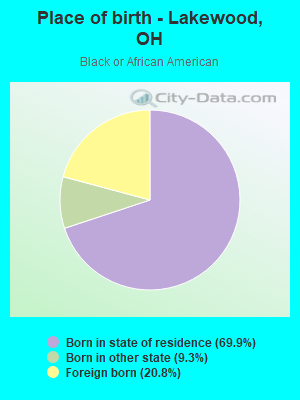
Place of birth - Born in state of residence (%) - Black or African American
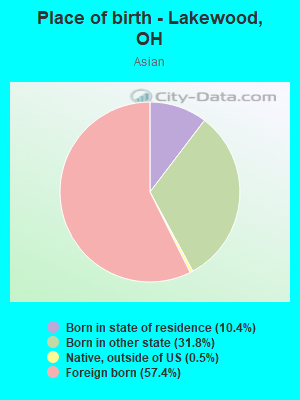
Place of birth - Born in state of residence (%) - Asian
Place of birth - Born in state of residence (%) - Hispanic or Latino
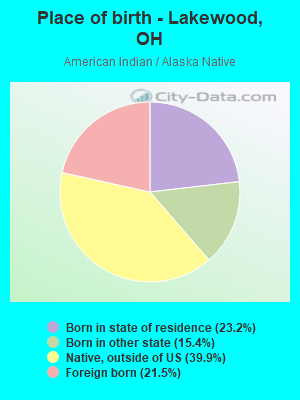
Place of birth - Born in state of residence (%) - American Indian and Alaska Native
Place of birth - Born in state of residence (%) - Multirace
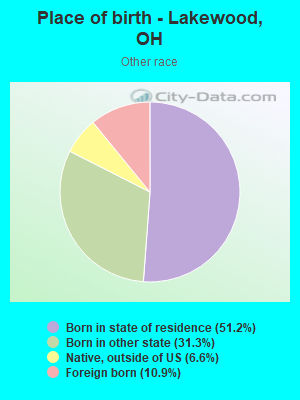
Place of birth - Born in state of residence (%) - Other Race
Place of birth - Born in other state (%)
Place of birth - Born in other state (%) - White
Place of birth - Born in other state (%) - Black or African American
Place of birth - Born in other state (%) - Asian
Place of birth - Born in other state (%) - Hispanic or Latino
Place of birth - Born in other state (%) - American Indian and Alaska Native
Place of birth - Born in other state (%) - Multirace
Place of birth - Born in other state (%) - Other Race
Place of birth - Native, outside of US (%)
Place of birth - Native, outside of US (%) - White
Place of birth - Native, outside of US (%) - Black or African American
Place of birth - Native, outside of US (%) - Asian
Place of birth - Native, outside of US (%) - Hispanic or Latino
Place of birth - Native, outside of US (%) - American Indian and Alaska Native
Place of birth - Native, outside of US (%) - Multirace
Place of birth - Native, outside of US (%) - Other Race
Place of birth - Foreign born (%)
Place of birth - Foreign born (%) - White
Place of birth - Foreign born (%) - Black or African American
Place of birth - Foreign born (%) - Asian
Place of birth - Foreign born (%) - Hispanic or Latino
Place of birth - Foreign born (%) - American Indian and Alaska Native
Place of birth - Foreign born (%) - Multirace
Place of birth - Foreign born (%) - Other Race
Residents speaking English at home (%)
Residents speaking English at home - Born in the United States (%)
Residents speaking English at home - Native, born elsewhere (%)
Residents speaking English at home - Foreign born (%)
Residents speaking Spanish at home (%)
Residents speaking Spanish at home - Born in the United States (%)
Residents speaking Spanish at home - Native, born elsewhere (%)
Residents speaking Spanish at home - Foreign born (%)
Residents speaking other language at home (%)
Residents speaking other language at home - Born in the United States (%)
Residents speaking other language at home - Native, born elsewhere (%)
Residents speaking other language at home - Foreign born (%)
Marital status - Never married (%)
Marital status - Now married (%)
Marital status - Separated (%)
Marital status - Widowed (%)
Marital status - Divorced (%)
Ancestries Reported - Arab (%)
Ancestries Reported - Czech (%)
Ancestries Reported - Danish (%)
Ancestries Reported - Dutch (%)
Ancestries Reported - English (%)
Ancestries Reported - French (%)
Ancestries Reported - French Canadian (%)
Ancestries Reported - German (%)
Ancestries Reported - Greek (%)
Ancestries Reported - Hungarian (%)
Ancestries Reported - Irish (%)
Ancestries Reported - Italian (%)
Ancestries Reported - Lithuanian (%)
Ancestries Reported - Norwegian (%)
Ancestries Reported - Polish (%)
Ancestries Reported - Portuguese (%)
Ancestries Reported - Russian (%)
Ancestries Reported - Scotch-Irish (%)
Ancestries Reported - Scottish (%)
Ancestries Reported - Slovak (%)
Ancestries Reported - Subsaharan African (%)
Ancestries Reported - Swedish (%)
Ancestries Reported - Swiss (%)
Ancestries Reported - Ukrainian (%)
Ancestries Reported - United States (%)
Ancestries Reported - Welsh (%)
Ancestries Reported - West Indian (%)
Ancestries Reported - Other (%)
Geographical mobility - Same house 1 year ago (%)
Geographical mobility - Same house 1 year ago (%) - White
Geographical mobility - Same house 1 year ago (%) - Black or African American
Geographical mobility - Same house 1 year ago (%) - Asian
Geographical mobility - Same house 1 year ago (%) - Hispanic or Latino
Geographical mobility - Same house 1 year ago (%) - American Indian and Alaska Native
Geographical mobility - Same house 1 year ago (%) - Multirace
Geographical mobility - Same house 1 year ago (%) - Other Race
Geographical mobility - Moved within same county (%)
Geographical mobility - Moved within same county (%) - White
Geographical mobility - Moved within same county (%) - Black or African American
Geographical mobility - Moved within same county (%) - Asian
Geographical mobility - Moved within same county (%) - Hispanic or Latino
Geographical mobility - Moved within same county (%) - American Indian and Alaska Native
Geographical mobility - Moved within same county (%) - Multirace
Geographical mobility - Moved within same county (%) - Other Race
Geographical mobility - Moved from different county within same state (%)
Geographical mobility - Moved from different county within same state (%) - White
Geographical mobility - Moved from different county within same state (%) - Black or African American
Geographical mobility - Moved from different county within same state (%) - Asian
Geographical mobility - Moved from different county within same state (%) - Hispanic or Latino
Geographical mobility - Moved from different county within same state (%) - American Indian and Alaska Native
Geographical mobility - Moved from different county within same state (%) - Multirace
Geographical mobility - Moved from different county within same state (%) - Other Race
Geographical mobility - Moved from different state (%)
Geographical mobility - Moved from different state (%) - White
Geographical mobility - Moved from different state (%) - Black or African American
Geographical mobility - Moved from different state (%) - Asian
Geographical mobility - Moved from different state (%) - Hispanic or Latino
Geographical mobility - Moved from different state (%) - American Indian and Alaska Native
Geographical mobility - Moved from different state (%) - Multirace
Geographical mobility - Moved from different state (%) - Other Race
Geographical mobility - Moved from abroad (%)
Geographical mobility - Moved from abroad (%) - White
Geographical mobility - Moved from abroad (%) - Black or African American
Geographical mobility - Moved from abroad (%) - Asian
Geographical mobility - Moved from abroad (%) - Hispanic or Latino
Geographical mobility - Moved from abroad (%) - American Indian and Alaska Native
Geographical mobility - Moved from abroad (%) - Multirace
Geographical mobility - Moved from abroad (%) - Other Race
Place of birth for the foreign-born population - Ireland (%)
Place of birth for the foreign-born population - Denmark (%)
Place of birth for the foreign-born population - Norway (%)
Place of birth for the foreign-born population - Sweden (%)
Place of birth for the foreign-born population - United Kingdom (%)
Place of birth for the foreign-born population - England (%)
Place of birth for the foreign-born population - Scotland (%)
Place of birth for the foreign-born population - Other Northern Europe (%)
Place of birth for the foreign-born population - Austria (%)
Place of birth for the foreign-born population - Belgium (%)
Place of birth for the foreign-born population - France (%)
Place of birth for the foreign-born population - Germany (%)
Place of birth for the foreign-born population - Netherlands (%)
Place of birth for the foreign-born population - Switzerland (%)
Place of birth for the foreign-born population - Other Western Europe (%)
Place of birth for the foreign-born population - Greece (%)
Place of birth for the foreign-born population - Italy (%)
Place of birth for the foreign-born population - Portugal (%)
Place of birth for the foreign-born population - Spain (%)
Place of birth for the foreign-born population - Other Southern Europe (%)
Place of birth for the foreign-born population - Albania (%)
Place of birth for the foreign-born population - Belarus (%)
Place of birth for the foreign-born population - Bosnia and Herzegovina (%)
Place of birth for the foreign-born population - Bulgaria (%)
Place of birth for the foreign-born population - Croatia (%)
Place of birth for the foreign-born population - Czechoslovakia (%)
Place of birth for the foreign-born population - Hungary (%)
Place of birth for the foreign-born population - Latvia (%)
Place of birth for the foreign-born population - Lithuania (%)
Place of birth for the foreign-born population - North Macedonia (Macedonia) (%)
Place of birth for the foreign-born population - Moldova (%)
Place of birth for the foreign-born population - Poland (%)
Place of birth for the foreign-born population - Romania (%)
Place of birth for the foreign-born population - Russia (%)
Place of birth for the foreign-born population - Serbia (%)
Place of birth for the foreign-born population - Ukraine (%)
Place of birth for the foreign-born population - Other Eastern Europe (%)
Place of birth for the foreign-born population - China (%)
Place of birth for the foreign-born population - Hong Kong (%)
Place of birth for the foreign-born population - Taiwan (%)
Place of birth for the foreign-born population - Japan (%)
Place of birth for the foreign-born population - Korea (%)
Place of birth for the foreign-born population - Other Eastern Asia (%)
Place of birth for the foreign-born population - Afghanistan (%)
Place of birth for the foreign-born population - Bangladesh (%)
Place of birth for the foreign-born population - India (%)
Place of birth for the foreign-born population - Iran (%)
Place of birth for the foreign-born population - Kazakhstan (%)
Place of birth for the foreign-born population - Nepal (%)
Place of birth for the foreign-born population - Pakistan (%)
Place of birth for the foreign-born population - Sri Lanka (%)
Place of birth for the foreign-born population - Uzbekistan (%)
Place of birth for the foreign-born population - Other South Central Asia (%)
Place of birth for the foreign-born population - Burma (%)
Place of birth for the foreign-born population - Cambodia (%)
Place of birth for the foreign-born population - Indonesia (%)
Place of birth for the foreign-born population - Laos (%)
Place of birth for the foreign-born population - Malaysia (%)
Place of birth for the foreign-born population - Philippines (%)
Place of birth for the foreign-born population - Singapore (%)
Place of birth for the foreign-born population - Thailand (%)
Place of birth for the foreign-born population - Vietnam (%)
Place of birth for the foreign-born population - Other South Eastern Asia (%)
Place of birth for the foreign-born population - Armenia (%)
Place of birth for the foreign-born population - Iraq (%)
Place of birth for the foreign-born population - Israel (%)
Place of birth for the foreign-born population - Jordan (%)
Place of birth for the foreign-born population - Kuwait (%)
Place of birth for the foreign-born population - Lebanon (%)
Place of birth for the foreign-born population - Saudi Arabia (%)
Place of birth for the foreign-born population - Syria (%)
Place of birth for the foreign-born population - Turkey (%)
Place of birth for the foreign-born population - Yemen (%)
Place of birth for the foreign-born population - Other Western Asia (%)
Place of birth for the foreign-born population - Eritrea (%)
Place of birth for the foreign-born population - Ethiopia (%)
Place of birth for the foreign-born population - Kenya (%)
Place of birth for the foreign-born population - Somalia (%)
Place of birth for the foreign-born population - Uganda (%)
Place of birth for the foreign-born population - Zimbabwe (%)
Place of birth for the foreign-born population - Other Eastern Africa (%)
Place of birth for the foreign-born population - Cameroon (%)
Place of birth for the foreign-born population - Congo (%)
Place of birth for the foreign-born population - Democratic Republic of Congo (Zaire) (%)
Place of birth for the foreign-born population - Other Middle Africa (%)
Place of birth for the foreign-born population - Egypt (%)
Place of birth for the foreign-born population - Morocco (%)
Place of birth for the foreign-born population - Sudan (%)
Place of birth for the foreign-born population - Other Northern Africa (%)
Place of birth for the foreign-born population - South Africa (%)
Place of birth for the foreign-born population - Other Southern Africa (%)
Place of birth for the foreign-born population - Cabo Verde (%)
Place of birth for the foreign-born population - Ghana (%)
Place of birth for the foreign-born population - Liberia (%)
Place of birth for the foreign-born population - Nigeria (%)
Place of birth for the foreign-born population - Senegal (%)
Place of birth for the foreign-born population - Sierra Leone (%)
Place of birth for the foreign-born population - Other Western Africa (%)
Place of birth for the foreign-born population - Australia (%)
Place of birth for the foreign-born population - New Zealand (%)
Place of birth for the foreign-born population - Fiji (%)
Place of birth for the foreign-born population - Micronesia (%)
Place of birth for the foreign-born population - Bahamas (%)
Place of birth for the foreign-born population - Barbados (%)
Place of birth for the foreign-born population - Cuba (%)
Place of birth for the foreign-born population - Dominica (%)
Place of birth for the foreign-born population - Dominican Republic (%)
Place of birth for the foreign-born population - Grenada (%)
Place of birth for the foreign-born population - Haiti (%)
Place of birth for the foreign-born population - Jamaica (%)
Place of birth for the foreign-born population - St. Vincent and the Grenadines (%)
Place of birth for the foreign-born population - Trinidad and Tobago (%)
Place of birth for the foreign-born population - West Indies (%)
Place of birth for the foreign-born population - Other Caribbean (%)
Place of birth for the foreign-born population - Belize (%)
Place of birth for the foreign-born population - Costa Rica (%)
Place of birth for the foreign-born population - El Salvador (%)
Place of birth for the foreign-born population - Guatemala (%)
Place of birth for the foreign-born population - Honduras (%)
Place of birth for the foreign-born population - Mexico (%)
Place of birth for the foreign-born population - Nicaragua (%)
Place of birth for the foreign-born population - Panama (%)
Place of birth for the foreign-born population - Other Central America (%)
Place of birth for the foreign-born population - Argentina (%)
Place of birth for the foreign-born population - Bolivia (%)
Place of birth for the foreign-born population - Brazil (%)
Place of birth for the foreign-born population - Chile (%)
Place of birth for the foreign-born population - Colombia (%)
Place of birth for the foreign-born population - Ecuador (%)
Place of birth for the foreign-born population - Guyana (%)
Place of birth for the foreign-born population - Peru (%)
Place of birth for the foreign-born population - Uruguay (%)
Place of birth for the foreign-born population - Venezuela (%)
Place of birth for the foreign-born population - Other South America (%)
Place of birth for the foreign-born population - Canada (%)
Place of birth for the foreign-born population - Other Northern America (%)
Place of birth for the foreign-born population - Other (%)
Latest news about races in Lakewood, OH collected exclusively by city-data.com from local newspapers, TV, and radio stations
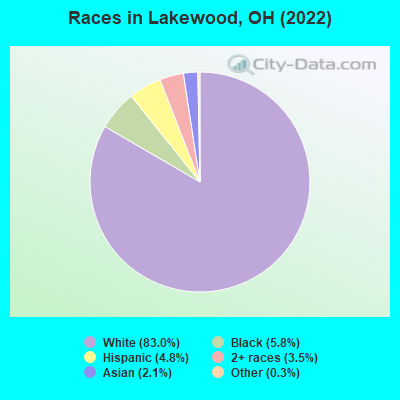
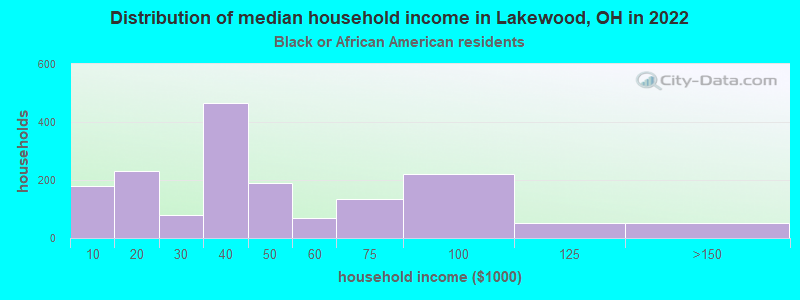
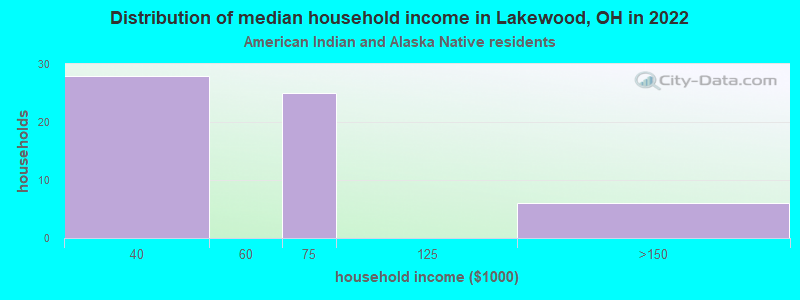
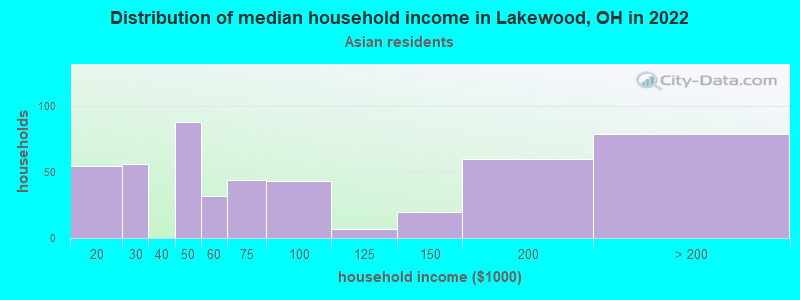
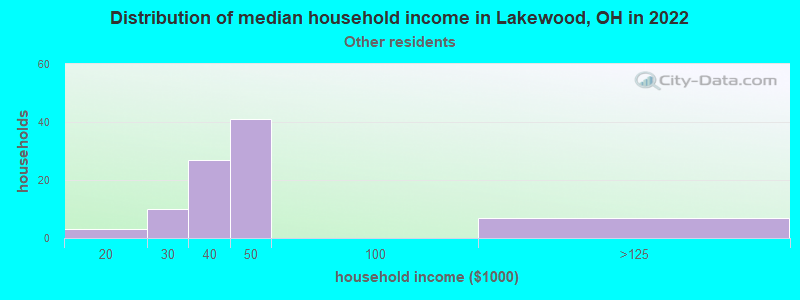
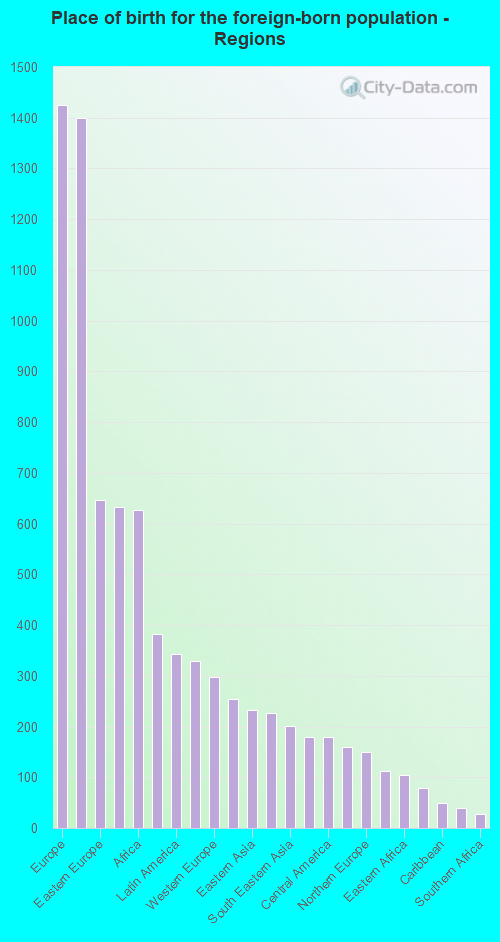
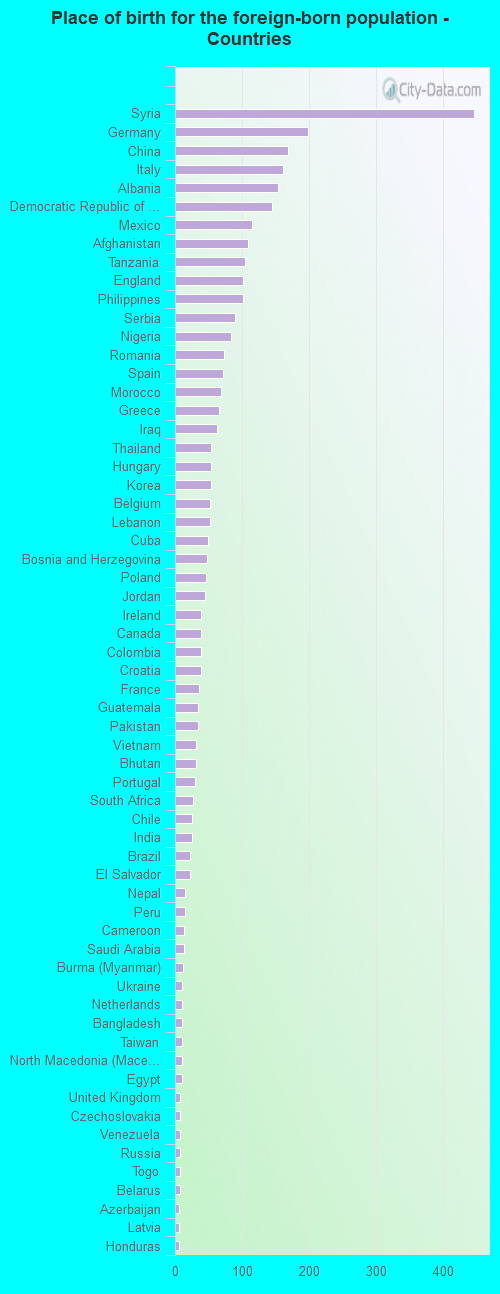
According to 2022 data, the most numerous races in Lakewood, OH are White alone (41,316 residents), Black alone (2,879 residents), and Two or more races (1,722 residents). 90.3% of Lakewood residents speak English at home. 7.7% of Lakewood, OH residents are foreign-born (2.8% born in Europe, 2.7% born in Asia, 1.2% born in Africa), which is 48.1% greater than the foreign-born rate of 4.0% across the entire state of Ohio.
Race distribution in Lakewood
2000 2022
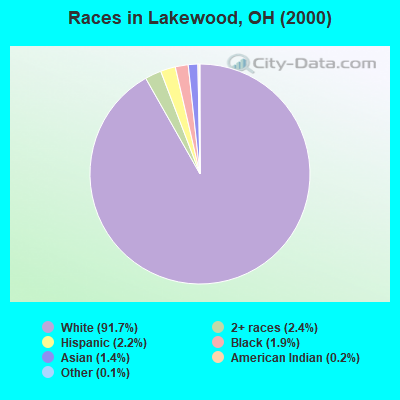
9,538,111 84.0% White alone 1,290,662 11.4% Black alone 217,123 1.9% Hispanic 137,770 1.2% Two or more races 131,670 1.2% Asian alone 21,985 0.2% American Indian alone 13,483 0.1% Other race alone 2,336 0.02% Native Hawaiian and Other
8,948,793 76.1% White alone 1,401,403 11.9% Black alone 529,291 4.5% Two or more races 517,232 4.4% Hispanic 293,387 2.5% Asian alone 52,805 0.4% Other race alone 9,785 0.08% American Indian alone 3,362 0.03% Native Hawaiian and Other
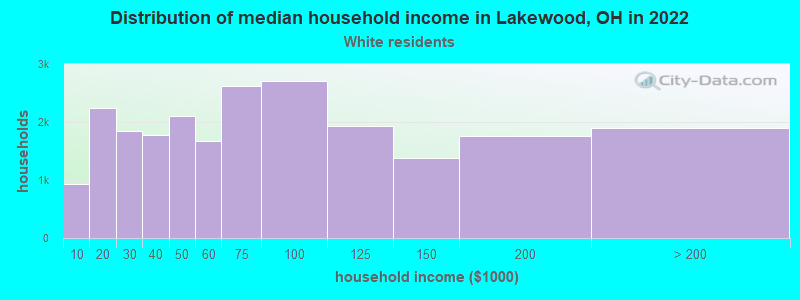
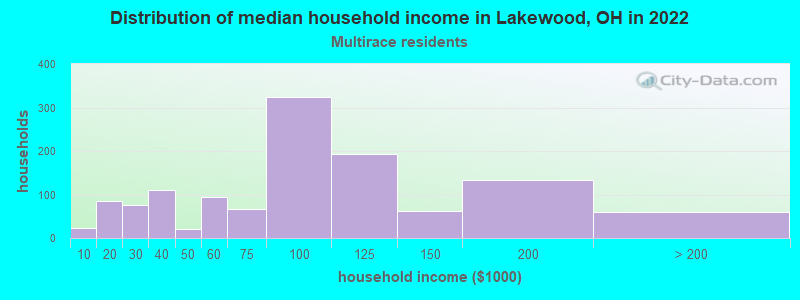
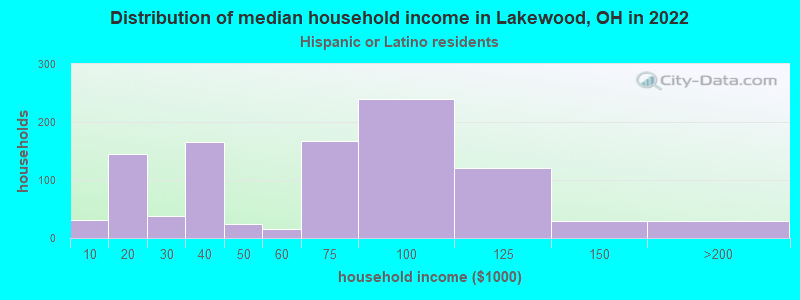
Income and house value in Lakewood Median household income in 2022 $64,709 White non-Hispanic householders$40,313 Black householders$62,791 American Indian and Alaska Native householders$65,404 Asian householders$47,288 Some other race householders$87,580 Two or more races householders$73,330 Hispanic or Latino race householdersMedian 2022 house value $245,128 White Non-Hispanic householders$221,654 Black or African American householders$176,575 American Indian or Alaska Native householders $213,345 Asian householders$285,637 Native Hawaiian and other Pacific Islander householders$259,670 Some other race householders$282,105 Two or more races householders$227,678 Hispanic or Latino householders
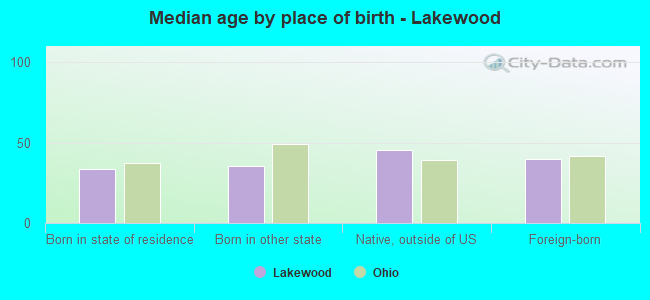
Median age by race in Lakewood
35.5 Median age for White residents35.5 35.5 36.1 Median age for Black or African American residents38.4 33.4 35.4 Median age for American Indian / Alaska Native residents-734,374,999.3 39.2 31.1 Median age for Asian residents29.7 31.5 -706,093,189.3 Median age for Native Hawaiian / Pacific Islander residents-750,242,953.6 -805,394,989.6 30.0 Median age for Other race residents26.3 30.4 27.4 Median age for Two or more races residents28.0 27.7 35.5 Median age for White alone residents35.4 35.7 27.5 Median age for Hispanic or Latino residents27.6 26.8
Owner/renter occupied households by race in Lakewood
House owners and renters - White residents 10,811 47.7% Owner occupied11,872 52.3% Renter occupiedHouse owners and renters - Black or African American residents 206 12.6% Owner occupied1,426 87.4% Renter occupiedHouse owners and renters - American Indian / Alaska Native residents 4 9.1% Owner occupied40 90.9% Renter occupiedHouse owners and renters - Asian residents 224 48.7% Owner occupied236 51.3% Renter occupiedHouse owners and renters - Other race residents 24 29.6% Owner occupied57 70.4% Renter occupiedHouse owners and renters - Two or more races residents 400 31.1% Owner occupied885 68.9% Renter occupiedHouse owners and renters - White alone residents 10,708 47.4% Owner occupied11,903 52.6% Renter occupiedHouse owners and renters - Hispanic or Latino residents 280 27.7% Owner occupied732 72.3% Renter occupied
Language usage in Lakewood
English speakers - Total 90.3% of residents of Lakewood speak English at home.
1.8% of residents speak Spanish at home 667 80.0% Speak English very well167 20.0% Speak English less than very well7.9% of residents speak other language at home 2,488 66.0% Speak English very well1,279 34.0% Speak English less than very well
English speakers - Born in the United States 95.5% of residents of Lakewood speak English at home.
1.3% of residents speak Spanish at home 79 64.8% Speak English very well43 35.2% Speak English less than very well3.0% of residents speak other language at home 274 97.2% Speak English very well8 2.8% Speak English less than very well
English speakers - Native, born elsewhere 66.7% of residents of Lakewood speak English at home.
18.9% of residents speak Spanish at home 83 61.9% Speak English very well51 38.1% Speak English less than very well16.9% of residents speak other language at home 43 35.8% Speak English very well77 64.2% Speak English less than very well
English speakers - Foreign-born 23.5% of residents of Lakewood speak English at home.
5.5% of residents speak Spanish at home 158 77.8% Speak English very well45 22.2% Speak English less than very well68.7% of residents speak other language at home 1,473 58.4% Speak English very well1,049 41.6% Speak English less than very well
White (Caucasian) - Speak only English Native:
97.3% (36,949)Foreign-born:
26.8% (533)
White (Caucasian) - Speak another language Native:
3.0% (1,131)Foreign-born:
73.3% (1,454)
Black or African American - Speak only English Native:
100.0% (2,270)Foreign-born:
8.0% (51)
Black or African American - Speak another language Native:
0.5% (12)Foreign-born:
100.0% (637)
American Indian / Alaska Native - Speak only English Native:
53.5% (48)Foreign-born:
100.0% (18)
Asian - Speak only English Native:
70.3% (312)Foreign-born:
21.8% (136)
Asian - Speak another language Native:
26.8% (119)Foreign-born:
78.3% (490)
Other race - Speak only English Native:
64.6% (186)Foreign-born:
45.7% (16)
Other race - Speak another language Native:
23.6% (68)Foreign-born:
64.2% (23)
Two or more races - Speak only English Native:
86.6% (2,076)Foreign-born:
43.1% (193)
Two or more races - Speak another language Native:
11.3% (272)Foreign-born:
55.2% (246)
White alone - Speak only English Native:
96.7% (36,351)Foreign-born:
26.4% (532)
White alone - Speak another language Native:
3.3% (1,235)Foreign-born:
73.6% (1,485)
Hispanic or Latino - Speak only English Native:
75.7% (1,363)Foreign-born:
30.1% (128)
Hispanic or Latino - Speak another language Native:
25.5% (459)Foreign-born:
58.3% (249)
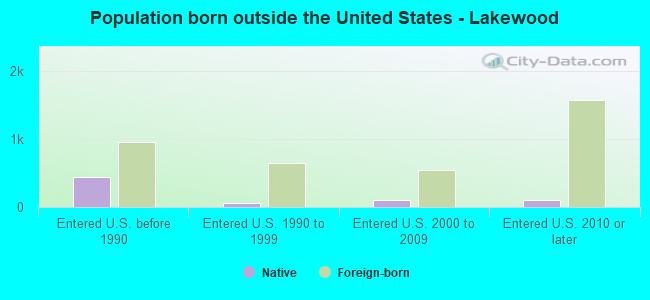
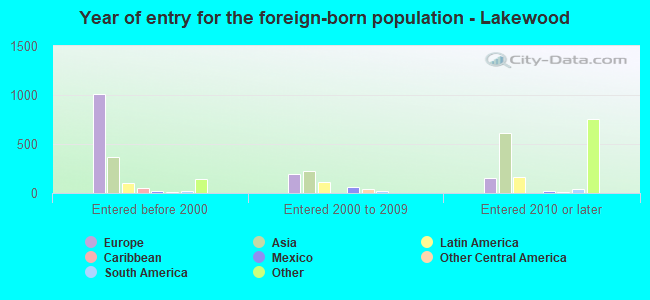
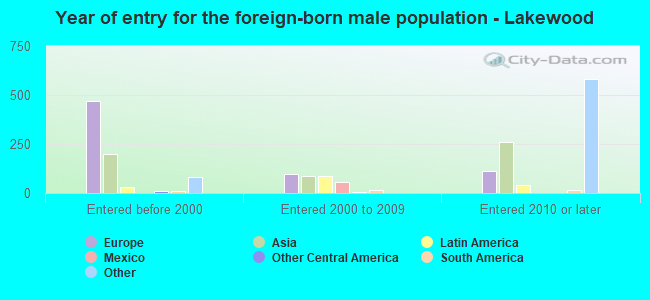
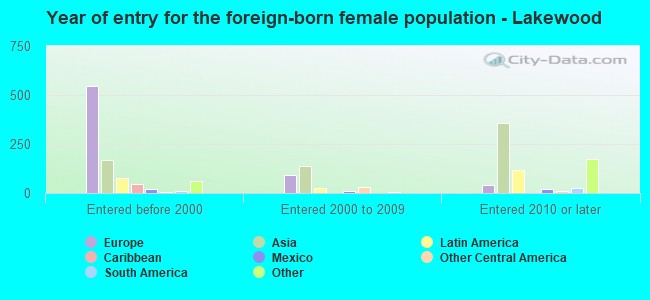
Foreign-born residents in Lakewood 3,834 residents are foreign born (2.8% Europe , 2.7% Asia , 1.2% Africa ).
Marital status for residents in Lakewood Marital status - White (Caucasian) population 15 years and over
Males 48.1% Never married38.2% Now married0.8% Separated1.7% Widowed11.3% DivorcedFemales 44.2% Never married35.0% Now married1.0% Separated7.8% Widowed12.1% DivorcedWomen who gave birth in the past 12 months Now married:
79.0% (405)Unmarried:
21.0% (108)
Women who did not give birth in the past 12 months Now married:
30.0% (3,402)Unmarried:
70.0% (7,951)
Marital status - Black or African American population 15 years and over
Males 71.7% Never married14.0% Now married1.2% Separated2.0% Widowed11.1% DivorcedFemales 62.5% Never married13.5% Now married0.0% Separated11.7% Widowed12.2% DivorcedWomen who gave birth in the past 12 months Now married:
64.9% (24)Unmarried:
35.1% (13)
Women who did not give birth in the past 12 months Now married:
16.7% (87)Unmarried:
83.3% (433)
Marital status - American Indian / Alaska Native population 15 years and over
Males 100.0% Never married0.0% Now married0.0% Separated0.0% Widowed0.0% DivorcedFemales 73.5% Never married0.0% Now married0.0% Separated0.0% Widowed26.5% DivorcedWomen who did not give birth in the past 12 months Now married:
0.0% (0)Unmarried:
100.0% (35)
Marital status - Asian population 15 years and over
Males 60.9% Never married31.4% Now married0.0% Separated1.1% Widowed6.6% DivorcedFemales 51.4% Never married37.6% Now married0.0% Separated11.0% Widowed0.0% DivorcedWomen who gave birth in the past 12 months Now married:
100.0% (4)Unmarried:
0.0% (0)
Women who did not give birth in the past 12 months Now married:
36.4% (161)Unmarried:
63.6% (281)
Marital status - Other race population 15 years and over
Males 80.0% Never married20.0% Now married0.0% Separated0.0% Widowed0.0% DivorcedFemales 43.2% Never married56.8% Now married0.0% Separated0.0% Widowed0.0% DivorcedWomen who gave birth in the past 12 months Now married:
0.0% (0)Unmarried:
100.0% (10)
Women who did not give birth in the past 12 months Now married:
60.6% (89)Unmarried:
39.4% (58)
Marital status - Two or more races population 15 years and over
Males 67.5% Never married28.4% Now married1.4% Separated0.0% Widowed2.7% DivorcedFemales 67.2% Never married15.5% Now married0.0% Separated4.5% Widowed12.8% DivorcedWomen who gave birth in the past 12 months Now married:
0.0% (0)Unmarried:
100.0% (26)
Women who did not give birth in the past 12 months Now married:
13.9% (138)Unmarried:
86.1% (856)
Marital status - White alone, not Hispanic / Latino population 15 years and over
Males 47.8% Never married38.1% Now married0.8% Separated1.7% Widowed11.5% DivorcedFemales 43.7% Never married35.2% Now married1.0% Separated8.0% Widowed12.1% DivorcedWomen who gave birth in the past 12 months Now married:
79.8% (401)Unmarried:
20.2% (101)
Women who did not give birth in the past 12 months Now married:
30.2% (3,426)Unmarried:
69.8% (7,903)
Marital status - Hispanic or Latino population 15 years and over
Males 67.1% Never married32.3% Now married0.0% Separated0.0% Widowed0.6% DivorcedFemales 56.0% Never married25.2% Now married0.0% Separated1.3% Widowed17.5% DivorcedWomen who gave birth in the past 12 months Now married:
61.5% (17)Unmarried:
38.5% (10)
Women who did not give birth in the past 12 months Now married:
25.0% (183)Unmarried:
75.0% (547)
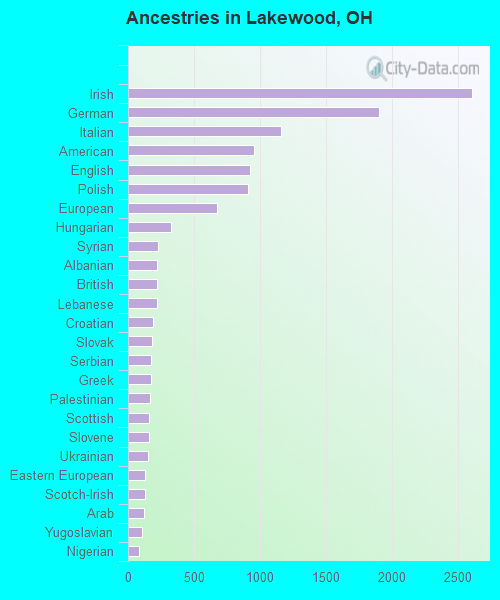
Ancestries in Lakewood
2,605 14.1% Irish1,900 10.3% German1,156 6.3% Italian956 5.2% American928 5.0% English911 4.9% Polish676 3.7% European329 1.8% Hungarian231 1.2% Syrian220 1.2% Albanian220 1.2% British217 1.2% Lebanese187 1.0% Croatian182 1.0% Slovak178 1.0% Serbian171 0.9% Greek170 0.9% Palestinian162 0.9% Scottish158 0.9% Slovene149 0.8% Ukrainian129 0.7% Eastern European127 0.7% Scotch-Irish118 0.6% Arab109 0.6% Yugoslavian82 0.4% Nigerian74 0.4% Belgian68 0.4% Dutch67 0.4% Scandinavian65 0.4% Romanian62 0.3% Moroccan55 0.3% Czech54 0.3% Jordanian53 0.3% French48 0.3% Norwegian46 0.2% Afghan42 0.2% Austrian38 0.2% Finnish38 0.2% Swedish29 0.2% Egyptian25 0.1% Iraqi24 0.1% Northern European23 0.1% Swiss20 0.1% Portuguese19 0.1% West Indian18 0.10% Russian14 0.08% African10 0.05% Latvian10 0.05% Canadian9 0.05% Czechoslovakian8 0.04% Macedonian8 0.04% Welsh7 0.04% Israeli7 0.04% Cypriot4 0.02% Slavic2 0.01% Lithuanian
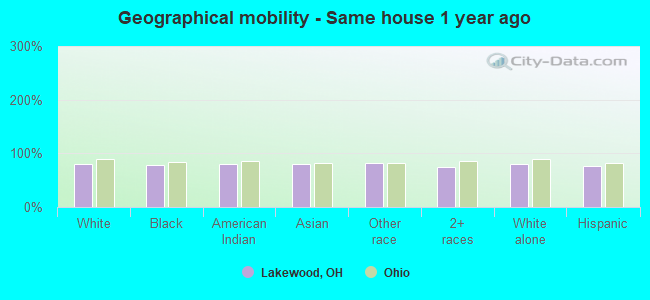
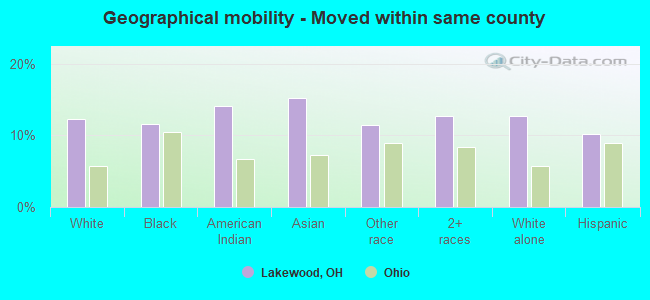
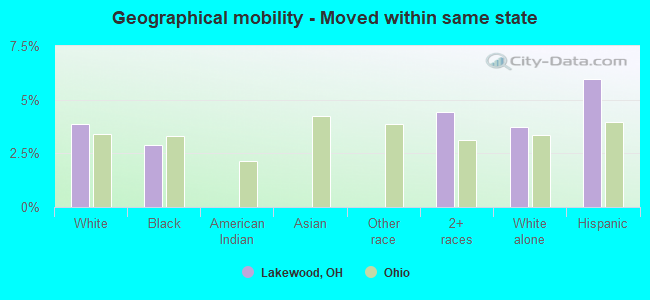
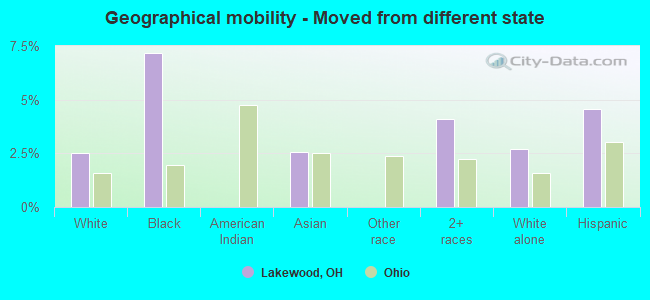
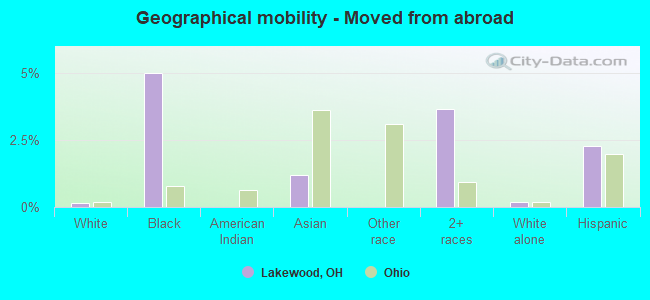
Geographical mobility in Lakewood Same house 1 year ago 33,443 81.0% White (Caucasian)2,254 77.8% Black or African American85 80.4% American Indian / Alaska Native856 79.8% Asian264 82.7% Other race2,267 75.0% Two or more races33,002 80.6% White alone, not Hispanic / Latino1,794 77.2% Hispanic or LatinoMoved within same county 5,081 12.3% White / Caucasian336 11.6% Black or African American15 14.1% American Indian / Alaska Native164 15.2% Asian36 11.4% Other race386 12.8% Two or more races5,214 12.7% White alone, not Hispanic / Latino237 10.2% Hispanic or LatinoMoved within same state 1,596 3.9% White / Caucasian83 2.9% Black or African American133 4.4% Two or more races1,530 3.7% White alone, not Hispanic / Latino139 6.0% Hispanic or LatinoMoved from different state 1,048 2.5% White / Caucasian208 7.2% Black or African American28 2.6% Asian124 4.1% Two or more races1,103 2.7% White alone, not Hispanic / Latino107 4.6% Hispanic or LatinoMoved from abroad 59 0.1% White145 5.0% Black or African American13 1.2% Asian111 3.7% Two or more races77 0.2% White alone, not Hispanic / Latino53 2.3% Hispanic or Latino
Children Nativity (place of birth) in Lakewood
Children under 6 years - Living with two parents Both parents native 1,864 100.0% NativeBoth parents foreign-born 111 79.0% Native29 21.0% Foreign-bornOne native, one foreign-born parent 101 100.0% NativeChildren under 6 years - Living with one parent Native parent 524 100.0% NativeForeign-born parent 21 100.0% NativeChildren 6 to 17 years - Living with two parents Both parents native 2,337 100.0% NativeBoth parents foreign-born 195 53.3% Native171 46.7% Foreign-bornOne native, one foreign-born parent 255 100.0% NativeChildren 6 to 17 years - Living with one parent Native parent 1,287 98.0% Native26 2.0% Foreign-bornForeign-born parent 139 63.6% Native79 36.4% Foreign-born
Grandparents responsible for own grandchildren in Lakewood
Grandparents (30 to 59 years) White / Caucasian 16 22.6% Responsible for grandchildren53 77.4% Not responsible for grandchildrenBlack or African American 18 100.0% Not responsible for grandchildrenWhite alone, not Hispanic / Latino 9 14.5% Responsible for grandchildren53 85.5% Not responsible for grandchildrenHispanic or Latino 14 100.0% Responsible for grandchildrenGrandparents (60 years and over) White / Caucasian 91 38.2% Responsible for grandchildren147 61.8% Not responsible for grandchildrenBlack or African American 19 100.0% Not responsible for grandchildrenWhite alone, not Hispanic / Latino 92 38.5% Responsible for grandchildren147 61.5% Not responsible for grandchildrenHispanic or Latino 14 100.0% Not responsible for grandchildren