Races in Lawrenceville, Ohio (OH) Detailed Stats
Ancestries, Foreign-born residents, place of birth

Recent posts about races in Lawrenceville, Ohio on our local forum with over 2,400,000 registered users:
 | Is Columbus the best city in the Midwest? (709 replies) |
| 5 Shot on July 4 - Cleveland Rocks. (93 replies) |
| Does Pittsburgh feel the need... (84 replies) |
| Day-Trip Ideas? (8 replies) |
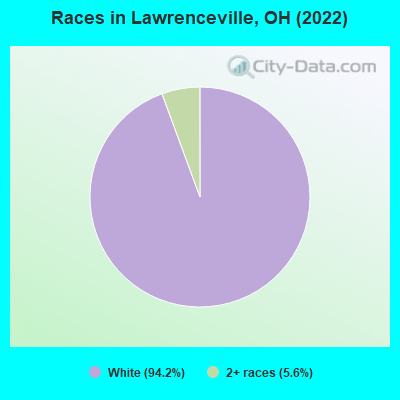
According to 2022 data, the most numerous races in Lawrenceville, OH are White alone (388 residents), Black alone (0 residents), and Two or more races (23 residents). 99.7% of Lawrenceville residents speak English at home.
Race distribution in Lawrenceville

2000
2022

- 9,538,11184.0%White alone
- 1,290,66211.4%Black alone
- 217,1231.9%Hispanic
- 137,7701.2%Two or more races
- 131,6701.2%Asian alone
- 21,9850.2%American Indian alone
- 13,4830.1%Other race alone
- 2,3360.02%Native Hawaiian and Other
Pacific Islander alone

-
- 8,948,79376.1%White alone
- 1,401,40311.9%Black alone
- 529,2914.5%Two or more races
- 517,2324.4%Hispanic
- 293,3872.5%Asian alone
- 52,8050.4%Other race alone
- 9,7850.08%American Indian alone
- 3,3620.03%Native Hawaiian and Other
Pacific Islander alone

Income and house value in Lawrenceville
- Median household income in 2022
- $36,667White non-Hispanic householders
- Median 2022 house value
- $-711,055,976White Non-Hispanic householders
- $-879,052,718Black or African American householders
Household income for White non-Hispanic householders

Median age by race in Lawrenceville
- 26.6Median age for White residents
- 26.9Males
- 26.5Females
- -721,925,133.0Median age for Black or African American residents
- -714,427,860.0Males
- -655,813,952.8Females
- -774,907,748.3Median age for American Indian / Alaska Native residents
- -685,185,184.5Males
- -658,163,264.6Females
- -527,607,361.4Median age for Asian residents
- -612,546,124.8Males
- -742,738,588.5Females
- -798,067,632.1Median age for Native Hawaiian / Pacific Islander residents
- -666,666,666.0Males
- -798,067,632.1Females
- -638,888,888.2Median age for Other race residents
- -1,487,544,482.5Males
- -493,827,160.0Females
- -698,924,730.5Median age for Two or more races residents
- -678,362,572.4Males
- -708,117,443.2Females
- 26.3Median age for White alone residents
- 26.7Males
- 26.2Females
- -617,283,950.0Median age for Hispanic or Latino residents
- -561,679,789.5Males
- -673,469,387.1Females
Owner/renter occupied households by race in Lawrenceville
- House owners and renters - White residents
- 9958.7%Owner occupied
- 6941.3%Renter occupied
- House owners and renters - White alone residents
- 9958.4%Owner occupied
- 7041.6%Renter occupied
Language usage in Lawrenceville
- English speakers - Total
- 99.7% of residents of Lawrenceville speak English at home.
All residents speak only English at home
Foreign-born residents in Lawrenceville


Marital status for residents in Lawrenceville
Marital status - White (Caucasian) population 15 years and over
- Males
- 34.7%Never married
- 50.7%Now married
- 0.0%Separated
- 6.3%Widowed
- 8.3%Divorced
- Females
- 30.1%Never married
- 41.0%Now married
- 0.0%Separated
- 18.1%Widowed
- 10.8%Divorced
Women who gave birth in the past 12 months
| Now married: | 100.0% (14) |
| Unmarried: | 0.0% (0) |
Women who did not give birth in the past 12 months
| Now married: | 31.4% (32) |
| Unmarried: | 68.6% (70) |
Marital status - White alone, not Hispanic / Latino population 15 years and over
- Males
- 34.7%Never married
- 50.7%Now married
- 0.0%Separated
- 6.2%Widowed
- 8.3%Divorced
- Females
- 30.1%Never married
- 41.0%Now married
- 0.0%Separated
- 18.1%Widowed
- 10.8%Divorced
Women who gave birth in the past 12 months
| Now married: | 100.0% (14) |
| Unmarried: | 0.0% (0) |
Women who did not give birth in the past 12 months
| Now married: | 31.4% (32) |
| Unmarried: | 68.6% (70) |
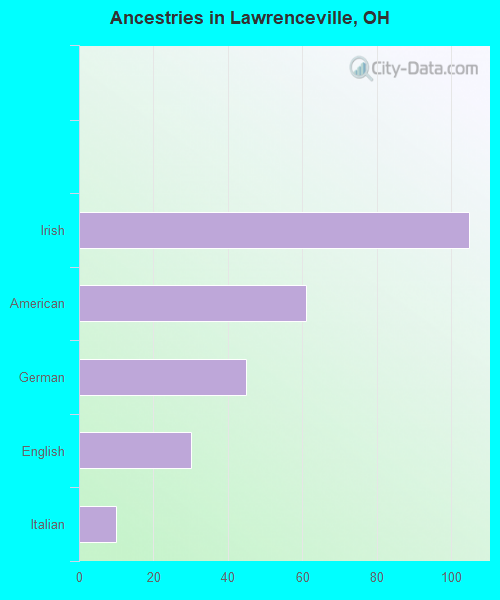
Ancestries in Lawrenceville

- 10534.6%Irish
- 6120.1%American
- 4514.8%German
- 309.9%English
- 103.3%Italian
Geographical mobility in Lawrenceville

- Same house 1 year ago
- 30381.4%White (Caucasian)
- 27100.0%Two or more races
- 30481.0%White alone, not Hispanic / Latino

-
- Moved within same county
- 349.2%White / Caucasian
- 3710.0%White alone, not Hispanic / Latino

Children Nativity (place of birth) in Lawrenceville
Grandparents responsible for own grandchildren in Lawrenceville
Zip codes: 45502.