Races in Lebanon, Indiana (IN) Detailed Stats
Data:
Races - White alone (%)
Races - White alone (% change since 2000)
Races - Black alone (%)
Races - Black alone (% change since 2000)
Races - American Indian alone (%)
Races - American Indian alone (% change since 2000)
Races - Asian alone (%)
Races - Asian alone (% change since 2000)
Races - Hispanic (%)
Races - Hispanic (% change since 2000)
Races - Native Hawaiian and Other Pacific Islander alone (%)
Races - Native Hawaiian and Other Pacific Islander alone (% change since 2000)
Races - Two or more races(%)
Races - Two or more races(% change since 2000)
Races - Other race alone (%)
Races - Other race alone (% change since 2000)
Racial diversity
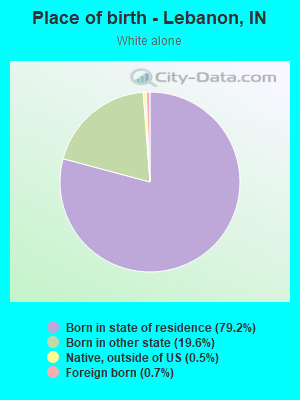
Place of birth - Born in state of residence (%)
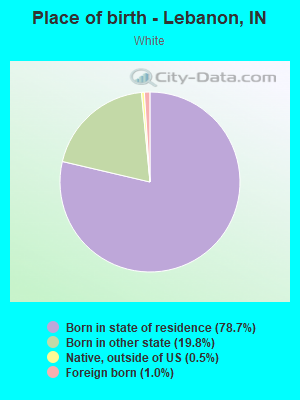
Place of birth - Born in state of residence (%) - White
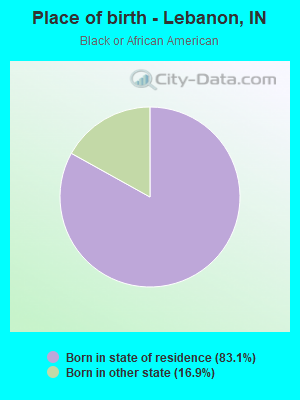
Place of birth - Born in state of residence (%) - Black or African American
Place of birth - Born in state of residence (%) - Asian
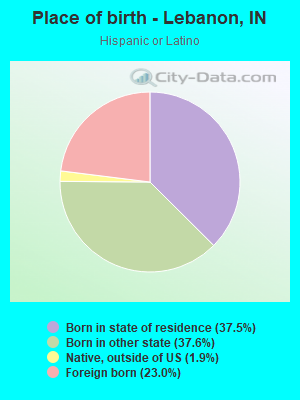
Place of birth - Born in state of residence (%) - Hispanic or Latino
Place of birth - Born in state of residence (%) - American Indian and Alaska Native
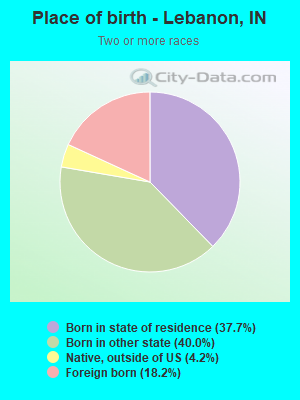
Place of birth - Born in state of residence (%) - Multirace
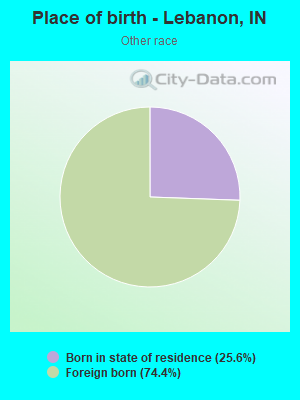
Place of birth - Born in state of residence (%) - Other Race
Place of birth - Born in other state (%)
Place of birth - Born in other state (%) - White
Place of birth - Born in other state (%) - Black or African American
Place of birth - Born in other state (%) - Asian
Place of birth - Born in other state (%) - Hispanic or Latino
Place of birth - Born in other state (%) - American Indian and Alaska Native
Place of birth - Born in other state (%) - Multirace
Place of birth - Born in other state (%) - Other Race
Place of birth - Native, outside of US (%)
Place of birth - Native, outside of US (%) - White
Place of birth - Native, outside of US (%) - Black or African American
Place of birth - Native, outside of US (%) - Asian
Place of birth - Native, outside of US (%) - Hispanic or Latino
Place of birth - Native, outside of US (%) - American Indian and Alaska Native
Place of birth - Native, outside of US (%) - Multirace
Place of birth - Native, outside of US (%) - Other Race
Place of birth - Foreign born (%)
Place of birth - Foreign born (%) - White
Place of birth - Foreign born (%) - Black or African American
Place of birth - Foreign born (%) - Asian
Place of birth - Foreign born (%) - Hispanic or Latino
Place of birth - Foreign born (%) - American Indian and Alaska Native
Place of birth - Foreign born (%) - Multirace
Place of birth - Foreign born (%) - Other Race
Residents speaking English at home (%)
Residents speaking English at home - Born in the United States (%)
Residents speaking English at home - Native, born elsewhere (%)
Residents speaking English at home - Foreign born (%)
Residents speaking Spanish at home (%)
Residents speaking Spanish at home - Born in the United States (%)
Residents speaking Spanish at home - Native, born elsewhere (%)
Residents speaking Spanish at home - Foreign born (%)
Residents speaking other language at home (%)
Residents speaking other language at home - Born in the United States (%)
Residents speaking other language at home - Native, born elsewhere (%)
Residents speaking other language at home - Foreign born (%)
Marital status - Never married (%)
Marital status - Now married (%)
Marital status - Separated (%)
Marital status - Widowed (%)
Marital status - Divorced (%)
Ancestries Reported - Arab (%)
Ancestries Reported - Czech (%)
Ancestries Reported - Danish (%)
Ancestries Reported - Dutch (%)
Ancestries Reported - English (%)
Ancestries Reported - French (%)
Ancestries Reported - French Canadian (%)
Ancestries Reported - German (%)
Ancestries Reported - Greek (%)
Ancestries Reported - Hungarian (%)
Ancestries Reported - Irish (%)
Ancestries Reported - Italian (%)
Ancestries Reported - Lithuanian (%)
Ancestries Reported - Norwegian (%)
Ancestries Reported - Polish (%)
Ancestries Reported - Portuguese (%)
Ancestries Reported - Russian (%)
Ancestries Reported - Scotch-Irish (%)
Ancestries Reported - Scottish (%)
Ancestries Reported - Slovak (%)
Ancestries Reported - Subsaharan African (%)
Ancestries Reported - Swedish (%)
Ancestries Reported - Swiss (%)
Ancestries Reported - Ukrainian (%)
Ancestries Reported - United States (%)
Ancestries Reported - Welsh (%)
Ancestries Reported - West Indian (%)
Ancestries Reported - Other (%)
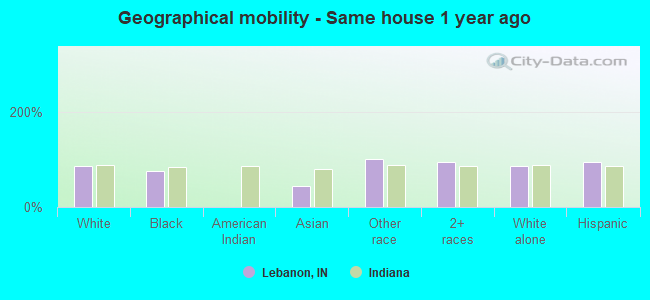
Geographical mobility - Same house 1 year ago (%)
Geographical mobility - Same house 1 year ago (%) - White
Geographical mobility - Same house 1 year ago (%) - Black or African American
Geographical mobility - Same house 1 year ago (%) - Asian
Geographical mobility - Same house 1 year ago (%) - Hispanic or Latino
Geographical mobility - Same house 1 year ago (%) - American Indian and Alaska Native
Geographical mobility - Same house 1 year ago (%) - Multirace
Geographical mobility - Same house 1 year ago (%) - Other Race
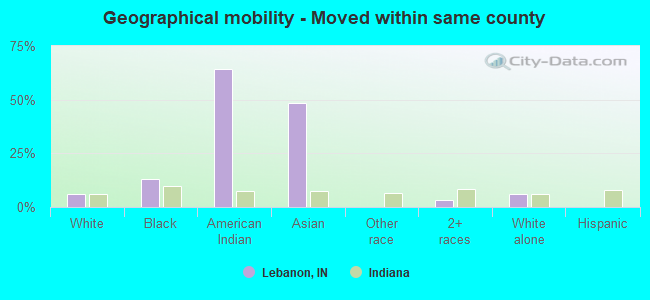
Geographical mobility - Moved within same county (%)
Geographical mobility - Moved within same county (%) - White
Geographical mobility - Moved within same county (%) - Black or African American
Geographical mobility - Moved within same county (%) - Asian
Geographical mobility - Moved within same county (%) - Hispanic or Latino
Geographical mobility - Moved within same county (%) - American Indian and Alaska Native
Geographical mobility - Moved within same county (%) - Multirace
Geographical mobility - Moved within same county (%) - Other Race
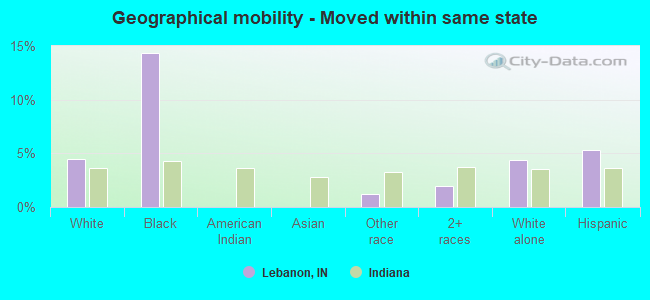
Geographical mobility - Moved from different county within same state (%)
Geographical mobility - Moved from different county within same state (%) - White
Geographical mobility - Moved from different county within same state (%) - Black or African American
Geographical mobility - Moved from different county within same state (%) - Asian
Geographical mobility - Moved from different county within same state (%) - Hispanic or Latino
Geographical mobility - Moved from different county within same state (%) - American Indian and Alaska Native
Geographical mobility - Moved from different county within same state (%) - Multirace
Geographical mobility - Moved from different county within same state (%) - Other Race
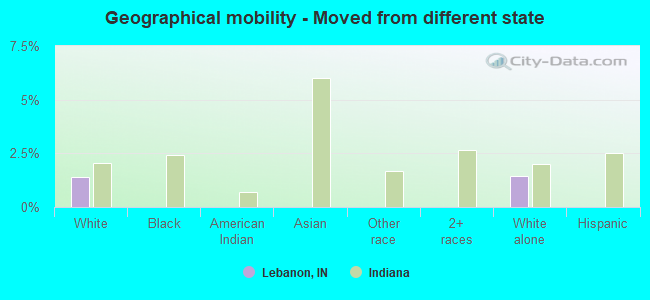
Geographical mobility - Moved from different state (%)
Geographical mobility - Moved from different state (%) - White
Geographical mobility - Moved from different state (%) - Black or African American
Geographical mobility - Moved from different state (%) - Asian
Geographical mobility - Moved from different state (%) - Hispanic or Latino
Geographical mobility - Moved from different state (%) - American Indian and Alaska Native
Geographical mobility - Moved from different state (%) - Multirace
Geographical mobility - Moved from different state (%) - Other Race
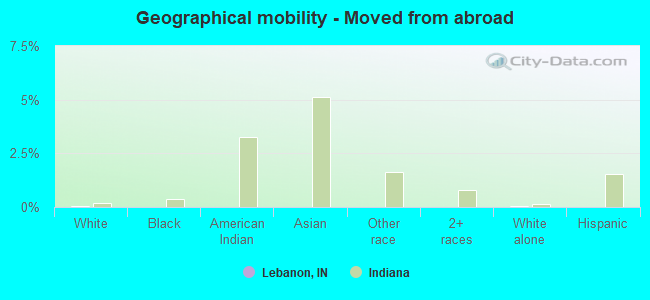
Geographical mobility - Moved from abroad (%)
Geographical mobility - Moved from abroad (%) - White
Geographical mobility - Moved from abroad (%) - Black or African American
Geographical mobility - Moved from abroad (%) - Asian
Geographical mobility - Moved from abroad (%) - Hispanic or Latino
Geographical mobility - Moved from abroad (%) - American Indian and Alaska Native
Geographical mobility - Moved from abroad (%) - Multirace
Geographical mobility - Moved from abroad (%) - Other Race
Place of birth for the foreign-born population - Ireland (%)
Place of birth for the foreign-born population - Denmark (%)
Place of birth for the foreign-born population - Norway (%)
Place of birth for the foreign-born population - Sweden (%)
Place of birth for the foreign-born population - United Kingdom (%)
Place of birth for the foreign-born population - England (%)
Place of birth for the foreign-born population - Scotland (%)
Place of birth for the foreign-born population - Other Northern Europe (%)
Place of birth for the foreign-born population - Austria (%)
Place of birth for the foreign-born population - Belgium (%)
Place of birth for the foreign-born population - France (%)
Place of birth for the foreign-born population - Germany (%)
Place of birth for the foreign-born population - Netherlands (%)
Place of birth for the foreign-born population - Switzerland (%)
Place of birth for the foreign-born population - Other Western Europe (%)
Place of birth for the foreign-born population - Greece (%)
Place of birth for the foreign-born population - Italy (%)
Place of birth for the foreign-born population - Portugal (%)
Place of birth for the foreign-born population - Spain (%)
Place of birth for the foreign-born population - Other Southern Europe (%)
Place of birth for the foreign-born population - Albania (%)
Place of birth for the foreign-born population - Belarus (%)
Place of birth for the foreign-born population - Bosnia and Herzegovina (%)
Place of birth for the foreign-born population - Bulgaria (%)
Place of birth for the foreign-born population - Croatia (%)
Place of birth for the foreign-born population - Czechoslovakia (%)
Place of birth for the foreign-born population - Hungary (%)
Place of birth for the foreign-born population - Latvia (%)
Place of birth for the foreign-born population - Lithuania (%)
Place of birth for the foreign-born population - North Macedonia (Macedonia) (%)
Place of birth for the foreign-born population - Moldova (%)
Place of birth for the foreign-born population - Poland (%)
Place of birth for the foreign-born population - Romania (%)
Place of birth for the foreign-born population - Russia (%)
Place of birth for the foreign-born population - Serbia (%)
Place of birth for the foreign-born population - Ukraine (%)
Place of birth for the foreign-born population - Other Eastern Europe (%)
Place of birth for the foreign-born population - China (%)
Place of birth for the foreign-born population - Hong Kong (%)
Place of birth for the foreign-born population - Taiwan (%)
Place of birth for the foreign-born population - Japan (%)
Place of birth for the foreign-born population - Korea (%)
Place of birth for the foreign-born population - Other Eastern Asia (%)
Place of birth for the foreign-born population - Afghanistan (%)
Place of birth for the foreign-born population - Bangladesh (%)
Place of birth for the foreign-born population - India (%)
Place of birth for the foreign-born population - Iran (%)
Place of birth for the foreign-born population - Kazakhstan (%)
Place of birth for the foreign-born population - Nepal (%)
Place of birth for the foreign-born population - Pakistan (%)
Place of birth for the foreign-born population - Sri Lanka (%)
Place of birth for the foreign-born population - Uzbekistan (%)
Place of birth for the foreign-born population - Other South Central Asia (%)
Place of birth for the foreign-born population - Burma (%)
Place of birth for the foreign-born population - Cambodia (%)
Place of birth for the foreign-born population - Indonesia (%)
Place of birth for the foreign-born population - Laos (%)
Place of birth for the foreign-born population - Malaysia (%)
Place of birth for the foreign-born population - Philippines (%)
Place of birth for the foreign-born population - Singapore (%)
Place of birth for the foreign-born population - Thailand (%)
Place of birth for the foreign-born population - Vietnam (%)
Place of birth for the foreign-born population - Other South Eastern Asia (%)
Place of birth for the foreign-born population - Armenia (%)
Place of birth for the foreign-born population - Iraq (%)
Place of birth for the foreign-born population - Israel (%)
Place of birth for the foreign-born population - Jordan (%)
Place of birth for the foreign-born population - Kuwait (%)
Place of birth for the foreign-born population - Lebanon (%)
Place of birth for the foreign-born population - Saudi Arabia (%)
Place of birth for the foreign-born population - Syria (%)
Place of birth for the foreign-born population - Turkey (%)
Place of birth for the foreign-born population - Yemen (%)
Place of birth for the foreign-born population - Other Western Asia (%)
Place of birth for the foreign-born population - Eritrea (%)
Place of birth for the foreign-born population - Ethiopia (%)
Place of birth for the foreign-born population - Kenya (%)
Place of birth for the foreign-born population - Somalia (%)
Place of birth for the foreign-born population - Uganda (%)
Place of birth for the foreign-born population - Zimbabwe (%)
Place of birth for the foreign-born population - Other Eastern Africa (%)
Place of birth for the foreign-born population - Cameroon (%)
Place of birth for the foreign-born population - Congo (%)
Place of birth for the foreign-born population - Democratic Republic of Congo (Zaire) (%)
Place of birth for the foreign-born population - Other Middle Africa (%)
Place of birth for the foreign-born population - Egypt (%)
Place of birth for the foreign-born population - Morocco (%)
Place of birth for the foreign-born population - Sudan (%)
Place of birth for the foreign-born population - Other Northern Africa (%)
Place of birth for the foreign-born population - South Africa (%)
Place of birth for the foreign-born population - Other Southern Africa (%)
Place of birth for the foreign-born population - Cabo Verde (%)
Place of birth for the foreign-born population - Ghana (%)
Place of birth for the foreign-born population - Liberia (%)
Place of birth for the foreign-born population - Nigeria (%)
Place of birth for the foreign-born population - Senegal (%)
Place of birth for the foreign-born population - Sierra Leone (%)
Place of birth for the foreign-born population - Other Western Africa (%)
Place of birth for the foreign-born population - Australia (%)
Place of birth for the foreign-born population - New Zealand (%)
Place of birth for the foreign-born population - Fiji (%)
Place of birth for the foreign-born population - Micronesia (%)
Place of birth for the foreign-born population - Bahamas (%)
Place of birth for the foreign-born population - Barbados (%)
Place of birth for the foreign-born population - Cuba (%)
Place of birth for the foreign-born population - Dominica (%)
Place of birth for the foreign-born population - Dominican Republic (%)
Place of birth for the foreign-born population - Grenada (%)
Place of birth for the foreign-born population - Haiti (%)
Place of birth for the foreign-born population - Jamaica (%)
Place of birth for the foreign-born population - St. Vincent and the Grenadines (%)
Place of birth for the foreign-born population - Trinidad and Tobago (%)
Place of birth for the foreign-born population - West Indies (%)
Place of birth for the foreign-born population - Other Caribbean (%)
Place of birth for the foreign-born population - Belize (%)
Place of birth for the foreign-born population - Costa Rica (%)
Place of birth for the foreign-born population - El Salvador (%)
Place of birth for the foreign-born population - Guatemala (%)
Place of birth for the foreign-born population - Honduras (%)
Place of birth for the foreign-born population - Mexico (%)
Place of birth for the foreign-born population - Nicaragua (%)
Place of birth for the foreign-born population - Panama (%)
Place of birth for the foreign-born population - Other Central America (%)
Place of birth for the foreign-born population - Argentina (%)
Place of birth for the foreign-born population - Bolivia (%)
Place of birth for the foreign-born population - Brazil (%)
Place of birth for the foreign-born population - Chile (%)
Place of birth for the foreign-born population - Colombia (%)
Place of birth for the foreign-born population - Ecuador (%)
Place of birth for the foreign-born population - Guyana (%)
Place of birth for the foreign-born population - Peru (%)
Place of birth for the foreign-born population - Uruguay (%)
Place of birth for the foreign-born population - Venezuela (%)
Place of birth for the foreign-born population - Other South America (%)
Place of birth for the foreign-born population - Canada (%)
Place of birth for the foreign-born population - Other Northern America (%)
Place of birth for the foreign-born population - Other (%)
Latest news about races in Lebanon, IN collected exclusively by city-data.com from local newspapers, TV, and radio stations
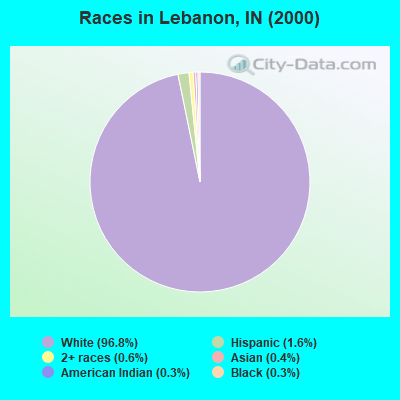
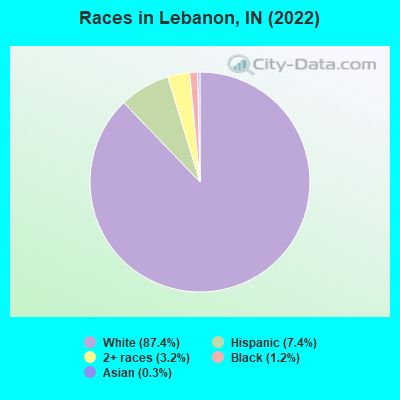
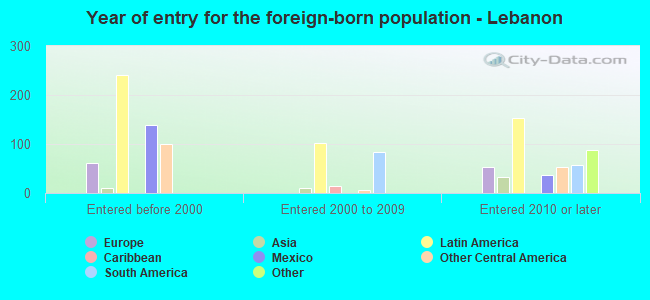
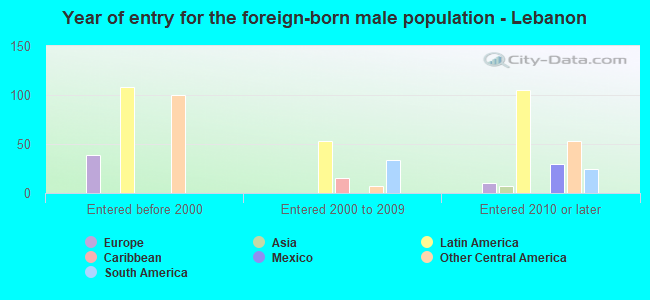
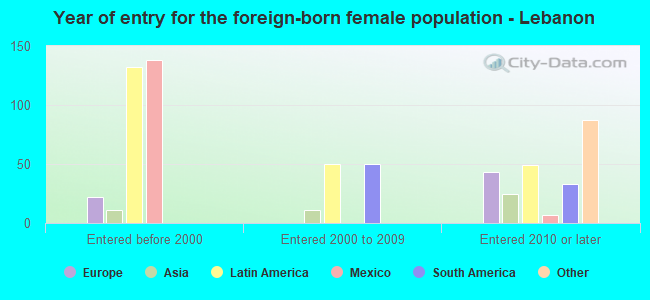
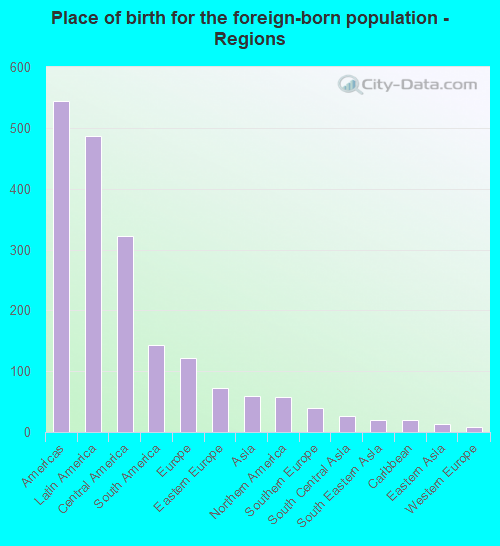
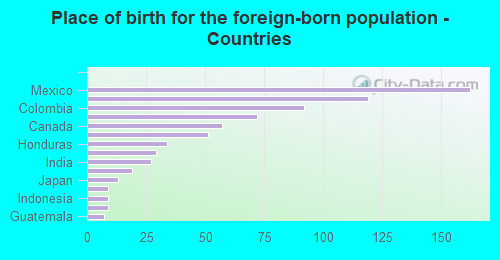
According to 2022 data, the most numerous races in Lebanon, IN are White alone (15,210 residents), Black alone (215 residents), and Hispanic (1,279 residents). 93.2% of Lebanon residents speak English at home. 4.0% of Lebanon, IN residents are foreign-born (2.6% born in Latin America, 0.6% born in Europe), which is 48.7% less than the foreign-born rate of 6.0% across the entire state of Indiana.
Race distribution in Lebanon
2000 2022
5,219,373 85.8% White alone 505,462 8.3% Black alone 214,536 3.5% Hispanic 61,115 1.0% Two or more races 58,424 1.0% Asian alone 13,654 0.2% American Indian alone 6,348 0.1% Other race alone 1,573 0.03% Native Hawaiian and Other
5,192,455 76.0% White alone 628,054 9.2% Black alone 534,528 7.8% Hispanic 263,242 3.9% Two or more races 172,880 2.5% Asian alone 33,467 0.5% Other race alone 5,866 0.09% American Indian alone 2,545 0.04% Native Hawaiian and Other
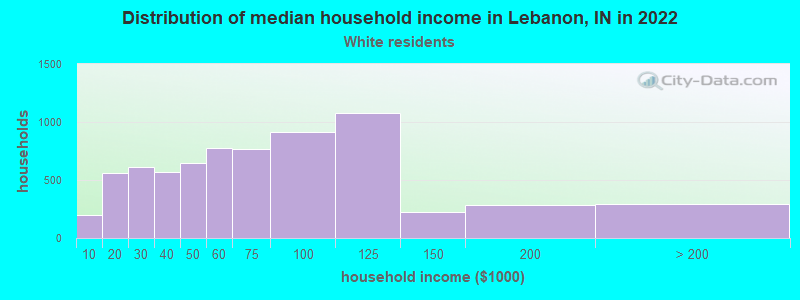
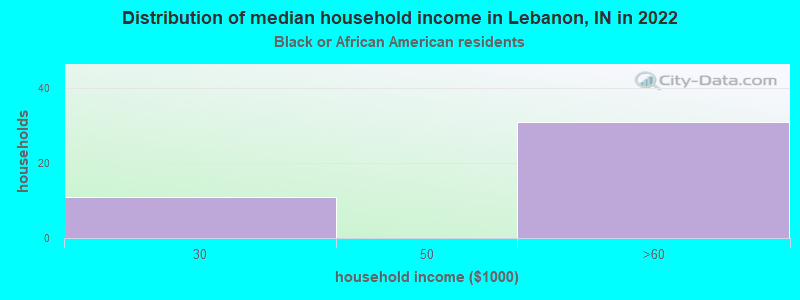
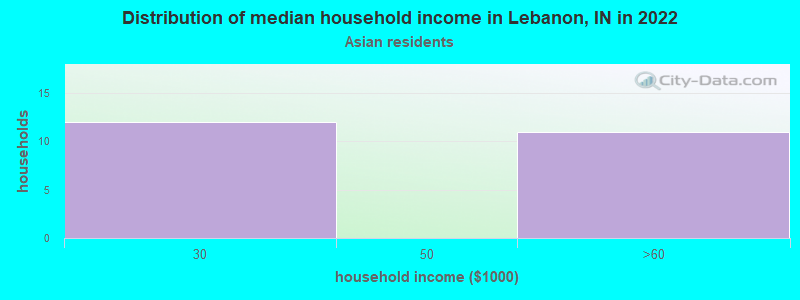
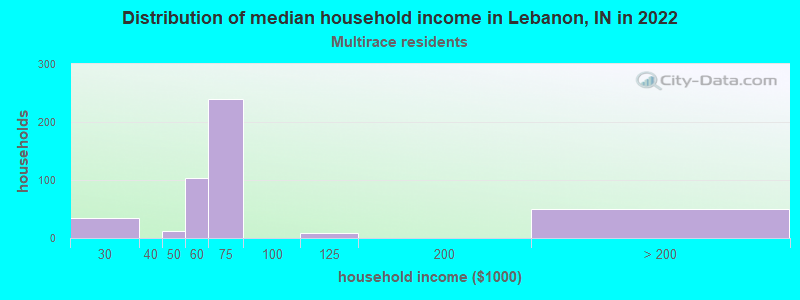
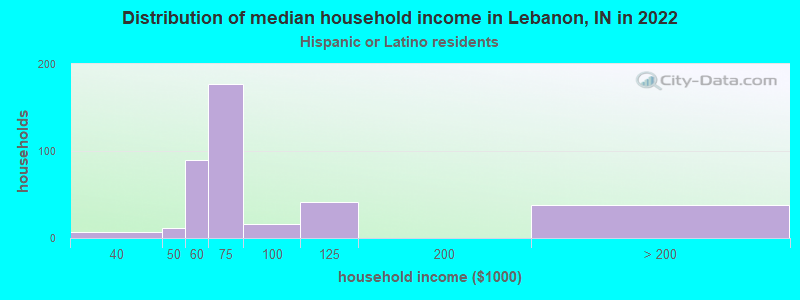
Income and house value in Lebanon Median household income in 2022 $63,277 White non-Hispanic householders$60,377 Two or more races householders$47,655 Hispanic or Latino race householdersMedian 2022 house value $195,847 White Non-Hispanic householders $349,343 Asian householders$161,235 Some other race householders$161,235 Two or more races householders$158,655 Hispanic or Latino householders
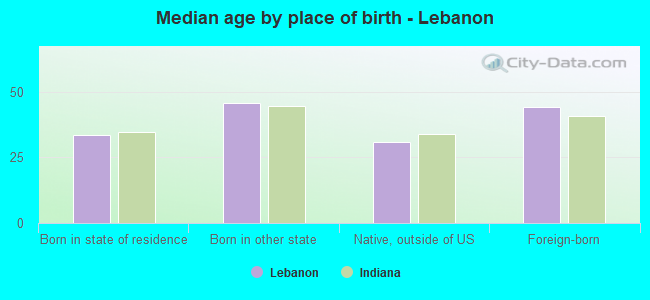
Median age by race in Lebanon
35.4 Median age for White residents33.5 37.3 42.1 Median age for Black or African American residents50.0 -471,631,205.2 -558,797,523.8 Median age for American Indian / Alaska Native residents-666,666,666.0 -491,600,353.2 54.3 Median age for Asian residents-674,012,855.2 43.0 -664,335,663.7 Median age for Native Hawaiian / Pacific Islander residents-666,666,666.0 -666,666,666.0 65.5 Median age for Other race residents65.9 -556,306,305.8 28.7 Median age for Two or more races residents29.5 45.9 35.9 Median age for White alone residents33.5 38.6 20.6 Median age for Hispanic or Latino residents21.7 24.4
Owner/renter occupied households by race in Lebanon
House owners and renters - White residents 5,018 72.7% Owner occupied1,881 27.3% Renter occupiedHouse owners and renters - Black or African American residents 46 100.0% Renter occupiedHouse owners and renters - Asian residents 18 54.3% Owner occupied15 45.7% Renter occupiedHouse owners and renters - Other race residents 22 100.0% Owner occupiedHouse owners and renters - Two or more races residents 175 33.9% Owner occupied343 66.1% Renter occupiedHouse owners and renters - White alone residents 4,901 72.2% Owner occupied1,889 27.8% Renter occupiedHouse owners and renters - Hispanic or Latino residents 143 37.7% Owner occupied236 62.3% Renter occupied
Language usage in Lebanon
English speakers - Total 93.2% of residents of Lebanon speak English at home.
4.7% of residents speak Spanish at home 565 73.1% Speak English very well208 26.9% Speak English less than very well1.7% of residents speak other language at home 140 50.5% Speak English very well137 49.5% Speak English less than very well
English speakers - Born in the United States 94.2% of residents of Lebanon speak English at home.
3.1% of residents speak Spanish at home 98 100.0% Speak English very well2.7% of residents speak other language at home 75 85.2% Speak English very well13 14.8% Speak English less than very well
All residents speak only English at home
English speakers - Foreign-born 7.7% of residents of Lebanon speak English at home.
68.7% of residents speak Spanish at home 282 58.8% Speak English very well198 41.2% Speak English less than very well20.5% of residents speak other language at home 20 14.0% Speak English very well123 86.0% Speak English less than very well
White (Caucasian) - Speak only English Native:
98.8% (14,380)Foreign-born:
13.7% (22)
White (Caucasian) - Speak another language Native:
1.3% (191)Foreign-born:
82.0% (134)
Two or more races - Speak only English Native:
70.8% (662)Foreign-born:
4.7% (24)
Two or more races - Speak another language Native:
31.3% (293)Foreign-born:
94.6% (491)
White alone - Speak only English Native:
98.5% (14,160)Foreign-born:
22.0% (25)
White alone - Speak another language Native:
1.4% (202)Foreign-born:
80.4% (91)
Hispanic or Latino - Speak only English Native:
66.4% (427)Foreign-born:
3.1% (16)
Hispanic or Latino - Speak another language Native:
32.9% (212)Foreign-born:
96.6% (499)
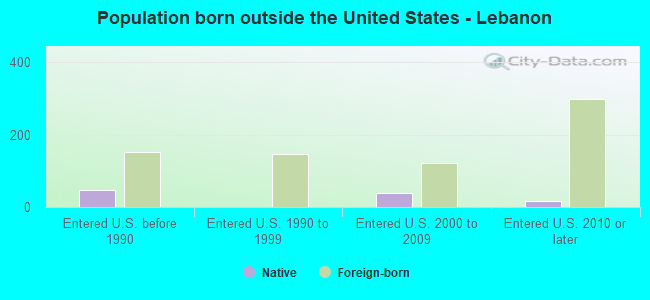
Foreign-born residents in Lebanon 726 residents are foreign born (2.6% Latin America , 0.6% Europe ).
This city:
4.0%Indiana:
5.6%
Marital status for residents in Lebanon Marital status - White (Caucasian) population 15 years and over
Males 36.6% Never married47.8% Now married1.1% Separated2.4% Widowed12.1% DivorcedFemales 26.6% Never married46.1% Now married0.6% Separated11.2% Widowed15.6% DivorcedWomen who gave birth in the past 12 months Now married:
69.8% (146)Unmarried:
30.2% (63)
Women who did not give birth in the past 12 months Now married:
40.9% (1,540)Unmarried:
59.1% (2,224)
Marital status - Black or African American population 15 years and over
Males 33.1% Never married66.9% Now married0.0% Separated0.0% Widowed0.0% DivorcedFemales 0.0% Never married71.1% Now married0.0% Separated0.0% Widowed28.9% DivorcedWomen who did not give birth in the past 12 months Now married:
100.0% (32)Unmarried:
0.0% (0)
Marital status - Asian population 15 years and over
Males 0.0% Never married100.0% Now married0.0% Separated0.0% Widowed0.0% DivorcedFemales 26.3% Never married42.1% Now married0.0% Separated31.6% Widowed0.0% DivorcedWomen who did not give birth in the past 12 months Now married:
47.4% (9)Unmarried:
52.6% (10)
Marital status - Two or more races population 15 years and over
Males 31.0% Never married66.3% Now married0.0% Separated0.0% Widowed2.6% DivorcedFemales 17.6% Never married57.0% Now married0.0% Separated15.6% Widowed9.7% DivorcedWomen who gave birth in the past 12 months Now married:
0.0% (0)Unmarried:
100.0% (52)
Women who did not give birth in the past 12 months Now married:
72.1% (243)Unmarried:
27.9% (94)
Marital status - White alone, not Hispanic / Latino population 15 years and over
Males 36.4% Never married48.3% Now married1.1% Separated2.5% Widowed11.6% DivorcedFemales 26.8% Never married45.9% Now married0.6% Separated11.4% Widowed15.3% DivorcedWomen who gave birth in the past 12 months Now married:
69.8% (144)Unmarried:
30.2% (62)
Women who did not give birth in the past 12 months Now married:
40.6% (1,464)Unmarried:
59.4% (2,143)
Marital status - Hispanic or Latino population 15 years and over
Males 18.4% Never married70.0% Now married0.0% Separated0.0% Widowed11.6% DivorcedFemales 14.6% Never married60.4% Now married0.0% Separated5.8% Widowed19.2% DivorcedWomen who gave birth in the past 12 months Now married:
0.0% (0)Unmarried:
100.0% (41)
Women who did not give birth in the past 12 months Now married:
70.1% (241)Unmarried:
29.9% (103)
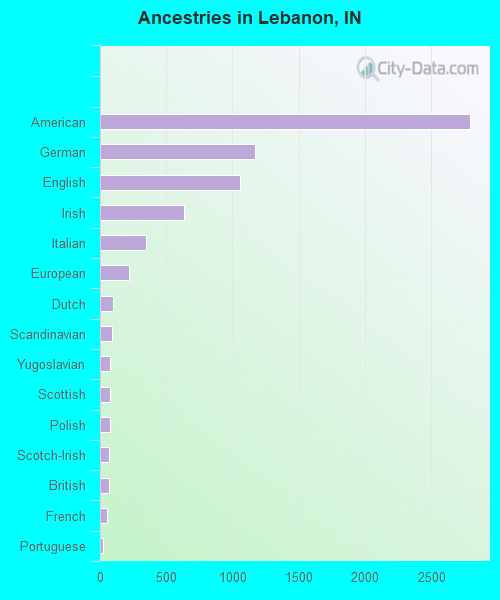
Ancestries in Lebanon
2,798 32.0% American1,169 13.4% German1,059 12.1% English638 7.3% Irish351 4.0% Italian220 2.5% European95 1.1% Dutch90 1.0% Scandinavian76 0.9% Yugoslavian75 0.9% Scottish73 0.8% Polish67 0.8% Scotch-Irish66 0.8% British56 0.6% French26 0.3% Portuguese21 0.2% Danish21 0.2% French Canadian16 0.2% Croatian15 0.2% Norwegian12 0.1% Swiss11 0.1% Greek9 0.1% Belgian7 0.08% Slovak
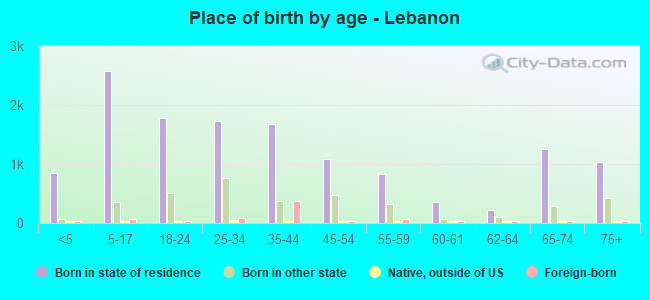
Children Nativity (place of birth) in Lebanon
Children under 6 years - Living with two parents Both parents native 617 99.5% Native3 0.5% Foreign-bornBoth parents foreign-born 86 100.0% NativeOne native, one foreign-born parent 21 100.0% Foreign-bornChildren under 6 years - Living with one parent Native parent 296 100.0% NativeChildren 6 to 17 years - Living with two parents Both parents native 1,565 100.0% NativeBoth parents foreign-born 98 58.8% Native69 41.2% Foreign-bornOne native, one foreign-born parent 22 100.0% Foreign-bornChildren 6 to 17 years - Living with one parent Native parent 969 100.0% Native
Grandparents responsible for own grandchildren in Lebanon
Grandparents (30 to 59 years) White / Caucasian 45 48.2% Responsible for grandchildren48 51.8% Not responsible for grandchildrenWhite alone, not Hispanic / Latino 46 47.5% Responsible for grandchildren51 52.5% Not responsible for grandchildrenGrandparents (60 years and over) White / Caucasian 58 42.5% Responsible for grandchildren78 57.5% Not responsible for grandchildrenWhite alone, not Hispanic / Latino 58 42.4% Responsible for grandchildren79 57.6% Not responsible for grandchildren