Races in Lyman, Maine (ME) Detailed Stats
Ancestries, Foreign-born residents, place of birth
3.4% of Lyman, ME residents are foreign-born (2.6% born in North America, 0.4% born in Europe), which is 11.1% greater than the foreign-born rate of 3.0% across the entire state of Maine.
Race distribution in Lyman

- 3,72898.2%White alone
- 250.7%Two or more races
- 120.3%Hispanic
- 110.3%Black alone
- 100.3%American Indian alone
- 90.2%Asian alone

2000
2022
-
- 1,230,29796.5%White alone
- 11,7310.9%Two or more races
- 9,3600.7%Hispanic
- 9,0140.7%Asian alone
- 6,4400.5%Black alone
- 6,9110.5%American Indian alone
- 8360.07%Other race alone
- 3340.03%Native Hawaiian and Other
Pacific Islander alone

-
- 1,249,23390.2%White alone
- 58,3574.2%Two or more races
- 28,7172.1%Hispanic
- 21,5831.6%Black alone
- 16,1511.2%Asian alone
- 5,8730.4%Other race alone
- 5,2050.4%American Indian alone
- 2210.02%Native Hawaiian and Other
Pacific Islander alone

Income and house value in Lyman
- Median household income in 2022
- $90,046White non-Hispanic householders
- over $200,000Asian householders
- Median 2022 house value
- $356,785White Non-Hispanic householders
- $359,341Asian householders
Household income for White non-Hispanic householders

Household income for Asian householders

Foreign-born residents in Lyman
128 residents are foreign born (2.6% North America, 0.4% Europe).
| This city: | 3.4% |
| Maine: | 2.9% |
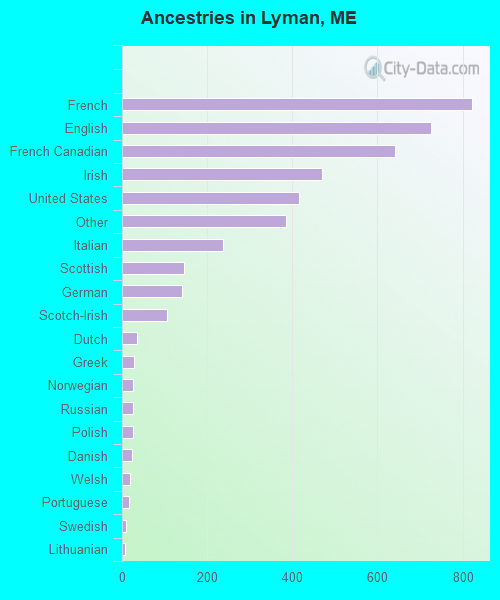
Ancestries in Lyman

- 82119.0%French
- 72616.8%English
- 64214.9%French Canadian
- 46910.9%Irish
- 4159.6%United States
- 3858.9%Other
- 2385.5%Italian
- 1453.4%Scottish
- 1423.3%German
- 1062.5%Scotch-Irish
- 360.8%Dutch
- 290.7%Greek
- 270.6%Norwegian
- 270.6%Russian
- 260.6%Polish
- 230.5%Danish
- 180.4%Welsh
- 170.4%Portuguese
- 100.2%Swedish
- 80.2%Lithuanian
- 70.2%Czech
Zip codes: 04002.