Races in Medford, Massachusetts (MA) Detailed Stats
Data:
Races - White alone (%)
Races - White alone (% change since 2000)
Races - Black alone (%)
Races - Black alone (% change since 2000)
Races - American Indian alone (%)
Races - American Indian alone (% change since 2000)
Races - Asian alone (%)
Races - Asian alone (% change since 2000)
Races - Hispanic (%)
Races - Hispanic (% change since 2000)
Races - Native Hawaiian and Other Pacific Islander alone (%)
Races - Native Hawaiian and Other Pacific Islander alone (% change since 2000)
Races - Two or more races(%)
Races - Two or more races(% change since 2000)
Races - Other race alone (%)
Races - Other race alone (% change since 2000)
Racial diversity
Place of birth - Born in state of residence (%)
Place of birth - Born in state of residence (%) - White
Place of birth - Born in state of residence (%) - Black or African American
Place of birth - Born in state of residence (%) - Asian
Place of birth - Born in state of residence (%) - Hispanic or Latino
Place of birth - Born in state of residence (%) - American Indian and Alaska Native
Place of birth - Born in state of residence (%) - Multirace
Place of birth - Born in state of residence (%) - Other Race
Place of birth - Born in other state (%)
Place of birth - Born in other state (%) - White
Place of birth - Born in other state (%) - Black or African American
Place of birth - Born in other state (%) - Asian
Place of birth - Born in other state (%) - Hispanic or Latino
Place of birth - Born in other state (%) - American Indian and Alaska Native
Place of birth - Born in other state (%) - Multirace
Place of birth - Born in other state (%) - Other Race
Place of birth - Native, outside of US (%)
Place of birth - Native, outside of US (%) - White
Place of birth - Native, outside of US (%) - Black or African American
Place of birth - Native, outside of US (%) - Asian
Place of birth - Native, outside of US (%) - Hispanic or Latino
Place of birth - Native, outside of US (%) - American Indian and Alaska Native
Place of birth - Native, outside of US (%) - Multirace
Place of birth - Native, outside of US (%) - Other Race
Place of birth - Foreign born (%)
Place of birth - Foreign born (%) - White
Place of birth - Foreign born (%) - Black or African American
Place of birth - Foreign born (%) - Asian
Place of birth - Foreign born (%) - Hispanic or Latino
Place of birth - Foreign born (%) - American Indian and Alaska Native
Place of birth - Foreign born (%) - Multirace
Place of birth - Foreign born (%) - Other Race
Residents speaking English at home (%)
Residents speaking English at home - Born in the United States (%)
Residents speaking English at home - Native, born elsewhere (%)
Residents speaking English at home - Foreign born (%)
Residents speaking Spanish at home (%)
Residents speaking Spanish at home - Born in the United States (%)
Residents speaking Spanish at home - Native, born elsewhere (%)
Residents speaking Spanish at home - Foreign born (%)
Residents speaking other language at home (%)
Residents speaking other language at home - Born in the United States (%)
Residents speaking other language at home - Native, born elsewhere (%)
Residents speaking other language at home - Foreign born (%)
Marital status - Never married (%)
Marital status - Now married (%)
Marital status - Separated (%)
Marital status - Widowed (%)
Marital status - Divorced (%)
Ancestries Reported - Arab (%)
Ancestries Reported - Czech (%)
Ancestries Reported - Danish (%)
Ancestries Reported - Dutch (%)
Ancestries Reported - English (%)
Ancestries Reported - French (%)
Ancestries Reported - French Canadian (%)
Ancestries Reported - German (%)
Ancestries Reported - Greek (%)
Ancestries Reported - Hungarian (%)
Ancestries Reported - Irish (%)
Ancestries Reported - Italian (%)
Ancestries Reported - Lithuanian (%)
Ancestries Reported - Norwegian (%)
Ancestries Reported - Polish (%)
Ancestries Reported - Portuguese (%)
Ancestries Reported - Russian (%)
Ancestries Reported - Scotch-Irish (%)
Ancestries Reported - Scottish (%)
Ancestries Reported - Slovak (%)
Ancestries Reported - Subsaharan African (%)
Ancestries Reported - Swedish (%)
Ancestries Reported - Swiss (%)
Ancestries Reported - Ukrainian (%)
Ancestries Reported - United States (%)
Ancestries Reported - Welsh (%)
Ancestries Reported - West Indian (%)
Ancestries Reported - Other (%)
Geographical mobility - Same house 1 year ago (%)
Geographical mobility - Same house 1 year ago (%) - White
Geographical mobility - Same house 1 year ago (%) - Black or African American
Geographical mobility - Same house 1 year ago (%) - Asian
Geographical mobility - Same house 1 year ago (%) - Hispanic or Latino
Geographical mobility - Same house 1 year ago (%) - American Indian and Alaska Native
Geographical mobility - Same house 1 year ago (%) - Multirace
Geographical mobility - Same house 1 year ago (%) - Other Race
Geographical mobility - Moved within same county (%)
Geographical mobility - Moved within same county (%) - White
Geographical mobility - Moved within same county (%) - Black or African American
Geographical mobility - Moved within same county (%) - Asian
Geographical mobility - Moved within same county (%) - Hispanic or Latino
Geographical mobility - Moved within same county (%) - American Indian and Alaska Native
Geographical mobility - Moved within same county (%) - Multirace
Geographical mobility - Moved within same county (%) - Other Race
Geographical mobility - Moved from different county within same state (%)
Geographical mobility - Moved from different county within same state (%) - White
Geographical mobility - Moved from different county within same state (%) - Black or African American
Geographical mobility - Moved from different county within same state (%) - Asian
Geographical mobility - Moved from different county within same state (%) - Hispanic or Latino
Geographical mobility - Moved from different county within same state (%) - American Indian and Alaska Native
Geographical mobility - Moved from different county within same state (%) - Multirace
Geographical mobility - Moved from different county within same state (%) - Other Race
Geographical mobility - Moved from different state (%)
Geographical mobility - Moved from different state (%) - White
Geographical mobility - Moved from different state (%) - Black or African American
Geographical mobility - Moved from different state (%) - Asian
Geographical mobility - Moved from different state (%) - Hispanic or Latino
Geographical mobility - Moved from different state (%) - American Indian and Alaska Native
Geographical mobility - Moved from different state (%) - Multirace
Geographical mobility - Moved from different state (%) - Other Race
Geographical mobility - Moved from abroad (%)
Geographical mobility - Moved from abroad (%) - White
Geographical mobility - Moved from abroad (%) - Black or African American
Geographical mobility - Moved from abroad (%) - Asian
Geographical mobility - Moved from abroad (%) - Hispanic or Latino
Geographical mobility - Moved from abroad (%) - American Indian and Alaska Native
Geographical mobility - Moved from abroad (%) - Multirace
Geographical mobility - Moved from abroad (%) - Other Race
Place of birth for the foreign-born population - Ireland (%)
Place of birth for the foreign-born population - Denmark (%)
Place of birth for the foreign-born population - Norway (%)
Place of birth for the foreign-born population - Sweden (%)
Place of birth for the foreign-born population - United Kingdom (%)
Place of birth for the foreign-born population - England (%)
Place of birth for the foreign-born population - Scotland (%)
Place of birth for the foreign-born population - Other Northern Europe (%)
Place of birth for the foreign-born population - Austria (%)
Place of birth for the foreign-born population - Belgium (%)
Place of birth for the foreign-born population - France (%)
Place of birth for the foreign-born population - Germany (%)
Place of birth for the foreign-born population - Netherlands (%)
Place of birth for the foreign-born population - Switzerland (%)
Place of birth for the foreign-born population - Other Western Europe (%)
Place of birth for the foreign-born population - Greece (%)
Place of birth for the foreign-born population - Italy (%)
Place of birth for the foreign-born population - Portugal (%)
Place of birth for the foreign-born population - Spain (%)
Place of birth for the foreign-born population - Other Southern Europe (%)
Place of birth for the foreign-born population - Albania (%)
Place of birth for the foreign-born population - Belarus (%)
Place of birth for the foreign-born population - Bosnia and Herzegovina (%)
Place of birth for the foreign-born population - Bulgaria (%)
Place of birth for the foreign-born population - Croatia (%)
Place of birth for the foreign-born population - Czechoslovakia (%)
Place of birth for the foreign-born population - Hungary (%)
Place of birth for the foreign-born population - Latvia (%)
Place of birth for the foreign-born population - Lithuania (%)
Place of birth for the foreign-born population - North Macedonia (Macedonia) (%)
Place of birth for the foreign-born population - Moldova (%)
Place of birth for the foreign-born population - Poland (%)
Place of birth for the foreign-born population - Romania (%)
Place of birth for the foreign-born population - Russia (%)
Place of birth for the foreign-born population - Serbia (%)
Place of birth for the foreign-born population - Ukraine (%)
Place of birth for the foreign-born population - Other Eastern Europe (%)
Place of birth for the foreign-born population - China (%)
Place of birth for the foreign-born population - Hong Kong (%)
Place of birth for the foreign-born population - Taiwan (%)
Place of birth for the foreign-born population - Japan (%)
Place of birth for the foreign-born population - Korea (%)
Place of birth for the foreign-born population - Other Eastern Asia (%)
Place of birth for the foreign-born population - Afghanistan (%)
Place of birth for the foreign-born population - Bangladesh (%)
Place of birth for the foreign-born population - India (%)
Place of birth for the foreign-born population - Iran (%)
Place of birth for the foreign-born population - Kazakhstan (%)
Place of birth for the foreign-born population - Nepal (%)
Place of birth for the foreign-born population - Pakistan (%)
Place of birth for the foreign-born population - Sri Lanka (%)
Place of birth for the foreign-born population - Uzbekistan (%)
Place of birth for the foreign-born population - Other South Central Asia (%)
Place of birth for the foreign-born population - Burma (%)
Place of birth for the foreign-born population - Cambodia (%)
Place of birth for the foreign-born population - Indonesia (%)
Place of birth for the foreign-born population - Laos (%)
Place of birth for the foreign-born population - Malaysia (%)
Place of birth for the foreign-born population - Philippines (%)
Place of birth for the foreign-born population - Singapore (%)
Place of birth for the foreign-born population - Thailand (%)
Place of birth for the foreign-born population - Vietnam (%)
Place of birth for the foreign-born population - Other South Eastern Asia (%)
Place of birth for the foreign-born population - Armenia (%)
Place of birth for the foreign-born population - Iraq (%)
Place of birth for the foreign-born population - Israel (%)
Place of birth for the foreign-born population - Jordan (%)
Place of birth for the foreign-born population - Kuwait (%)
Place of birth for the foreign-born population - Lebanon (%)
Place of birth for the foreign-born population - Saudi Arabia (%)
Place of birth for the foreign-born population - Syria (%)
Place of birth for the foreign-born population - Turkey (%)
Place of birth for the foreign-born population - Yemen (%)
Place of birth for the foreign-born population - Other Western Asia (%)
Place of birth for the foreign-born population - Eritrea (%)
Place of birth for the foreign-born population - Ethiopia (%)
Place of birth for the foreign-born population - Kenya (%)
Place of birth for the foreign-born population - Somalia (%)
Place of birth for the foreign-born population - Uganda (%)
Place of birth for the foreign-born population - Zimbabwe (%)
Place of birth for the foreign-born population - Other Eastern Africa (%)
Place of birth for the foreign-born population - Cameroon (%)
Place of birth for the foreign-born population - Congo (%)
Place of birth for the foreign-born population - Democratic Republic of Congo (Zaire) (%)
Place of birth for the foreign-born population - Other Middle Africa (%)
Place of birth for the foreign-born population - Egypt (%)
Place of birth for the foreign-born population - Morocco (%)
Place of birth for the foreign-born population - Sudan (%)
Place of birth for the foreign-born population - Other Northern Africa (%)
Place of birth for the foreign-born population - South Africa (%)
Place of birth for the foreign-born population - Other Southern Africa (%)
Place of birth for the foreign-born population - Cabo Verde (%)
Place of birth for the foreign-born population - Ghana (%)
Place of birth for the foreign-born population - Liberia (%)
Place of birth for the foreign-born population - Nigeria (%)
Place of birth for the foreign-born population - Senegal (%)
Place of birth for the foreign-born population - Sierra Leone (%)
Place of birth for the foreign-born population - Other Western Africa (%)
Place of birth for the foreign-born population - Australia (%)
Place of birth for the foreign-born population - New Zealand (%)
Place of birth for the foreign-born population - Fiji (%)
Place of birth for the foreign-born population - Micronesia (%)
Place of birth for the foreign-born population - Bahamas (%)
Place of birth for the foreign-born population - Barbados (%)
Place of birth for the foreign-born population - Cuba (%)
Place of birth for the foreign-born population - Dominica (%)
Place of birth for the foreign-born population - Dominican Republic (%)
Place of birth for the foreign-born population - Grenada (%)
Place of birth for the foreign-born population - Haiti (%)
Place of birth for the foreign-born population - Jamaica (%)
Place of birth for the foreign-born population - St. Vincent and the Grenadines (%)
Place of birth for the foreign-born population - Trinidad and Tobago (%)
Place of birth for the foreign-born population - West Indies (%)
Place of birth for the foreign-born population - Other Caribbean (%)
Place of birth for the foreign-born population - Belize (%)
Place of birth for the foreign-born population - Costa Rica (%)
Place of birth for the foreign-born population - El Salvador (%)
Place of birth for the foreign-born population - Guatemala (%)
Place of birth for the foreign-born population - Honduras (%)
Place of birth for the foreign-born population - Mexico (%)
Place of birth for the foreign-born population - Nicaragua (%)
Place of birth for the foreign-born population - Panama (%)
Place of birth for the foreign-born population - Other Central America (%)
Place of birth for the foreign-born population - Argentina (%)
Place of birth for the foreign-born population - Bolivia (%)
Place of birth for the foreign-born population - Brazil (%)
Place of birth for the foreign-born population - Chile (%)
Place of birth for the foreign-born population - Colombia (%)
Place of birth for the foreign-born population - Ecuador (%)
Place of birth for the foreign-born population - Guyana (%)
Place of birth for the foreign-born population - Peru (%)
Place of birth for the foreign-born population - Uruguay (%)
Place of birth for the foreign-born population - Venezuela (%)
Place of birth for the foreign-born population - Other South America (%)
Place of birth for the foreign-born population - Canada (%)
Place of birth for the foreign-born population - Other Northern America (%)
Place of birth for the foreign-born population - Other (%)
Latest news about races in Medford, MA collected exclusively by city-data.com from local newspapers, TV, and radio stations
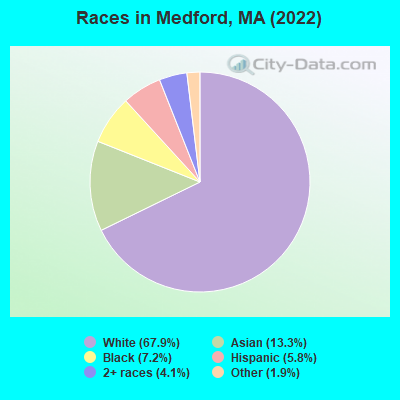
According to 2022 data, the most numerous races in Medford, MA are White alone (44,389 residents), Hispanic (3,768 residents), and Asian alone (8,672 residents). 73.0% of Medford residents speak English at home. 24.5% of Medford, MA residents are foreign-born (9.1% born in Asia, 8.1% born in Latin America, 5.3% born in Europe), which is 26.6% greater than the foreign-born rate of 18.0% across the entire state of Massachusetts.
Race distribution in Medford
2000 2022
47,403 85.0% White alone 3,324 6.0% Black alone 2,148 3.9% Asian alone 1,443 2.6% Hispanic 1,144 2.1% Two or more races 238 0.4% Other race alone 53 0.10% American Indian alone 12 0.02% Native Hawaiian and Other
44,389 67.9% White alone 8,672 13.3% Asian alone 4,682 7.2% Black alone 3,768 5.8% Hispanic 2,686 4.1% Two or more races 1,215 1.9% Other race alone
2000 2022
5,198,359 81.9% White alone 428,729 6.8% Hispanic 318,329 5.0% Black alone 236,786 3.7% Asian alone 110,338 1.7% Two or more races 43,586 0.7% Other race alone 11,264 0.2% American Indian alone 1,706 0.03% Native Hawaiian and Other
4,676,627 67.0% White alone 911,038 13.0% Hispanic 501,463 7.2% Asian alone 459,740 6.6% Black alone 341,889 4.9% Two or more races 84,403 1.2% Other race alone 5,838 0.08% American Indian alone 976 0.01% Native Hawaiian and Other
Income and house value in Medford Median household income in 2022 $110,433 White non-Hispanic householders$125,638 Black householders$165,097 Asian householders$111,806 Some other race householders$101,434 Two or more races householdersover $200,000 Hispanic or Latino race householdersMedian 2022 house value $719,852 White Non-Hispanic householders$511,630 Black or African American householders$266,148 American Indian or Alaska Native householders $628,735 Asian householders$704,509 Some other race householders$758,365 Two or more races householders$721,418 Hispanic or Latino householders
Median age by race in Medford
38.8 Median age for White residents40.1 37.5 33.9 Median age for Black or African American residents30.6 41.2 -666,666,666.0 Median age for American Indian / Alaska Native residents-666,666,666.0 -666,666,666.0 31.2 Median age for Asian residents30.5 33.0 -666,666,666.0 Median age for Native Hawaiian / Pacific Islander residents-666,666,666.0 -666,666,666.0 31.1 Median age for Other race residents31.3 30.8 28.9 Median age for Two or more races residents33.8 28.0 39.4 Median age for White alone residents40.8 37.8 30.8 Median age for Hispanic or Latino residents31.4 30.5
Owner/renter occupied households by race in Medford
House owners and renters - White residents 10,962 54.7% Owner occupied9,082 45.3% Renter occupiedHouse owners and renters - Black or African American residents 788 47.6% Owner occupied869 52.4% Renter occupiedHouse owners and renters - Asian residents 1,530 51.4% Owner occupied1,447 48.6% Renter occupiedHouse owners and renters - Native Hawaiian / Pacific Islander residents 26 100.0% Owner occupiedHouse owners and renters - Other race residents 193 17.0% Owner occupied941 83.0% Renter occupiedHouse owners and renters - Two or more races residents 651 41.4% Owner occupied920 58.6% Renter occupiedHouse owners and renters - White alone residents 10,962 55.0% Owner occupied8,964 45.0% Renter occupiedHouse owners and renters - Hispanic or Latino residents 610 48.1% Owner occupied658 51.9% Renter occupied
Language usage in Medford
English speakers - Total 73.0% of residents of Medford speak English at home.
4.3% of residents speak Spanish at home 2,073 76.8% Speak English very well625 23.2% Speak English less than very well22.7% of residents speak other language at home 9,860 70.1% Speak English very well4,210 29.9% Speak English less than very well
English speakers - Born in the United States 93.9% of residents of Medford speak English at home.
2.8% of residents speak Spanish at home 452 100.0% Speak English very well3.3% of residents speak other language at home 530 100.0% Speak English very well
English speakers - Native, born elsewhere 28.3% of residents of Medford speak English at home.
60.9% of residents speak Spanish at home 27 4.6% Speak English very well559 95.4% Speak English less than very well10.8% of residents speak other language at home 104 100.0% Speak English very well
English speakers - Foreign-born 21.2% of residents of Medford speak English at home.
6.0% of residents speak Spanish at home 870 100.0% Speak English very well72.8% of residents speak other language at home 6,372 60.5% Speak English very well4,157 39.5% Speak English less than very well
White (Caucasian) - Speak only English Native:
92.8% (35,970)Foreign-born:
23.2% (1,048)
White (Caucasian) - Speak another language Native:
7.2% (2,781)Foreign-born:
76.8% (3,478)
Black or African American - Speak only English Native:
69.0% (1,840)Foreign-born:
22.8% (373)
Black or African American - Speak another language Native:
33.2% (887)Foreign-born:
76.9% (1,256)
Asian - Speak only English Native:
61.1% (1,333)Foreign-born:
19.3% (1,160)
Asian - Speak another language Native:
38.9% (848)Foreign-born:
80.7% (4,860)
Other race - Speak only English Native:
47.1% (326)Foreign-born:
4.2% (73)
Other race - Speak another language Native:
54.0% (374)Foreign-born:
95.6% (1,656)
Two or more races - Speak only English Native:
68.8% (2,131)Foreign-born:
19.1% (189)
Two or more races - Speak another language Native:
31.2% (967)Foreign-born:
80.9% (799)
White alone - Speak only English Native:
93.1% (35,614)Foreign-born:
23.0% (1,030)
White alone - Speak another language Native:
6.9% (2,660)Foreign-born:
77.0% (3,444)
Hispanic or Latino - Speak only English Native:
52.7% (1,192)Foreign-born:
32.9% (342)
Hispanic or Latino - Speak another language Native:
47.3% (1,068)Foreign-born:
67.1% (697)
Foreign-born residents in Medford 15,083 residents are foreign born (9.1% Asia , 8.1% Latin America , 5.3% Europe ).
This city:
24.5%Massachusetts:
17.6%
Marital status for residents in Medford Marital status - White (Caucasian) population 15 years and over
Males 45.6% Never married43.3% Now married0.8% Separated4.3% Widowed5.9% DivorcedFemales 44.2% Never married36.2% Now married2.9% Separated10.4% Widowed6.4% DivorcedWomen who gave birth in the past 12 months Now married:
100.0% (482)Unmarried:
0.0% (0)
Women who did not give birth in the past 12 months Now married:
31.1% (3,677)Unmarried:
68.9% (8,158)
Marital status - Black or African American population 15 years and over
Males 58.4% Never married31.2% Now married3.6% Separated0.6% Widowed6.3% DivorcedFemales 51.4% Never married27.0% Now married3.0% Separated9.6% Widowed9.0% DivorcedWomen who gave birth in the past 12 months Now married:
65.6% (20)Unmarried:
34.4% (11)
Women who did not give birth in the past 12 months Now married:
26.9% (344)Unmarried:
73.1% (934)
Marital status - Asian population 15 years and over
Males 41.2% Never married51.3% Now married0.0% Separated0.0% Widowed7.5% DivorcedFemales 43.9% Never married50.1% Now married0.0% Separated3.6% Widowed2.5% DivorcedWomen who gave birth in the past 12 months Now married:
100.0% (238)Unmarried:
0.0% (0)
Women who did not give birth in the past 12 months Now married:
50.5% (1,398)Unmarried:
49.5% (1,371)
Marital status - Native Hawaiian / Pacific Islander population 15 years and over
Males 100.0% Never married0.0% Now married0.0% Separated0.0% Widowed0.0% DivorcedFemales 100.0% Never married0.0% Now married0.0% Separated0.0% Widowed0.0% DivorcedWomen who did not give birth in the past 12 months Now married:
0.0% (0)Unmarried:
100.0% (4)
Marital status - Other race population 15 years and over
Males 45.7% Never married49.1% Now married0.9% Separated3.0% Widowed1.4% DivorcedFemales 45.0% Never married50.1% Now married0.9% Separated4.0% Widowed0.0% DivorcedWomen who gave birth in the past 12 months Now married:
95.3% (142)Unmarried:
4.7% (7)
Women who did not give birth in the past 12 months Now married:
41.4% (328)Unmarried:
58.6% (465)
Marital status - Two or more races population 15 years and over
Males 51.6% Never married35.0% Now married0.0% Separated0.0% Widowed13.5% DivorcedFemales 62.6% Never married27.4% Now married0.3% Separated1.4% Widowed8.5% DivorcedWomen who gave birth in the past 12 months Now married:
100.0% (37)Unmarried:
0.0% (0)
Women who did not give birth in the past 12 months Now married:
17.0% (367)Unmarried:
83.0% (1,800)
Marital status - White alone, not Hispanic / Latino population 15 years and over
Males 44.8% Never married43.8% Now married0.8% Separated4.4% Widowed6.1% DivorcedFemales 44.1% Never married36.3% Now married2.9% Separated10.4% Widowed6.4% DivorcedWomen who gave birth in the past 12 months Now married:
100.0% (482)Unmarried:
0.0% (0)
Women who did not give birth in the past 12 months Now married:
31.2% (3,677)Unmarried:
68.8% (8,124)
Marital status - Hispanic or Latino population 15 years and over
Males 45.1% Never married46.0% Now married0.6% Separated0.0% Widowed8.4% DivorcedFemales 53.9% Never married34.9% Now married1.2% Separated1.0% Widowed9.0% DivorcedWomen who gave birth in the past 12 months Now married:
82.9% (30)Unmarried:
17.1% (6)
Women who did not give birth in the past 12 months Now married:
29.4% (539)Unmarried:
70.6% (1,292)
Ancestries in Medford
4,540 14.8% Irish4,296 14.0% Italian1,545 5.0% Haitian1,438 4.7% American1,246 4.1% Brazilian1,024 3.3% English588 1.9% European566 1.8% Portuguese502 1.6% Eastern European487 1.6% German330 1.1% Greek305 1.0% Scottish284 0.9% Canadian284 0.9% Polish270 0.9% Russian262 0.9% French Canadian220 0.7% French191 0.6% Romanian161 0.5% Iranian154 0.5% Albanian135 0.4% Ethiopian134 0.4% Kenyan115 0.4% Turkish100 0.3% Armenian92 0.3% Moroccan89 0.3% Bulgarian84 0.3% Jamaican63 0.2% Ukrainian53 0.2% Lebanese53 0.2% Barbadian50 0.2% Norwegian48 0.2% Yugoslavian47 0.2% Hungarian42 0.1% Welsh41 0.1% Swedish40 0.1% Northern European38 0.1% Scotch-Irish34 0.1% Dutch33 0.1% Lithuanian32 0.1% Danish27 0.09% British West Indian23 0.07% Scandinavian19 0.06% African15 0.05% Austrian14 0.05% British13 0.04% Cape Verdean11 0.04% Maltese10 0.03% Swiss9 0.03% Syrian8 0.03% Egyptian6 0.02% Palestinian6 0.02% Ghanaian6 0.02% Trinidadian and Tobagonian6 0.02% Nigerian
Geographical mobility in Medford Same house 1 year ago 39,076 87.7% White (Caucasian)4,248 90.1% Black or African American22 100.0% American Indian / Alaska Native6,172 73.4% Asian30 88.4% Native Hawaiian / Pacific Islander1,716 69.9% Other race4,884 80.4% Two or more races38,495 87.6% White alone, not Hispanic / Latino4,207 79.3% Hispanic or LatinoMoved within same county 3,241 7.3% White / Caucasian231 4.9% Black or African American976 11.6% Asian613 25.0% Other race590 9.7% Two or more races3,241 7.4% White alone, not Hispanic / Latino582 11.0% Hispanic or LatinoMoved within same state 1,028 2.3% White / Caucasian27 0.6% Black or African American524 6.2% Asian38 1.6% Other race162 2.7% Two or more races1,028 2.3% White alone, not Hispanic / Latino282 5.3% Hispanic or LatinoMoved from different state 1,004 2.3% White / Caucasian313 6.6% Black or African American269 3.2% Asian4 12.4% Native Hawaiian / Pacific Islander109 4.4% Other race206 3.4% Two or more races970 2.2% White alone, not Hispanic / Latino148 2.8% Hispanic or LatinoMoved from abroad 228 0.5% White4 0.1% Black or African American466 5.5% Asian213 3.5% Two or more races228 0.5% White alone, not Hispanic / Latino8 0.1% Hispanic or Latino
Children Nativity (place of birth) in Medford
Children under 6 years - Living with two parents Both parents native 2,413 100.0% NativeBoth parents foreign-born 463 68.8% Native210 31.2% Foreign-bornOne native, one foreign-born parent 532 100.0% NativeChildren under 6 years - Living with one parent Native parent 291 100.0% NativeForeign-born parent 266 100.0% NativeChildren 6 to 17 years - Living with two parents Both parents native 1,808 100.0% NativeBoth parents foreign-born 881 57.4% Native655 42.6% Foreign-bornOne native, one foreign-born parent 1,120 100.0% NativeChildren 6 to 17 years - Living with one parent Native parent 590 100.0% NativeForeign-born parent 170 50.0% Native170 50.0% Foreign-born
Place of birth for residents in Medford 5,809 Asia5,469 Americas5,193 Latin America3,372 Europe2,618 Eastern Asia2,339 South America2,179 China2,165 South Central Asia1,772 Southern Europe1,736 Caribbean1,117 Central America805 Eastern Europe733 South Eastern Asia428 Northern Europe403 Africa366 Western Europe291 Western Asia276 Northern America268 Eastern Africa112 Northern Africa28 Oceania28 Australia and New Zealand Subregion21 Western Africa1,993 China1,827 Brazil1,509 India1,483 Haiti899 Italy662 El Salvador526 Vietnam416 Portugal336 Korea293 Greece276 Canada265 Russia233 Iran217 Nepal208 Kenya172 Ireland165 Honduras156 Germany156 Spain146 France146 Ecuador145 Taiwan142 Bangladesh142 Colombia137 Guatemala131 Moldova129 United Kingdom126 Mexico109 England104 Philippines103 Japan101 Turkey97 United Arab Emirates87 Azores Islands79 Albania74 Bulgaria72 Indonesia71 Argentina70 Dominican Republic59 Ethiopia56 Azerbaijan56 Peru54 Ukraine54 Morocco51 Jamaica47 Bosnia and Herzegovina45 Romania44 Venezuela41 Barbados41 Trinidad and Tobago39 Hong Kong39 Poland32 Bolivia32 Lebanon28 Switzerland27 Australia25 Czechoslovakia25 Netherlands24 Singapore21 Costa Rica21 Kazakhstan20 Lithuania20 Hungary19 Pakistan18 Dominica17 Chile16 Norway16 Uzbekistan12 Cabo Verde8 Belgium5 Thailand4 Nigeria4 Israel4 Sri Lanka1 New Zealand
Grandparents responsible for own grandchildren in Medford
Grandparents (30 to 59 years) White / Caucasian 19 42.7% Responsible for grandchildren26 57.3% Not responsible for grandchildrenAsian 21 100.0% Not responsible for grandchildrenTwo or more races 19 100.0% Not responsible for grandchildrenWhite alone, not Hispanic / Latino 21 43.3% Responsible for grandchildren28 56.7% Not responsible for grandchildrenHispanic or Latino 2 100.0% Not responsible for grandchildrenGrandparents (60 years and over) White / Caucasian 58 33.4% Responsible for grandchildren116 66.6% Not responsible for grandchildrenAsian 17 11.3% Responsible for grandchildren135 88.7% Not responsible for grandchildrenWhite alone, not Hispanic / Latino 59 54.0% Responsible for grandchildren50 46.0% Not responsible for grandchildrenHispanic or Latino 57 100.0% Not responsible for grandchildren