Races in Monroe, Louisiana (LA) Detailed Stats
Data:
Races - White alone (%)
Races - White alone (% change since 2000)
Races - Black alone (%)
Races - Black alone (% change since 2000)
Races - American Indian alone (%)
Races - American Indian alone (% change since 2000)
Races - Asian alone (%)
Races - Asian alone (% change since 2000)
Races - Hispanic (%)
Races - Hispanic (% change since 2000)
Races - Native Hawaiian and Other Pacific Islander alone (%)
Races - Native Hawaiian and Other Pacific Islander alone (% change since 2000)
Races - Two or more races(%)
Races - Two or more races(% change since 2000)
Races - Other race alone (%)
Races - Other race alone (% change since 2000)
Racial diversity
Place of birth - Born in state of residence (%)
Place of birth - Born in state of residence (%) - White
Place of birth - Born in state of residence (%) - Black or African American
Place of birth - Born in state of residence (%) - Asian
Place of birth - Born in state of residence (%) - Hispanic or Latino
Place of birth - Born in state of residence (%) - American Indian and Alaska Native
Place of birth - Born in state of residence (%) - Multirace
Place of birth - Born in state of residence (%) - Other Race
Place of birth - Born in other state (%)
Place of birth - Born in other state (%) - White
Place of birth - Born in other state (%) - Black or African American
Place of birth - Born in other state (%) - Asian
Place of birth - Born in other state (%) - Hispanic or Latino
Place of birth - Born in other state (%) - American Indian and Alaska Native
Place of birth - Born in other state (%) - Multirace
Place of birth - Born in other state (%) - Other Race
Place of birth - Native, outside of US (%)
Place of birth - Native, outside of US (%) - White
Place of birth - Native, outside of US (%) - Black or African American
Place of birth - Native, outside of US (%) - Asian
Place of birth - Native, outside of US (%) - Hispanic or Latino
Place of birth - Native, outside of US (%) - American Indian and Alaska Native
Place of birth - Native, outside of US (%) - Multirace
Place of birth - Native, outside of US (%) - Other Race
Place of birth - Foreign born (%)
Place of birth - Foreign born (%) - White
Place of birth - Foreign born (%) - Black or African American
Place of birth - Foreign born (%) - Asian
Place of birth - Foreign born (%) - Hispanic or Latino
Place of birth - Foreign born (%) - American Indian and Alaska Native
Place of birth - Foreign born (%) - Multirace
Place of birth - Foreign born (%) - Other Race
Residents speaking English at home (%)
Residents speaking English at home - Born in the United States (%)
Residents speaking English at home - Native, born elsewhere (%)
Residents speaking English at home - Foreign born (%)
Residents speaking Spanish at home (%)
Residents speaking Spanish at home - Born in the United States (%)
Residents speaking Spanish at home - Native, born elsewhere (%)
Residents speaking Spanish at home - Foreign born (%)
Residents speaking other language at home (%)
Residents speaking other language at home - Born in the United States (%)
Residents speaking other language at home - Native, born elsewhere (%)
Residents speaking other language at home - Foreign born (%)
Marital status - Never married (%)
Marital status - Now married (%)
Marital status - Separated (%)
Marital status - Widowed (%)
Marital status - Divorced (%)
Ancestries Reported - Arab (%)
Ancestries Reported - Czech (%)
Ancestries Reported - Danish (%)
Ancestries Reported - Dutch (%)
Ancestries Reported - English (%)
Ancestries Reported - French (%)
Ancestries Reported - French Canadian (%)
Ancestries Reported - German (%)
Ancestries Reported - Greek (%)
Ancestries Reported - Hungarian (%)
Ancestries Reported - Irish (%)
Ancestries Reported - Italian (%)
Ancestries Reported - Lithuanian (%)
Ancestries Reported - Norwegian (%)
Ancestries Reported - Polish (%)
Ancestries Reported - Portuguese (%)
Ancestries Reported - Russian (%)
Ancestries Reported - Scotch-Irish (%)
Ancestries Reported - Scottish (%)
Ancestries Reported - Slovak (%)
Ancestries Reported - Subsaharan African (%)
Ancestries Reported - Swedish (%)
Ancestries Reported - Swiss (%)
Ancestries Reported - Ukrainian (%)
Ancestries Reported - United States (%)
Ancestries Reported - Welsh (%)
Ancestries Reported - West Indian (%)
Ancestries Reported - Other (%)
Geographical mobility - Same house 1 year ago (%)
Geographical mobility - Same house 1 year ago (%) - White
Geographical mobility - Same house 1 year ago (%) - Black or African American
Geographical mobility - Same house 1 year ago (%) - Asian
Geographical mobility - Same house 1 year ago (%) - Hispanic or Latino
Geographical mobility - Same house 1 year ago (%) - American Indian and Alaska Native
Geographical mobility - Same house 1 year ago (%) - Multirace
Geographical mobility - Same house 1 year ago (%) - Other Race
Geographical mobility - Moved within same county (%)
Geographical mobility - Moved within same county (%) - White
Geographical mobility - Moved within same county (%) - Black or African American
Geographical mobility - Moved within same county (%) - Asian
Geographical mobility - Moved within same county (%) - Hispanic or Latino
Geographical mobility - Moved within same county (%) - American Indian and Alaska Native
Geographical mobility - Moved within same county (%) - Multirace
Geographical mobility - Moved within same county (%) - Other Race
Geographical mobility - Moved from different county within same state (%)
Geographical mobility - Moved from different county within same state (%) - White
Geographical mobility - Moved from different county within same state (%) - Black or African American
Geographical mobility - Moved from different county within same state (%) - Asian
Geographical mobility - Moved from different county within same state (%) - Hispanic or Latino
Geographical mobility - Moved from different county within same state (%) - American Indian and Alaska Native
Geographical mobility - Moved from different county within same state (%) - Multirace
Geographical mobility - Moved from different county within same state (%) - Other Race
Geographical mobility - Moved from different state (%)
Geographical mobility - Moved from different state (%) - White
Geographical mobility - Moved from different state (%) - Black or African American
Geographical mobility - Moved from different state (%) - Asian
Geographical mobility - Moved from different state (%) - Hispanic or Latino
Geographical mobility - Moved from different state (%) - American Indian and Alaska Native
Geographical mobility - Moved from different state (%) - Multirace
Geographical mobility - Moved from different state (%) - Other Race
Geographical mobility - Moved from abroad (%)
Geographical mobility - Moved from abroad (%) - White
Geographical mobility - Moved from abroad (%) - Black or African American
Geographical mobility - Moved from abroad (%) - Asian
Geographical mobility - Moved from abroad (%) - Hispanic or Latino
Geographical mobility - Moved from abroad (%) - American Indian and Alaska Native
Geographical mobility - Moved from abroad (%) - Multirace
Geographical mobility - Moved from abroad (%) - Other Race
Place of birth for the foreign-born population - Ireland (%)
Place of birth for the foreign-born population - Denmark (%)
Place of birth for the foreign-born population - Norway (%)
Place of birth for the foreign-born population - Sweden (%)
Place of birth for the foreign-born population - United Kingdom (%)
Place of birth for the foreign-born population - England (%)
Place of birth for the foreign-born population - Scotland (%)
Place of birth for the foreign-born population - Other Northern Europe (%)
Place of birth for the foreign-born population - Austria (%)
Place of birth for the foreign-born population - Belgium (%)
Place of birth for the foreign-born population - France (%)
Place of birth for the foreign-born population - Germany (%)
Place of birth for the foreign-born population - Netherlands (%)
Place of birth for the foreign-born population - Switzerland (%)
Place of birth for the foreign-born population - Other Western Europe (%)
Place of birth for the foreign-born population - Greece (%)
Place of birth for the foreign-born population - Italy (%)
Place of birth for the foreign-born population - Portugal (%)
Place of birth for the foreign-born population - Spain (%)
Place of birth for the foreign-born population - Other Southern Europe (%)
Place of birth for the foreign-born population - Albania (%)
Place of birth for the foreign-born population - Belarus (%)
Place of birth for the foreign-born population - Bosnia and Herzegovina (%)
Place of birth for the foreign-born population - Bulgaria (%)
Place of birth for the foreign-born population - Croatia (%)
Place of birth for the foreign-born population - Czechoslovakia (%)
Place of birth for the foreign-born population - Hungary (%)
Place of birth for the foreign-born population - Latvia (%)
Place of birth for the foreign-born population - Lithuania (%)
Place of birth for the foreign-born population - North Macedonia (Macedonia) (%)
Place of birth for the foreign-born population - Moldova (%)
Place of birth for the foreign-born population - Poland (%)
Place of birth for the foreign-born population - Romania (%)
Place of birth for the foreign-born population - Russia (%)
Place of birth for the foreign-born population - Serbia (%)
Place of birth for the foreign-born population - Ukraine (%)
Place of birth for the foreign-born population - Other Eastern Europe (%)
Place of birth for the foreign-born population - China (%)
Place of birth for the foreign-born population - Hong Kong (%)
Place of birth for the foreign-born population - Taiwan (%)
Place of birth for the foreign-born population - Japan (%)
Place of birth for the foreign-born population - Korea (%)
Place of birth for the foreign-born population - Other Eastern Asia (%)
Place of birth for the foreign-born population - Afghanistan (%)
Place of birth for the foreign-born population - Bangladesh (%)
Place of birth for the foreign-born population - India (%)
Place of birth for the foreign-born population - Iran (%)
Place of birth for the foreign-born population - Kazakhstan (%)
Place of birth for the foreign-born population - Nepal (%)
Place of birth for the foreign-born population - Pakistan (%)
Place of birth for the foreign-born population - Sri Lanka (%)
Place of birth for the foreign-born population - Uzbekistan (%)
Place of birth for the foreign-born population - Other South Central Asia (%)
Place of birth for the foreign-born population - Burma (%)
Place of birth for the foreign-born population - Cambodia (%)
Place of birth for the foreign-born population - Indonesia (%)
Place of birth for the foreign-born population - Laos (%)
Place of birth for the foreign-born population - Malaysia (%)
Place of birth for the foreign-born population - Philippines (%)
Place of birth for the foreign-born population - Singapore (%)
Place of birth for the foreign-born population - Thailand (%)
Place of birth for the foreign-born population - Vietnam (%)
Place of birth for the foreign-born population - Other South Eastern Asia (%)
Place of birth for the foreign-born population - Armenia (%)
Place of birth for the foreign-born population - Iraq (%)
Place of birth for the foreign-born population - Israel (%)
Place of birth for the foreign-born population - Jordan (%)
Place of birth for the foreign-born population - Kuwait (%)
Place of birth for the foreign-born population - Lebanon (%)
Place of birth for the foreign-born population - Saudi Arabia (%)
Place of birth for the foreign-born population - Syria (%)
Place of birth for the foreign-born population - Turkey (%)
Place of birth for the foreign-born population - Yemen (%)
Place of birth for the foreign-born population - Other Western Asia (%)
Place of birth for the foreign-born population - Eritrea (%)
Place of birth for the foreign-born population - Ethiopia (%)
Place of birth for the foreign-born population - Kenya (%)
Place of birth for the foreign-born population - Somalia (%)
Place of birth for the foreign-born population - Uganda (%)
Place of birth for the foreign-born population - Zimbabwe (%)
Place of birth for the foreign-born population - Other Eastern Africa (%)
Place of birth for the foreign-born population - Cameroon (%)
Place of birth for the foreign-born population - Congo (%)
Place of birth for the foreign-born population - Democratic Republic of Congo (Zaire) (%)
Place of birth for the foreign-born population - Other Middle Africa (%)
Place of birth for the foreign-born population - Egypt (%)
Place of birth for the foreign-born population - Morocco (%)
Place of birth for the foreign-born population - Sudan (%)
Place of birth for the foreign-born population - Other Northern Africa (%)
Place of birth for the foreign-born population - South Africa (%)
Place of birth for the foreign-born population - Other Southern Africa (%)
Place of birth for the foreign-born population - Cabo Verde (%)
Place of birth for the foreign-born population - Ghana (%)
Place of birth for the foreign-born population - Liberia (%)
Place of birth for the foreign-born population - Nigeria (%)
Place of birth for the foreign-born population - Senegal (%)
Place of birth for the foreign-born population - Sierra Leone (%)
Place of birth for the foreign-born population - Other Western Africa (%)
Place of birth for the foreign-born population - Australia (%)
Place of birth for the foreign-born population - New Zealand (%)
Place of birth for the foreign-born population - Fiji (%)
Place of birth for the foreign-born population - Micronesia (%)
Place of birth for the foreign-born population - Bahamas (%)
Place of birth for the foreign-born population - Barbados (%)
Place of birth for the foreign-born population - Cuba (%)
Place of birth for the foreign-born population - Dominica (%)
Place of birth for the foreign-born population - Dominican Republic (%)
Place of birth for the foreign-born population - Grenada (%)
Place of birth for the foreign-born population - Haiti (%)
Place of birth for the foreign-born population - Jamaica (%)
Place of birth for the foreign-born population - St. Vincent and the Grenadines (%)
Place of birth for the foreign-born population - Trinidad and Tobago (%)
Place of birth for the foreign-born population - West Indies (%)
Place of birth for the foreign-born population - Other Caribbean (%)
Place of birth for the foreign-born population - Belize (%)
Place of birth for the foreign-born population - Costa Rica (%)
Place of birth for the foreign-born population - El Salvador (%)
Place of birth for the foreign-born population - Guatemala (%)
Place of birth for the foreign-born population - Honduras (%)
Place of birth for the foreign-born population - Mexico (%)
Place of birth for the foreign-born population - Nicaragua (%)
Place of birth for the foreign-born population - Panama (%)
Place of birth for the foreign-born population - Other Central America (%)
Place of birth for the foreign-born population - Argentina (%)
Place of birth for the foreign-born population - Bolivia (%)
Place of birth for the foreign-born population - Brazil (%)
Place of birth for the foreign-born population - Chile (%)
Place of birth for the foreign-born population - Colombia (%)
Place of birth for the foreign-born population - Ecuador (%)
Place of birth for the foreign-born population - Guyana (%)
Place of birth for the foreign-born population - Peru (%)
Place of birth for the foreign-born population - Uruguay (%)
Place of birth for the foreign-born population - Venezuela (%)
Place of birth for the foreign-born population - Other South America (%)
Place of birth for the foreign-born population - Canada (%)
Place of birth for the foreign-born population - Other Northern America (%)
Place of birth for the foreign-born population - Other (%)
Latest news about races in Monroe, LA collected exclusively by city-data.com from local newspapers, TV, and radio stations
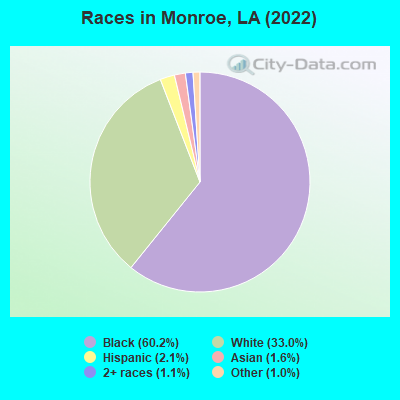
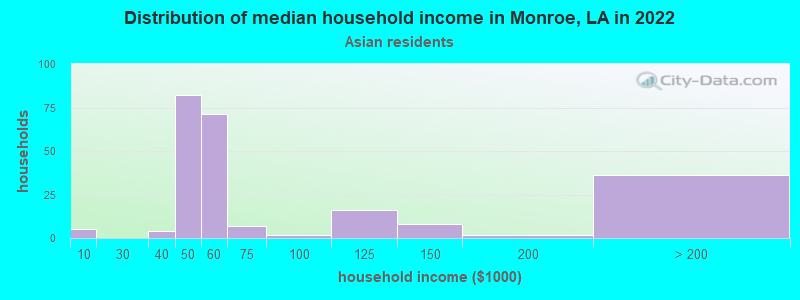
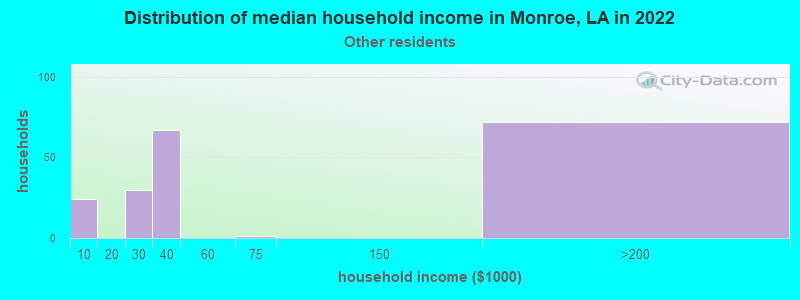
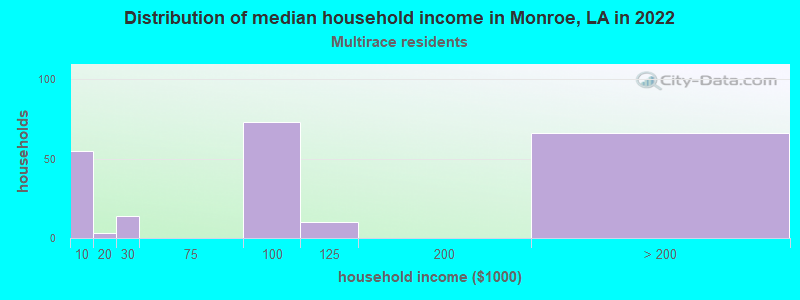
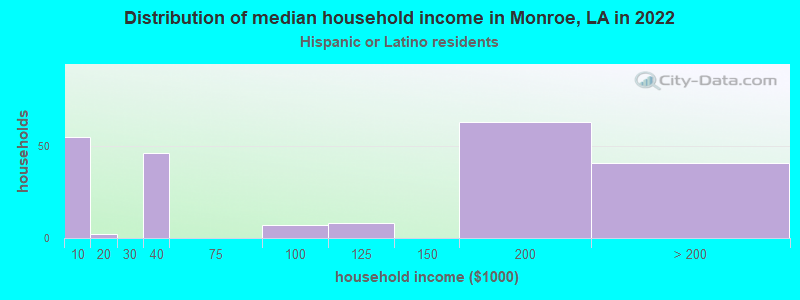
According to 2022 data, the most numerous races in Monroe, LA are White alone (15,542 residents), Black alone (28,359 residents), and Hispanic (995 residents). 95.0% of Monroe residents speak English at home. 2.1% of Monroe, LA residents are foreign-born (1.1% born in Asia, 0.3% born in Latin America, 0.3% born in Africa, 0.3% born in Europe), which is 88.8% less than the foreign-born rate of 4.0% across the entire state of Louisiana.
Race distribution in Monroe
2000 2022
2,794,391 62.5% White alone 1,443,390 32.3% Black alone 107,738 2.4% Hispanic 54,256 1.2% Asian alone 39,260 0.9% Two or more races 24,129 0.5% American Indian alone 4,736 0.1% Other race alone 1,076 0.02% Native Hawaiian and Other
2,603,221 56.7% White alone 1,420,055 30.9% Black alone 262,213 5.7% Hispanic 183,270 4.0% Two or more races 81,169 1.8% Asian alone 19,991 0.4% American Indian alone 18,043 0.4% Other race alone 2,279 0.05% Native Hawaiian and Other
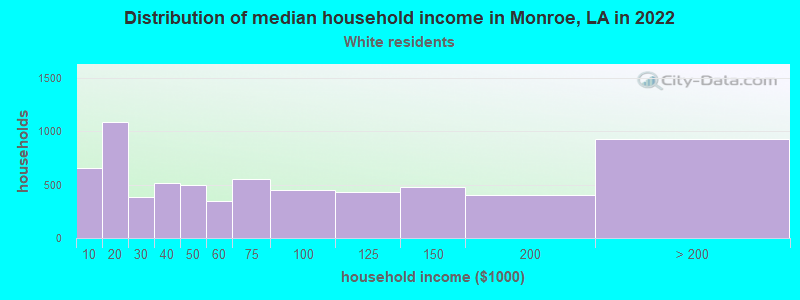
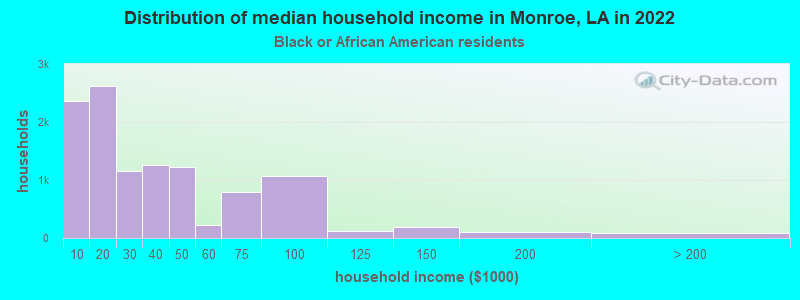
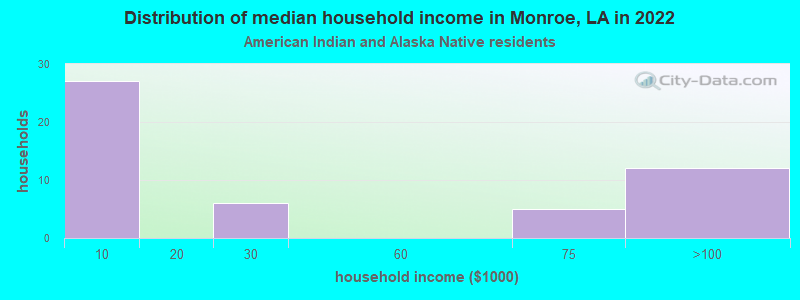
Income and house value in Monroe Median household income in 2022 $54,746 White non-Hispanic householders$26,433 Black householders$75,517 Asian householders$49,447 Some other race householdersMedian 2022 house value $248,162 White Non-Hispanic householders$98,575 Black or African American householders$258,502 American Indian or Alaska Native householders $188,649 Asian householders$67,785 Two or more races householders$103,400 Hispanic or Latino householders
Median age by race in Monroe
41.6 Median age for White residents42.2 41.8 32.3 Median age for Black or African American residents28.4 34.2 63.5 Median age for American Indian / Alaska Native residents38.4 66.0 25.6 Median age for Asian residents24.8 26.3 -821,138,210.6 Median age for Native Hawaiian / Pacific Islander residents-666,666,666.0 -666,666,666.0 25.3 Median age for Other race residents22.0 25.2 35.1 Median age for Two or more races residents46.8 28.0 41.5 Median age for White alone residents42.1 41.7 24.8 Median age for Hispanic or Latino residents23.0 37.4
Owner/renter occupied households by race in Monroe
House owners and renters - White residents 4,090 59.1% Owner occupied2,829 40.9% Renter occupiedHouse owners and renters - Black or African American residents 3,642 32.6% Owner occupied7,530 67.4% Renter occupiedHouse owners and renters - American Indian / Alaska Native residents 12 24.9% Owner occupied35 75.1% Renter occupiedHouse owners and renters - Asian residents 82 40.6% Owner occupied120 59.4% Renter occupiedHouse owners and renters - Other race residents 135 43.0% Owner occupied179 57.0% Renter occupiedHouse owners and renters - Two or more races residents 164 63.9% Owner occupied93 36.1% Renter occupiedHouse owners and renters - White alone residents 4,108 59.3% Owner occupied2,823 40.7% Renter occupiedHouse owners and renters - Hispanic or Latino residents 115 49.6% Owner occupied117 50.4% Renter occupied
Language usage in Monroe
English speakers - Total 95.0% of residents of Monroe speak English at home.
3.2% of residents speak Spanish at home 1,076 76.2% Speak English very well336 23.8% Speak English less than very well1.9% of residents speak other language at home 521 62.8% Speak English very well308 37.2% Speak English less than very well
English speakers - Born in the United States 94.1% of residents of Monroe speak English at home.
4.1% of residents speak Spanish at home 218 83.8% Speak English very well42 16.2% Speak English less than very well1.5% of residents speak other language at home 62 63.9% Speak English very well35 36.1% Speak English less than very well
English speakers - Native, born elsewhere 45.3% of residents of Monroe speak English at home.
67.9% of residents speak Spanish at home 252 100.0% Speak English very well
English speakers - Foreign-born 11.3% of residents of Monroe speak English at home.
16.1% of residents speak Spanish at home 197 100.0% Speak English less than very well51.9% of residents speak other language at home 332 52.1% Speak English very well305 47.9% Speak English less than very well
White (Caucasian) - Speak only English Native:
99.1% (14,574)Foreign-born:
42.9% (59)
White (Caucasian) - Speak another language Native:
1.3% (188)Foreign-born:
60.3% (83)
Black or African American - Speak only English Native:
98.8% (25,694)Foreign-born:
87.8% (72)
Black or African American - Speak another language Native:
1.1% (285)Foreign-born:
10.2% (8)
Asian - Speak only English Native:
52.7% (105)Foreign-born:
14.1% (68)
Asian - Speak another language Native:
46.2% (92)Foreign-born:
85.9% (415)
Other race - Speak only English Native:
46.1% (293)Foreign-born:
10.5% (29)
Other race - Speak another language Native:
51.7% (329)Foreign-born:
89.1% (246)
Two or more races - Speak another language Native:
36.6% (249)Foreign-born:
100.0% (48)
White alone - Speak only English Native:
98.9% (14,531)Foreign-born:
30.9% (58)
White alone - Speak another language Native:
1.2% (176)Foreign-born:
69.0% (130)
Hispanic or Latino - Speak only English Native:
34.4% (257)Foreign-born:
7.3% (8)
Hispanic or Latino - Speak another language Native:
59.3% (444)Foreign-born:
92.7% (99)
Foreign-born residents in Monroe 997 residents are foreign born (1.1% Asia , 0.3% Latin America , 0.3% Africa , 0.3% Europe ).
This city:
2.1%Louisiana:
4.2%
Marital status for residents in Monroe Marital status - White (Caucasian) population 15 years and over
Males 41.2% Never married45.5% Now married1.5% Separated2.6% Widowed9.2% DivorcedFemales 25.9% Never married42.1% Now married2.2% Separated15.0% Widowed14.9% DivorcedWomen who gave birth in the past 12 months Now married:
50.0% (49)Unmarried:
50.0% (49)
Women who did not give birth in the past 12 months Now married:
39.9% (1,323)Unmarried:
60.1% (1,990)
Marital status - Black or African American population 15 years and over
Males 63.3% Never married18.0% Now married4.1% Separated5.4% Widowed9.1% DivorcedFemales 58.3% Never married17.5% Now married4.1% Separated9.2% Widowed10.9% DivorcedWomen who gave birth in the past 12 months Now married:
23.2% (114)Unmarried:
76.8% (376)
Women who did not give birth in the past 12 months Now married:
18.0% (1,174)Unmarried:
82.0% (5,359)
Marital status - American Indian / Alaska Native population 15 years and over
Males 22.6% Never married48.4% Now married0.0% Separated0.0% Widowed29.0% DivorcedFemales 90.9% Never married9.1% Now married0.0% Separated0.0% Widowed0.0% DivorcedWomen who did not give birth in the past 12 months Now married:
50.0% (1)Unmarried:
50.0% (1)
Marital status - Asian population 15 years and over
Males 47.3% Never married52.7% Now married0.0% Separated0.0% Widowed0.0% DivorcedFemales 33.9% Never married54.0% Now married0.0% Separated12.1% Widowed0.0% DivorcedWomen who gave birth in the past 12 months Now married:
100.0% (4)Unmarried:
0.0% (0)
Women who did not give birth in the past 12 months Now married:
54.2% (141)Unmarried:
45.8% (119)
Marital status - Other race population 15 years and over
Males 24.7% Never married67.4% Now married0.0% Separated0.0% Widowed7.9% DivorcedFemales 39.5% Never married54.7% Now married5.8% Separated0.0% Widowed0.0% DivorcedWomen who did not give birth in the past 12 months Now married:
48.9% (146)Unmarried:
51.1% (152)
Marital status - Two or more races population 15 years and over
Males 45.1% Never married39.0% Now married15.9% Separated0.0% Widowed0.0% DivorcedFemales 67.0% Never married18.7% Now married0.0% Separated1.5% Widowed12.8% DivorcedWomen who did not give birth in the past 12 months Now married:
5.1% (10)Unmarried:
94.9% (181)
Marital status - White alone, not Hispanic / Latino population 15 years and over
Males 41.2% Never married45.4% Now married1.4% Separated2.7% Widowed9.3% DivorcedFemales 26.1% Never married42.2% Now married2.2% Separated14.6% Widowed14.9% DivorcedWomen who gave birth in the past 12 months Now married:
46.3% (43)Unmarried:
53.7% (50)
Women who did not give birth in the past 12 months Now married:
39.9% (1,342)Unmarried:
60.1% (2,017)
Marital status - Hispanic or Latino population 15 years and over
Males 27.9% Never married60.0% Now married2.3% Separated0.0% Widowed9.8% DivorcedFemales 51.1% Never married32.9% Now married5.6% Separated8.0% Widowed2.4% DivorcedWomen who gave birth in the past 12 months Now married:
100.0% (7)Unmarried:
0.0% (0)
Women who did not give birth in the past 12 months Now married:
36.6% (104)Unmarried:
63.4% (180)
Ancestries in Monroe
2,219 6.5% English1,861 5.4% American581 1.7% Irish414 1.2% Italian314 0.9% French291 0.8% European281 0.8% German273 0.8% Scottish198 0.6% Arab114 0.3% Palestinian104 0.3% Czechoslovakian88 0.3% African86 0.3% Scotch-Irish85 0.2% Danish84 0.2% Nigerian81 0.2% Polish62 0.2% Australian59 0.2% Moroccan46 0.1% Greek44 0.1% Iraqi43 0.1% Belizean38 0.1% French Canadian33 0.10% British25 0.07% Russian22 0.06% Israeli21 0.06% Swedish19 0.06% Eastern European17 0.05% Welsh14 0.04% Cajun13 0.04% Ukrainian12 0.03% Canadian12 0.03% Iranian11 0.03% Swiss9 0.03% Dutch8 0.02% Egyptian8 0.02% Yugoslavian7 0.02% Brazilian6 0.02% Albanian
Geographical mobility in Monroe Same house 1 year ago 13,859 88.6% White (Caucasian)23,381 84.4% Black or African American37 78.6% American Indian / Alaska Native581 84.5% Asian11 100.0% Native Hawaiian / Pacific Islander996 95.6% Other race670 77.3% Two or more races13,836 88.6% White alone, not Hispanic / Latino893 94.3% Hispanic or LatinoMoved within same county 1,165 7.4% White / Caucasian3,247 11.7% Black or African American8 18.0% American Indian / Alaska Native2 0.3% Asian149 17.2% Two or more races1,168 7.5% White alone, not Hispanic / Latino24 2.5% Hispanic or LatinoMoved within same state 263 1.7% White / Caucasian602 2.2% Black or African American25 3.6% Asian7 0.7% Other race9 1.0% Two or more races264 1.7% White alone, not Hispanic / Latino11 1.1% Hispanic or LatinoMoved from different state 315 2.0% White / Caucasian409 1.5% Black or African American107 15.6% Asian15 1.4% Other race34 3.9% Two or more races307 2.0% White alone, not Hispanic / Latino19 2.0% Hispanic or LatinoMoved from abroad 11 0.1% White22 0.1% Black or African American11 0.1% White alone, not Hispanic / Latino
Children Nativity (place of birth) in Monroe
Children under 6 years - Living with two parents Both parents native 1,129 100.0% NativeBoth parents foreign-born 108 74.0% Native38 26.0% Foreign-bornOne native, one foreign-born parent 74 100.0% NativeChildren under 6 years - Living with one parent Native parent 2,423 100.0% Native0 0.0% Foreign-bornForeign-born parent 14 100.0% Foreign-bornChildren 6 to 17 years - Living with two parents Both parents native 2,779 99.6% Native10 0.4% Foreign-bornBoth parents foreign-born 48 100.0% NativeOne native, one foreign-born parent 52 100.0% NativeChildren 6 to 17 years - Living with one parent Native parent 4,363 100.0% NativeForeign-born parent 43 57.2% Native32 42.8% Foreign-born
Grandparents responsible for own grandchildren in Monroe
Grandparents (30 to 59 years) White / Caucasian 5 100.0% Responsible for grandchildrenBlack or African American 201 58.9% Responsible for grandchildren140 41.1% Not responsible for grandchildrenTwo or more races 8 100.0% Responsible for grandchildrenWhite alone, not Hispanic / Latino 5 100.0% Responsible for grandchildrenGrandparents (60 years and over) White / Caucasian 39 33.3% Responsible for grandchildren79 66.7% Not responsible for grandchildrenBlack or African American 118 55.5% Responsible for grandchildren95 44.5% Not responsible for grandchildrenWhite alone, not Hispanic / Latino 40 33.2% Responsible for grandchildren81 66.8% Not responsible for grandchildren