Races in Mundelein, Illinois (IL) Detailed Stats
Data:
Races - White alone (%)
Races - White alone (% change since 2000)
Races - Black alone (%)
Races - Black alone (% change since 2000)
Races - American Indian alone (%)
Races - American Indian alone (% change since 2000)
Races - Asian alone (%)
Races - Asian alone (% change since 2000)
Races - Hispanic (%)
Races - Hispanic (% change since 2000)
Races - Native Hawaiian and Other Pacific Islander alone (%)
Races - Native Hawaiian and Other Pacific Islander alone (% change since 2000)
Races - Two or more races(%)
Races - Two or more races(% change since 2000)
Races - Other race alone (%)
Races - Other race alone (% change since 2000)
Racial diversity
Place of birth - Born in state of residence (%)
Place of birth - Born in state of residence (%) - White
Place of birth - Born in state of residence (%) - Black or African American
Place of birth - Born in state of residence (%) - Asian
Place of birth - Born in state of residence (%) - Hispanic or Latino
Place of birth - Born in state of residence (%) - American Indian and Alaska Native
Place of birth - Born in state of residence (%) - Multirace
Place of birth - Born in state of residence (%) - Other Race
Place of birth - Born in other state (%)
Place of birth - Born in other state (%) - White
Place of birth - Born in other state (%) - Black or African American
Place of birth - Born in other state (%) - Asian
Place of birth - Born in other state (%) - Hispanic or Latino
Place of birth - Born in other state (%) - American Indian and Alaska Native
Place of birth - Born in other state (%) - Multirace
Place of birth - Born in other state (%) - Other Race
Place of birth - Native, outside of US (%)
Place of birth - Native, outside of US (%) - White
Place of birth - Native, outside of US (%) - Black or African American
Place of birth - Native, outside of US (%) - Asian
Place of birth - Native, outside of US (%) - Hispanic or Latino
Place of birth - Native, outside of US (%) - American Indian and Alaska Native
Place of birth - Native, outside of US (%) - Multirace
Place of birth - Native, outside of US (%) - Other Race
Place of birth - Foreign born (%)
Place of birth - Foreign born (%) - White
Place of birth - Foreign born (%) - Black or African American
Place of birth - Foreign born (%) - Asian
Place of birth - Foreign born (%) - Hispanic or Latino
Place of birth - Foreign born (%) - American Indian and Alaska Native
Place of birth - Foreign born (%) - Multirace
Place of birth - Foreign born (%) - Other Race
Residents speaking English at home (%)
Residents speaking English at home - Born in the United States (%)
Residents speaking English at home - Native, born elsewhere (%)
Residents speaking English at home - Foreign born (%)
Residents speaking Spanish at home (%)
Residents speaking Spanish at home - Born in the United States (%)
Residents speaking Spanish at home - Native, born elsewhere (%)
Residents speaking Spanish at home - Foreign born (%)
Residents speaking other language at home (%)
Residents speaking other language at home - Born in the United States (%)
Residents speaking other language at home - Native, born elsewhere (%)
Residents speaking other language at home - Foreign born (%)
Marital status - Never married (%)
Marital status - Now married (%)
Marital status - Separated (%)
Marital status - Widowed (%)
Marital status - Divorced (%)
Ancestries Reported - Arab (%)
Ancestries Reported - Czech (%)
Ancestries Reported - Danish (%)
Ancestries Reported - Dutch (%)
Ancestries Reported - English (%)
Ancestries Reported - French (%)
Ancestries Reported - French Canadian (%)
Ancestries Reported - German (%)
Ancestries Reported - Greek (%)
Ancestries Reported - Hungarian (%)
Ancestries Reported - Irish (%)
Ancestries Reported - Italian (%)
Ancestries Reported - Lithuanian (%)
Ancestries Reported - Norwegian (%)
Ancestries Reported - Polish (%)
Ancestries Reported - Portuguese (%)
Ancestries Reported - Russian (%)
Ancestries Reported - Scotch-Irish (%)
Ancestries Reported - Scottish (%)
Ancestries Reported - Slovak (%)
Ancestries Reported - Subsaharan African (%)
Ancestries Reported - Swedish (%)
Ancestries Reported - Swiss (%)
Ancestries Reported - Ukrainian (%)
Ancestries Reported - United States (%)
Ancestries Reported - Welsh (%)
Ancestries Reported - West Indian (%)
Ancestries Reported - Other (%)
Geographical mobility - Same house 1 year ago (%)
Geographical mobility - Same house 1 year ago (%) - White
Geographical mobility - Same house 1 year ago (%) - Black or African American
Geographical mobility - Same house 1 year ago (%) - Asian
Geographical mobility - Same house 1 year ago (%) - Hispanic or Latino
Geographical mobility - Same house 1 year ago (%) - American Indian and Alaska Native
Geographical mobility - Same house 1 year ago (%) - Multirace
Geographical mobility - Same house 1 year ago (%) - Other Race
Geographical mobility - Moved within same county (%)
Geographical mobility - Moved within same county (%) - White
Geographical mobility - Moved within same county (%) - Black or African American
Geographical mobility - Moved within same county (%) - Asian
Geographical mobility - Moved within same county (%) - Hispanic or Latino
Geographical mobility - Moved within same county (%) - American Indian and Alaska Native
Geographical mobility - Moved within same county (%) - Multirace
Geographical mobility - Moved within same county (%) - Other Race
Geographical mobility - Moved from different county within same state (%)
Geographical mobility - Moved from different county within same state (%) - White
Geographical mobility - Moved from different county within same state (%) - Black or African American
Geographical mobility - Moved from different county within same state (%) - Asian
Geographical mobility - Moved from different county within same state (%) - Hispanic or Latino
Geographical mobility - Moved from different county within same state (%) - American Indian and Alaska Native
Geographical mobility - Moved from different county within same state (%) - Multirace
Geographical mobility - Moved from different county within same state (%) - Other Race
Geographical mobility - Moved from different state (%)
Geographical mobility - Moved from different state (%) - White
Geographical mobility - Moved from different state (%) - Black or African American
Geographical mobility - Moved from different state (%) - Asian
Geographical mobility - Moved from different state (%) - Hispanic or Latino
Geographical mobility - Moved from different state (%) - American Indian and Alaska Native
Geographical mobility - Moved from different state (%) - Multirace
Geographical mobility - Moved from different state (%) - Other Race
Geographical mobility - Moved from abroad (%)
Geographical mobility - Moved from abroad (%) - White
Geographical mobility - Moved from abroad (%) - Black or African American
Geographical mobility - Moved from abroad (%) - Asian
Geographical mobility - Moved from abroad (%) - Hispanic or Latino
Geographical mobility - Moved from abroad (%) - American Indian and Alaska Native
Geographical mobility - Moved from abroad (%) - Multirace
Geographical mobility - Moved from abroad (%) - Other Race
Place of birth for the foreign-born population - Ireland (%)
Place of birth for the foreign-born population - Denmark (%)
Place of birth for the foreign-born population - Norway (%)
Place of birth for the foreign-born population - Sweden (%)
Place of birth for the foreign-born population - United Kingdom (%)
Place of birth for the foreign-born population - England (%)
Place of birth for the foreign-born population - Scotland (%)
Place of birth for the foreign-born population - Other Northern Europe (%)
Place of birth for the foreign-born population - Austria (%)
Place of birth for the foreign-born population - Belgium (%)
Place of birth for the foreign-born population - France (%)
Place of birth for the foreign-born population - Germany (%)
Place of birth for the foreign-born population - Netherlands (%)
Place of birth for the foreign-born population - Switzerland (%)
Place of birth for the foreign-born population - Other Western Europe (%)
Place of birth for the foreign-born population - Greece (%)
Place of birth for the foreign-born population - Italy (%)
Place of birth for the foreign-born population - Portugal (%)
Place of birth for the foreign-born population - Spain (%)
Place of birth for the foreign-born population - Other Southern Europe (%)
Place of birth for the foreign-born population - Albania (%)
Place of birth for the foreign-born population - Belarus (%)
Place of birth for the foreign-born population - Bosnia and Herzegovina (%)
Place of birth for the foreign-born population - Bulgaria (%)
Place of birth for the foreign-born population - Croatia (%)
Place of birth for the foreign-born population - Czechoslovakia (%)
Place of birth for the foreign-born population - Hungary (%)
Place of birth for the foreign-born population - Latvia (%)
Place of birth for the foreign-born population - Lithuania (%)
Place of birth for the foreign-born population - North Macedonia (Macedonia) (%)
Place of birth for the foreign-born population - Moldova (%)
Place of birth for the foreign-born population - Poland (%)
Place of birth for the foreign-born population - Romania (%)
Place of birth for the foreign-born population - Russia (%)
Place of birth for the foreign-born population - Serbia (%)
Place of birth for the foreign-born population - Ukraine (%)
Place of birth for the foreign-born population - Other Eastern Europe (%)
Place of birth for the foreign-born population - China (%)
Place of birth for the foreign-born population - Hong Kong (%)
Place of birth for the foreign-born population - Taiwan (%)
Place of birth for the foreign-born population - Japan (%)
Place of birth for the foreign-born population - Korea (%)
Place of birth for the foreign-born population - Other Eastern Asia (%)
Place of birth for the foreign-born population - Afghanistan (%)
Place of birth for the foreign-born population - Bangladesh (%)
Place of birth for the foreign-born population - India (%)
Place of birth for the foreign-born population - Iran (%)
Place of birth for the foreign-born population - Kazakhstan (%)
Place of birth for the foreign-born population - Nepal (%)
Place of birth for the foreign-born population - Pakistan (%)
Place of birth for the foreign-born population - Sri Lanka (%)
Place of birth for the foreign-born population - Uzbekistan (%)
Place of birth for the foreign-born population - Other South Central Asia (%)
Place of birth for the foreign-born population - Burma (%)
Place of birth for the foreign-born population - Cambodia (%)
Place of birth for the foreign-born population - Indonesia (%)
Place of birth for the foreign-born population - Laos (%)
Place of birth for the foreign-born population - Malaysia (%)
Place of birth for the foreign-born population - Philippines (%)
Place of birth for the foreign-born population - Singapore (%)
Place of birth for the foreign-born population - Thailand (%)
Place of birth for the foreign-born population - Vietnam (%)
Place of birth for the foreign-born population - Other South Eastern Asia (%)
Place of birth for the foreign-born population - Armenia (%)
Place of birth for the foreign-born population - Iraq (%)
Place of birth for the foreign-born population - Israel (%)
Place of birth for the foreign-born population - Jordan (%)
Place of birth for the foreign-born population - Kuwait (%)
Place of birth for the foreign-born population - Lebanon (%)
Place of birth for the foreign-born population - Saudi Arabia (%)
Place of birth for the foreign-born population - Syria (%)
Place of birth for the foreign-born population - Turkey (%)
Place of birth for the foreign-born population - Yemen (%)
Place of birth for the foreign-born population - Other Western Asia (%)
Place of birth for the foreign-born population - Eritrea (%)
Place of birth for the foreign-born population - Ethiopia (%)
Place of birth for the foreign-born population - Kenya (%)
Place of birth for the foreign-born population - Somalia (%)
Place of birth for the foreign-born population - Uganda (%)
Place of birth for the foreign-born population - Zimbabwe (%)
Place of birth for the foreign-born population - Other Eastern Africa (%)
Place of birth for the foreign-born population - Cameroon (%)
Place of birth for the foreign-born population - Congo (%)
Place of birth for the foreign-born population - Democratic Republic of Congo (Zaire) (%)
Place of birth for the foreign-born population - Other Middle Africa (%)
Place of birth for the foreign-born population - Egypt (%)
Place of birth for the foreign-born population - Morocco (%)
Place of birth for the foreign-born population - Sudan (%)
Place of birth for the foreign-born population - Other Northern Africa (%)
Place of birth for the foreign-born population - South Africa (%)
Place of birth for the foreign-born population - Other Southern Africa (%)
Place of birth for the foreign-born population - Cabo Verde (%)
Place of birth for the foreign-born population - Ghana (%)
Place of birth for the foreign-born population - Liberia (%)
Place of birth for the foreign-born population - Nigeria (%)
Place of birth for the foreign-born population - Senegal (%)
Place of birth for the foreign-born population - Sierra Leone (%)
Place of birth for the foreign-born population - Other Western Africa (%)
Place of birth for the foreign-born population - Australia (%)
Place of birth for the foreign-born population - New Zealand (%)
Place of birth for the foreign-born population - Fiji (%)
Place of birth for the foreign-born population - Micronesia (%)
Place of birth for the foreign-born population - Bahamas (%)
Place of birth for the foreign-born population - Barbados (%)
Place of birth for the foreign-born population - Cuba (%)
Place of birth for the foreign-born population - Dominica (%)
Place of birth for the foreign-born population - Dominican Republic (%)
Place of birth for the foreign-born population - Grenada (%)
Place of birth for the foreign-born population - Haiti (%)
Place of birth for the foreign-born population - Jamaica (%)
Place of birth for the foreign-born population - St. Vincent and the Grenadines (%)
Place of birth for the foreign-born population - Trinidad and Tobago (%)
Place of birth for the foreign-born population - West Indies (%)
Place of birth for the foreign-born population - Other Caribbean (%)
Place of birth for the foreign-born population - Belize (%)
Place of birth for the foreign-born population - Costa Rica (%)
Place of birth for the foreign-born population - El Salvador (%)
Place of birth for the foreign-born population - Guatemala (%)
Place of birth for the foreign-born population - Honduras (%)
Place of birth for the foreign-born population - Mexico (%)
Place of birth for the foreign-born population - Nicaragua (%)
Place of birth for the foreign-born population - Panama (%)
Place of birth for the foreign-born population - Other Central America (%)
Place of birth for the foreign-born population - Argentina (%)
Place of birth for the foreign-born population - Bolivia (%)
Place of birth for the foreign-born population - Brazil (%)
Place of birth for the foreign-born population - Chile (%)
Place of birth for the foreign-born population - Colombia (%)
Place of birth for the foreign-born population - Ecuador (%)
Place of birth for the foreign-born population - Guyana (%)
Place of birth for the foreign-born population - Peru (%)
Place of birth for the foreign-born population - Uruguay (%)
Place of birth for the foreign-born population - Venezuela (%)
Place of birth for the foreign-born population - Other South America (%)
Place of birth for the foreign-born population - Canada (%)
Place of birth for the foreign-born population - Other Northern America (%)
Place of birth for the foreign-born population - Other (%)
Latest news about races in Mundelein, IL collected exclusively by city-data.com from local newspapers, TV, and radio stations
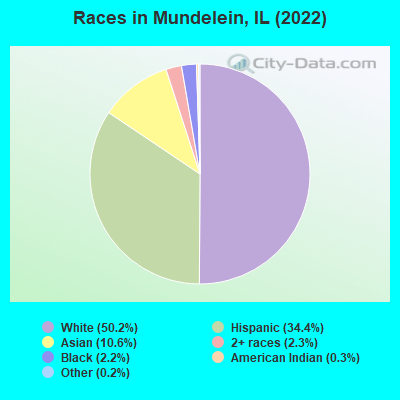
According to 2022 data, the most numerous races in Mundelein, IL are White alone (15,762 residents), Hispanic (10,819 residents), and Black alone (695 residents). 56.1% of Mundelein residents speak English at home. 27.8% of Mundelein, IL residents are foreign-born (13.7% born in Latin America, 8.7% born in Asia, 4.6% born in Europe), which is 49.6% greater than the foreign-born rate of 14.0% across the entire state of Illinois.
Race distribution in Mundelein
2000 2022
8,424,140 67.8% White alone 1,856,152 14.9% Black alone 1,530,262 12.3% Hispanic 419,916 3.4% Asian alone 153,996 1.2% Two or more races 13,479 0.1% Other race alone 18,232 0.1% American Indian alone 3,116 0.03% Native Hawaiian and Other
7,356,301 58.5% White alone 2,299,726 18.3% Hispanic 1,660,423 13.2% Black alone 747,296 5.9% Asian alone 458,599 3.6% Two or more races 45,386 0.4% Other race alone 10,405 0.08% American Indian alone 3,896 0.03% Native Hawaiian and Other
Income and house value in Mundelein Median household income in 2022 $107,406 White non-Hispanic householders$136,531 Black householders$53,244 American Indian and Alaska Native householders$101,557 Asian householders$92,464 Some other race householders$75,977 Two or more races householders$89,432 Hispanic or Latino race householdersMedian 2022 house value $290,935 White Non-Hispanic householders$338,128 Black or African American householders$279,446 American Indian or Alaska Native householders $387,089 Asian householders$255,231 Some other race householders$263,892 Two or more races householders$255,584 Hispanic or Latino householders
Median age by race in Mundelein
46.8 Median age for White residents42.8 49.1 32.9 Median age for Black or African American residents30.1 36.6 16.9 Median age for American Indian / Alaska Native residents12.8 17.8 36.5 Median age for Asian residents38.1 36.2 -593,236,714.4 Median age for Native Hawaiian / Pacific Islander residents-658,536,584.7 -576,015,108.0 37.5 Median age for Other race residents37.8 37.0 28.4 Median age for Two or more races residents39.5 16.7 49.7 Median age for White alone residents48.6 51.7 28.5 Median age for Hispanic or Latino residents35.0 24.5
Owner/renter occupied households by race in Mundelein
House owners and renters - White residents 6,505 80.7% Owner occupied1,560 19.3% Renter occupiedHouse owners and renters - Black or African American residents 66 37.5% Owner occupied110 62.5% Renter occupiedHouse owners and renters - American Indian / Alaska Native residents 97 58.4% Owner occupied69 41.6% Renter occupiedHouse owners and renters - Asian residents 624 56.5% Owner occupied481 43.5% Renter occupiedHouse owners and renters - Other race residents 570 68.5% Owner occupied262 31.5% Renter occupiedHouse owners and renters - Two or more races residents 536 37.5% Owner occupied894 62.5% Renter occupiedHouse owners and renters - White alone residents 6,204 83.1% Owner occupied1,263 16.9% Renter occupiedHouse owners and renters - Hispanic or Latino residents 1,446 53.3% Owner occupied1,268 46.7% Renter occupied
Language usage in Mundelein
English speakers - Total 56.1% of residents of Mundelein speak English at home.
27.5% of residents speak Spanish at home 4,920 60.9% Speak English very well3,157 39.1% Speak English less than very well16.9% of residents speak other language at home 3,143 63.1% Speak English very well1,839 36.9% Speak English less than very well
English speakers - Born in the United States 85.3% of residents of Mundelein speak English at home.
13.5% of residents speak Spanish at home 519 86.9% Speak English very well78 13.1% Speak English less than very well2.3% of residents speak other language at home 102 100.0% Speak English very well
English speakers - Native, born elsewhere 36.0% of residents of Mundelein speak English at home.
59.8% of residents speak Spanish at home 246 83.1% Speak English very well50 16.9% Speak English less than very well5.5% of residents speak other language at home 11 40.7% Speak English very well16 59.3% Speak English less than very well
English speakers - Foreign-born 7.9% of residents of Mundelein speak English at home.
46.4% of residents speak Spanish at home 1,532 36.6% Speak English very well2,651 63.4% Speak English less than very well44.9% of residents speak other language at home 2,309 57.1% Speak English very well1,736 42.9% Speak English less than very well
White (Caucasian) - Speak only English Native:
90.8% (13,338)Foreign-born:
16.6% (413)
White (Caucasian) - Speak another language Native:
8.2% (1,198)Foreign-born:
79.7% (1,987)
Black or African American - Speak only English Native:
91.3% (415)Foreign-born:
54.6% (81)
Black or African American - Speak another language Native:
9.2% (42)Foreign-born:
45.2% (67)
American Indian / Alaska Native - Speak another language Native:
58.2% (348)Foreign-born:
100.0% (337)
Asian - Speak only English Native:
45.0% (274)Foreign-born:
3.9% (94)
Asian - Speak another language Native:
54.1% (330)Foreign-born:
96.8% (2,335)
Other race - Speak only English Native:
28.2% (458)Foreign-born:
4.6% (67)
Other race - Speak another language Native:
71.2% (1,156)Foreign-born:
92.3% (1,360)
Two or more races - Speak only English Native:
37.7% (1,134)Foreign-born:
1.4% (32)
Two or more races - Speak another language Native:
65.0% (1,958)Foreign-born:
99.4% (2,246)
White alone - Speak only English Native:
95.3% (12,815)Foreign-born:
18.1% (339)
White alone - Speak another language Native:
4.6% (614)Foreign-born:
81.2% (1,518)
Hispanic or Latino - Speak only English Native:
32.6% (1,797)Foreign-born:
4.6% (205)
Hispanic or Latino - Speak another language Native:
67.1% (3,695)Foreign-born:
94.3% (4,169)
Foreign-born residents in Mundelein 8,717 residents are foreign born (13.7% Latin America , 8.7% Asia , 4.6% Europe ).
This city:
27.8%Illinois:
14.1%
Marital status for residents in Mundelein Marital status - White (Caucasian) population 15 years and over
Males 29.9% Never married60.3% Now married1.3% Separated1.0% Widowed7.5% DivorcedFemales 25.0% Never married56.2% Now married0.5% Separated6.4% Widowed12.0% DivorcedWomen who gave birth in the past 12 months Now married:
100.0% (198)Unmarried:
0.0% (0)
Women who did not give birth in the past 12 months Now married:
49.9% (1,857)Unmarried:
50.1% (1,865)
Marital status - Black or African American population 15 years and over
Males 46.0% Never married35.5% Now married0.0% Separated5.8% Widowed12.7% DivorcedFemales 62.5% Never married11.2% Now married0.0% Separated0.0% Widowed26.3% DivorcedWomen who gave birth in the past 12 months Now married:
0.0% (0)Unmarried:
100.0% (33)
Women who did not give birth in the past 12 months Now married:
6.4% (6)Unmarried:
93.6% (94)
Marital status - American Indian / Alaska Native population 15 years and over
Males 43.5% Never married16.1% Now married0.0% Separated0.0% Widowed40.5% DivorcedFemales 53.7% Never married15.2% Now married19.5% Separated0.0% Widowed11.6% DivorcedWomen who did not give birth in the past 12 months Now married:
37.2% (85)Unmarried:
62.8% (143)
Marital status - Asian population 15 years and over
Males 17.8% Never married74.4% Now married0.8% Separated0.0% Widowed7.0% DivorcedFemales 13.7% Never married72.2% Now married0.0% Separated10.1% Widowed4.1% DivorcedWomen who gave birth in the past 12 months Now married:
78.3% (120)Unmarried:
21.7% (33)
Women who did not give birth in the past 12 months Now married:
74.5% (528)Unmarried:
25.5% (181)
Marital status - Other race population 15 years and over
Males 38.8% Never married51.7% Now married0.0% Separated0.7% Widowed8.7% DivorcedFemales 32.9% Never married57.8% Now married0.0% Separated4.8% Widowed4.4% DivorcedWomen who gave birth in the past 12 months Now married:
0.0% (0)Unmarried:
100.0% (18)
Women who did not give birth in the past 12 months Now married:
48.9% (320)Unmarried:
51.1% (334)
Marital status - Two or more races population 15 years and over
Males 66.3% Never married30.4% Now married2.0% Separated0.0% Widowed1.3% DivorcedFemales 63.0% Never married30.6% Now married1.0% Separated1.0% Widowed4.5% DivorcedWomen who gave birth in the past 12 months Now married:
0.0% (0)Unmarried:
100.0% (56)
Women who did not give birth in the past 12 months Now married:
28.6% (337)Unmarried:
71.4% (840)
Marital status - White alone, not Hispanic / Latino population 15 years and over
Males 26.7% Never married62.5% Now married1.2% Separated1.2% Widowed8.4% DivorcedFemales 22.8% Never married57.7% Now married0.3% Separated6.8% Widowed12.4% DivorcedWomen who gave birth in the past 12 months Now married:
100.0% (125)Unmarried:
0.0% (0)
Women who did not give birth in the past 12 months Now married:
50.0% (1,555)Unmarried:
50.0% (1,557)
Marital status - Hispanic or Latino population 15 years and over
Males 50.3% Never married42.4% Now married1.4% Separated0.2% Widowed5.6% DivorcedFemales 43.2% Never married44.8% Now married1.9% Separated3.4% Widowed6.8% DivorcedWomen who gave birth in the past 12 months Now married:
68.4% (124)Unmarried:
31.6% (58)
Women who did not give birth in the past 12 months Now married:
40.5% (983)Unmarried:
59.5% (1,445)
Ancestries in Mundelein
1,197 6.9% German948 5.5% Irish858 5.0% American831 4.8% Polish563 3.3% Italian460 2.7% English367 2.1% European250 1.4% Bulgarian236 1.4% Greek170 1.0% Ukrainian152 0.9% Dutch116 0.7% Swedish99 0.6% Danish86 0.5% Russian85 0.5% Slovak82 0.5% Eastern European82 0.5% Scottish79 0.5% Scandinavian78 0.5% Scotch-Irish58 0.3% Finnish54 0.3% Armenian50 0.3% Syrian48 0.3% Jamaican41 0.2% Arab41 0.2% Lithuanian34 0.2% Turkish32 0.2% French Canadian31 0.2% Hungarian29 0.2% Croatian25 0.1% Czech23 0.1% Belizean20 0.1% Norwegian18 0.1% Slavic17 0.10% Romanian17 0.10% Nigerian16 0.09% Brazilian16 0.09% French14 0.08% Iranian14 0.08% South African13 0.08% Portuguese10 0.06% Swiss8 0.05% British7 0.04% Austrian7 0.04% Yugoslavian6 0.03% Ugandan5 0.03% Luxembourger5 0.03% Slovene
Geographical mobility in Mundelein Same house 1 year ago 16,656 91.5% White (Caucasian)706 100.0% Black or African American864 91.0% American Indian / Alaska Native2,262 69.5% Asian9 100.0% Native Hawaiian / Pacific Islander2,827 89.7% Other race4,713 83.5% Two or more races14,145 90.2% White alone, not Hispanic / Latino9,791 91.1% Hispanic or LatinoMoved within same county 538 3.0% White / Caucasian27 4.0% Black or African American473 14.5% Asian98 3.1% Other race466 8.3% Two or more races532 3.4% White alone, not Hispanic / Latino381 3.5% Hispanic or LatinoMoved within same state 439 2.4% White / Caucasian2 0.3% Black or African American395 12.1% Asian21 0.7% Other race376 6.7% Two or more races422 2.7% White alone, not Hispanic / Latino374 3.5% Hispanic or LatinoMoved from different state 425 2.3% White / Caucasian67 2.0% Asian99 3.1% Other race26 0.5% Two or more races451 2.9% White alone, not Hispanic / Latino148 1.4% Hispanic or LatinoMoved from abroad 161 0.9% White8 1.1% Black or African American82 8.6% American Indian / Alaska Native78 2.4% Asian66 2.1% Other race169 1.1% White alone, not Hispanic / Latino66 0.6% Hispanic or Latino
Children Nativity (place of birth) in Mundelein
Children under 6 years - Living with two parents Both parents native 808 100.0% NativeBoth parents foreign-born 457 96.3% Native18 3.7% Foreign-bornOne native, one foreign-born parent 333 100.0% NativeChildren under 6 years - Living with one parent Native parent 215 100.0% NativeForeign-born parent 428 82.5% Native91 17.5% Foreign-bornChildren 6 to 17 years - Living with two parents Both parents native 1,222 97.6% Native31 2.4% Foreign-bornBoth parents foreign-born 626 69.9% Native270 30.1% Foreign-bornOne native, one foreign-born parent 943 100.0% NativeChildren 6 to 17 years - Living with one parent Native parent 211 100.0% NativeForeign-born parent 997 51.8% Native927 48.2% Foreign-born
Grandparents responsible for own grandchildren in Mundelein
Grandparents (30 to 59 years) White / Caucasian 120 67.2% Responsible for grandchildren58 32.8% Not responsible for grandchildrenBlack or African American 20 100.0% Not responsible for grandchildrenAmerican Indian / Alaska Native 1 86.6% Not responsible for grandchildrenAsian 52 100.0% Not responsible for grandchildrenOther race 10 18.7% Responsible for grandchildren43 81.3% Not responsible for grandchildrenTwo or more races 71 100.0% Not responsible for grandchildrenWhite alone, not Hispanic / Latino 35 63.2% Responsible for grandchildren20 36.8% Not responsible for grandchildrenHispanic or Latino 78 34.6% Responsible for grandchildren147 65.4% Not responsible for grandchildrenGrandparents (60 years and over) White / Caucasian 15 20.2% Responsible for grandchildren58 79.8% Not responsible for grandchildrenBlack or African American 20 100.0% Not responsible for grandchildrenAsian 60 100.0% Not responsible for grandchildrenOther race 12 100.0% Not responsible for grandchildrenTwo or more races 47 100.0% Not responsible for grandchildrenWhite alone, not Hispanic / Latino 18 42.5% Responsible for grandchildren24 57.5% Not responsible for grandchildrenHispanic or Latino 110 100.0% Not responsible for grandchildren