Races in Newark, Vermont (VT) Detailed Stats
Ancestries, Foreign-born residents, place of birth
2.1% of Newark, VT residents are foreign-born (2.1% born in Europe), which is 88.0% less than the foreign-born rate of 4.0% across the entire state of Vermont.
Race distribution in Newark

- 46498.7%White alone
- 30.6%American Indian alone
- 20.4%Hispanic
- 10.2%Asian alone

2000
2022
-
- 585,43196.2%White alone
- 6,8091.1%Two or more races
- 5,5040.9%Hispanic
- 5,1600.8%Asian alone
- 2,9210.5%Black alone
- 2,3250.4%American Indian alone
- 5570.09%Other race alone
- 1200.02%Native Hawaiian and Other
Pacific Islander alone

-
- 583,54690.2%White alone
- 27,3404.2%Two or more races
- 14,7702.3%Hispanic
- 11,5121.8%Asian alone
- 6,2641.0%Black alone
- 2,5210.4%Other race alone
- 1,0520.2%American Indian alone
- 590.01%Native Hawaiian and Other
Pacific Islander alone

Income and house value in Newark
- Median household income in 2022
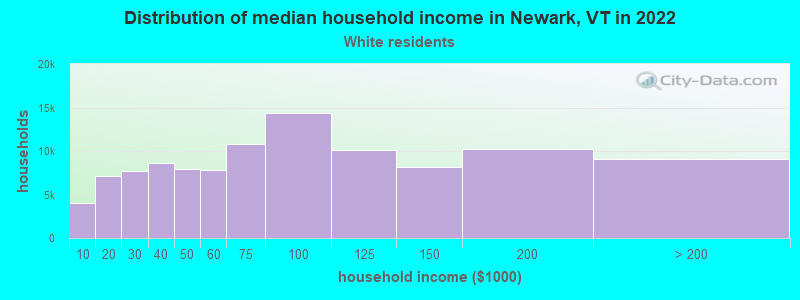
- $61,402White non-Hispanic householders
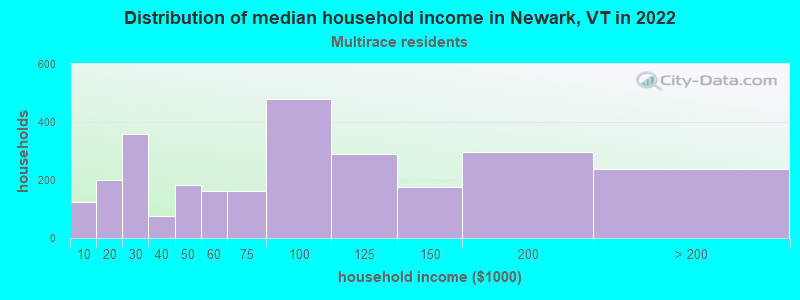
- $13,183Two or more races householders
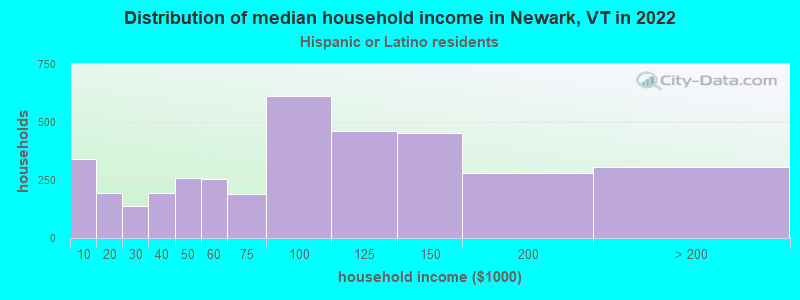
- $56,026Hispanic or Latino race householders
- Median 2022 house value
- $188,189White Non-Hispanic householders
Household income for White non-Hispanic householders
Household income for Two or more races householders
Household income for Hispanic or Latino race householders
Foreign-born residents in Newark
10 residents are foreign born (2.1% Europe).
| This city: | 2.1% |
| Vermont: | 3.8% |
Ancestries in Newark

- 10722.9%English
- 8017.1%Irish
- 5612.0%Other
- 5511.8%French
- 449.4%United States
- 245.1%Swedish
- 234.9%Scottish
- 173.6%German
- 173.6%Italian
- 153.2%French Canadian
- 132.8%Scotch-Irish
- 51.1%Polish
- 51.1%Welsh
- 30.6%Dutch
- 20.4%Hungarian
- 20.4%Norwegian

Zip codes: 05871.