Races in Oak Grove, South Carolina (SC) Detailed Stats
Ancestries, Foreign-born residents, place of birth
Settings
X


Recent posts about races in Oak Grove, South Carolina on our local forum with over 2,400,000 registered users:
 | Moving to SC - Columbia Area - any recommendations? (41 replies) |
| Realtor recommendations (3 replies) |
| Seafood Restaurants in Columbia (7 replies) |
| Relocating from Seattle area to Lexington, Oak Grove? (4 replies) |
| Cable TV / High Speed Internet Providers in Columbia? (10 replies) |
| Northeast versus Lexington -- and is Forest Acres worth the extra $$? (15 replies) |
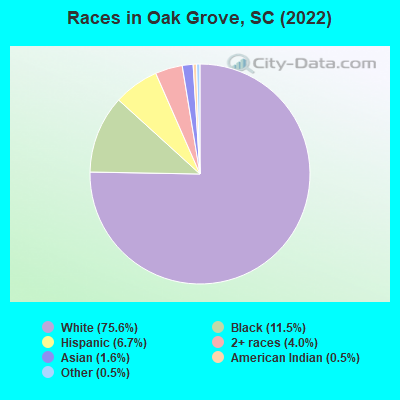
According to 2022 data, the most numerous races in Oak Grove, SC are White alone (8,839 residents), Black alone (1,339 residents), and Hispanic (788 residents). 94.3% of Oak Grove residents speak English at home. 4.0% of Oak Grove, SC residents are foreign-born (2.0% born in Latin America, 1.3% born in Asia, 0.5% born in Europe), which is 24.7% less than the foreign-born rate of 5.0% across the entire state of South Carolina.
Race distribution in Oak Grove
2000
2022

- 7,14787.3%White alone
- 6628.1%Black alone
- 1842.2%Hispanic
- 841.0%Asian alone
- 720.9%Two or more races
- 280.3%American Indian alone
- 50.06%Other race alone
- 10.01%Native Hawaiian and Other
Pacific Islander alone

-
- 8,83975.6%White alone
- 1,33911.5%Black alone
- 7886.7%Hispanic
- 4714.0%Two or more races
- 1851.6%Asian alone
- 540.5%Other race alone
- 620.5%American Indian alone
2000
2022
-
- 2,652,29166.1%White alone
- 1,178,48629.4%Black alone
- 95,0762.4%Hispanic
- 35,5680.9%Asian alone
- 33,2900.8%Two or more races
- 12,7650.3%American Indian alone
- 3,2660.08%Other race alone
- 1,2700.03%Native Hawaiian and Other
Pacific Islander alone

-
- 3,301,73962.5%White alone
- 1,313,29024.9%Black alone
- 343,7836.5%Hispanic
- 190,5083.6%Two or more races
- 89,8881.7%Asian alone
- 29,3900.6%Other race alone
- 12,1120.2%American Indian alone
- 1,9240.04%Native Hawaiian and Other
Pacific Islander alone

Income and house value in Oak Grove
- Median household income in 2022
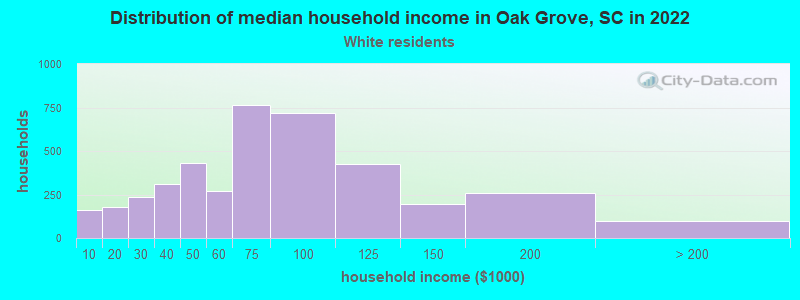
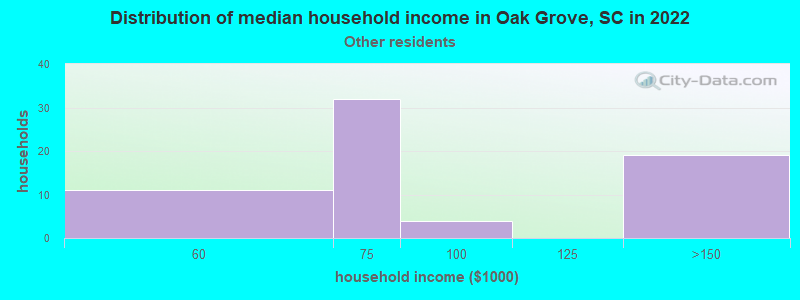
- $68,868White non-Hispanic householders
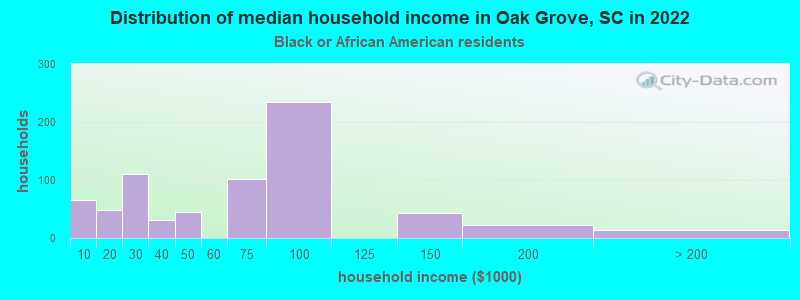
- $69,770Black householders
- $66,908Some other race householders
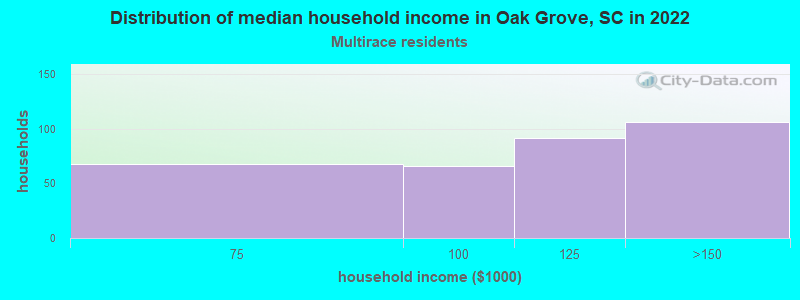
- $107,806Two or more races householders
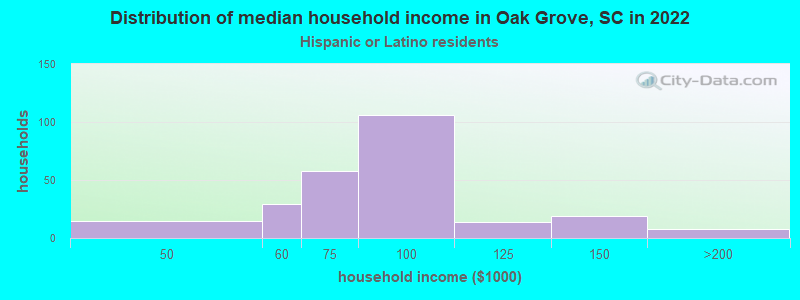
- $88,678Hispanic or Latino race householders
- Median 2022 house value
- $214,065White Non-Hispanic householders
- $184,637Black or African American householders
- $201,725American Indian or Alaska Native householders
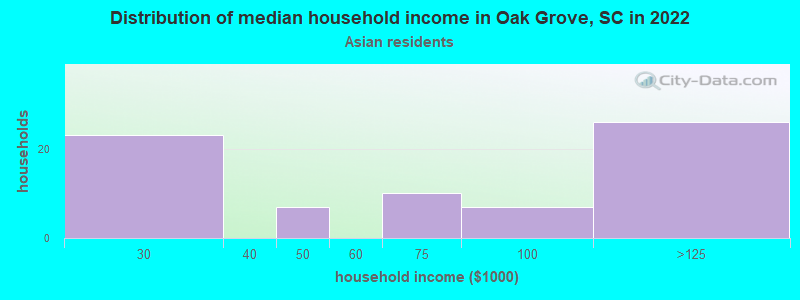
- $177,992Asian householders
- $255,122Some other race householders
- $215,964Two or more races householders
- $264,141Hispanic or Latino householders
Household income for White non-Hispanic householders
Household income for Black householders
Household income for Asian householders
Household income for Some other race householders
Household income for Two or more races householders
Household income for Hispanic or Latino race householders
Median age by race in Oak Grove
- 40.6Median age for White residents
- 37.4Males
- 42.1Females
- 31.4Median age for Black or African American residents
- 32.0Males
- 31.1Females
- 18.0Median age for American Indian / Alaska Native residents
- 16.8Males
- -659,400,544.3Females
- 51.0Median age for Asian residents
- 39.8Males
- 52.2Females
- -698,412,697.7Median age for Native Hawaiian / Pacific Islander residents
- -551,574,375.1Males
- -1,016,109,044.8Females
- 15.7Median age for Other race residents
- 15.3Males
- 42.5Females
- 33.6Median age for Two or more races residents
- 39.1Males
- 24.5Females
- 40.9Median age for White alone residents
- 37.7Males
- 43.5Females
- 25.9Median age for Hispanic or Latino residents
- 27.9Males
- 20.5Females
Owner/renter occupied households by race in Oak Grove
- House owners and renters - White residents
- 3,37883.5%Owner occupied
- 66716.5%Renter occupied
- House owners and renters - Black or African American residents
- 60983.7%Owner occupied
- 11816.3%Renter occupied
- House owners and renters - American Indian / Alaska Native residents
- 11100.0%Owner occupied
- House owners and renters - Asian residents
- 91100.0%Owner occupied
- House owners and renters - Other race residents
- 55100.0%Owner occupied
- House owners and renters - Two or more races residents
- 22973.0%Owner occupied
- 8527.0%Renter occupied
- House owners and renters - White alone residents
- 3,29883.7%Owner occupied
- 64116.3%Renter occupied
- House owners and renters - Hispanic or Latino residents
- 16871.4%Owner occupied
- 6728.6%Renter occupied
Language usage in Oak Grove
- English speakers - Total
- 94.3% of residents of Oak Grove speak English at home.
- 3.3% of residents speak Spanish at home
- 27676.0%Speak English very well
- 8724.0%Speak English less than very well
- 2.3% of residents speak other language at home
- 21082.0%Speak English very well
- 4618.0%Speak English less than very well
- English speakers - Born in the United States
- 95.3% of residents of Oak Grove speak English at home.
- 2.5% of residents speak Spanish at home
- 103100.0%Speak English very well
- 2.1% of residents speak other language at home
- 88100.0%Speak English very well
- English speakers - Native, born elsewhere
- 62.9% of residents of Oak Grove speak English at home.
- 37.6% of residents speak Spanish at home
- 5971.1%Speak English very well
- 2428.9%Speak English less than very well
- English speakers - Foreign-born
- 39.1% of residents of Oak Grove speak English at home.
- 25.7% of residents speak Spanish at home
- 6049.6%Speak English very well
- 6150.4%Speak English less than very well
- 34.0% of residents speak other language at home
- 11571.9%Speak English very well
- 4528.1%Speak English less than very well
White (Caucasian) - Speak only English
| Native: | 98.5% (8,292) |
| Foreign-born: | 72.0% (151) |
White (Caucasian) - Speak another language
| Native: | 1.5% (130) |
| Foreign-born: | 36.7% (77) |
Asian - Speak only English
| Native: | 41.6% (7) |
| Foreign-born: | 25.5% (39) |
Asian - Speak another language
| Native: | 60.0% (11) |
| Foreign-born: | 73.4% (113) |
Other race - Speak another language
| Native: | 61.6% (52) |
| Foreign-born: | 98.6% (54) |
White alone - Speak only English
| Native: | 99.6% (8,226) |
| Foreign-born: | 52.7% (46) |
White alone - Speak another language
| Native: | 0.4% (37) |
| Foreign-born: | 47.6% (42) |
Hispanic or Latino - Speak only English
| Native: | 42.5% (196) |
| Foreign-born: | 40.3% (91) |
Hispanic or Latino - Speak another language
| Native: | 56.2% (259) |
| Foreign-born: | 53.4% (121) |
Foreign-born residents in Oak Grove
469 residents are foreign born (2.0% Latin America, 1.3% Asia, 0.5% Europe).
| This city: | 4.0% |
| South Carolina: | 5.3% |


Marital status for residents in Oak Grove
Marital status - White (Caucasian) population 15 years and over
- Males
- 35.1%Never married
- 49.7%Now married
- 0.8%Separated
- 2.9%Widowed
- 11.5%Divorced
- Females
- 22.3%Never married
- 46.0%Now married
- 1.7%Separated
- 10.6%Widowed
- 19.4%Divorced
Women who gave birth in the past 12 months
| Now married: | 31.2% (39) |
| Unmarried: | 68.8% (85) |
Women who did not give birth in the past 12 months
| Now married: | 41.5% (759) |
| Unmarried: | 58.5% (1,070) |
Marital status - Black or African American population 15 years and over
- Males
- 57.4%Never married
- 18.1%Now married
- 0.0%Separated
- 2.9%Widowed
- 21.6%Divorced
- Females
- 47.8%Never married
- 15.4%Now married
- 4.6%Separated
- 12.6%Widowed
- 19.5%Divorced
Women who gave birth in the past 12 months
| Now married: | 0.0% (0) |
| Unmarried: | 100.0% (40) |
Women who did not give birth in the past 12 months
| Now married: | 18.6% (56) |
| Unmarried: | 81.4% (246) |
Marital status - Asian population 15 years and over
- Males
- 26.2%Never married
- 73.8%Now married
- 0.0%Separated
- 0.0%Widowed
- 0.0%Divorced
- Females
- 0.0%Never married
- 92.8%Now married
- 0.0%Separated
- 0.0%Widowed
- 7.2%Divorced
Women who did not give birth in the past 12 months
| Now married: | 100.0% (54) |
| Unmarried: | 0.0% (0) |
Marital status - Other race population 15 years and over
- Males
- 34.3%Never married
- 54.3%Now married
- 0.0%Separated
- 0.0%Widowed
- 11.4%Divorced
- Females
- 23.1%Never married
- 76.9%Now married
- 0.0%Separated
- 0.0%Widowed
- 0.0%Divorced
Women who did not give birth in the past 12 months
| Now married: | 0.0% (0) |
| Unmarried: | 100.0% (4) |
Marital status - Two or more races population 15 years and over
- Males
- 45.7%Never married
- 51.0%Now married
- 0.0%Separated
- 3.3%Widowed
- 0.0%Divorced
- Females
- 79.8%Never married
- 20.2%Now married
- 0.0%Separated
- 0.0%Widowed
- 0.0%Divorced
Women who did not give birth in the past 12 months
| Now married: | 8.6% (15) |
| Unmarried: | 91.4% (157) |
Marital status - White alone, not Hispanic / Latino population 15 years and over
- Males
- 34.4%Never married
- 50.2%Now married
- 0.9%Separated
- 3.0%Widowed
- 11.6%Divorced
- Females
- 21.4%Never married
- 46.0%Now married
- 1.7%Separated
- 10.9%Widowed
- 19.9%Divorced
Women who gave birth in the past 12 months
| Now married: | 31.2% (39) |
| Unmarried: | 68.8% (87) |
Women who did not give birth in the past 12 months
| Now married: | 41.8% (741) |
| Unmarried: | 58.2% (1,033) |
Marital status - Hispanic or Latino population 15 years and over
- Males
- 41.9%Never married
- 48.1%Now married
- 0.0%Separated
- 0.0%Widowed
- 10.0%Divorced
- Females
- 52.2%Never married
- 47.8%Now married
- 0.0%Separated
- 0.0%Widowed
- 0.0%Divorced
Women who did not give birth in the past 12 months
| Now married: | 29.6% (45) |
| Unmarried: | 70.4% (106) |
Ancestries in Oak Grove

- 85215.6%American
- 68712.6%English
- 5009.2%German
- 3626.6%Irish
- 2174.0%African
- 1853.4%Scotch-Irish
- 1532.8%European
- 1522.8%Italian
- 1142.1%Scottish
- 561.0%Israeli
- 380.7%Eastern European
- 340.6%Russian
- 320.6%British
- 290.5%Arab
- 290.5%French Canadian
- 270.5%Dutch
- 240.4%Polish
- 140.3%Hungarian
- 90.2%Scandinavian
- 70.1%French
- 60.1%Lithuanian

Geographical mobility in Oak Grove

- Same house 1 year ago
- 7,67884.7%White (Caucasian)
- 1,22088.9%Black or African American
- 70100.0%American Indian / Alaska Native
- 18599.7%Asian
- 16591.9%Other race
- 48072.5%Two or more races
- 7,36684.3%White alone, not Hispanic / Latino
- 71690.9%Hispanic or Latino

-
- Moved within same county
- 8469.3%White / Caucasian
- 171.3%Black or African American
- 14521.9%Two or more races
- 8599.8%White alone, not Hispanic / Latino

-
- Moved within same state
- 2102.3%White / Caucasian
- 1228.9%Black or African American
- 105.4%Other race
- 223.3%Two or more races
- 1992.3%White alone, not Hispanic / Latino
- 293.7%Hispanic or Latino

-
- Moved from different state
- 2542.8%White / Caucasian
- 171.3%Black or African American
- 91.3%Two or more races
- 2332.7%White alone, not Hispanic / Latino
- 334.3%Hispanic or Latino

Children Nativity (place of birth) in Oak Grove
Place of birth for residents in Oak Grove
![Place of birth for the foreign-born population - Regions]()
- 246Americas
- 233Latin America
- 194Central America
- 150Asia
- 74South Eastern Asia
- 55Europe
- 44South Central Asia
- 39South America
- 31Eastern Asia
- 25Western Europe
- 24China
- 16Africa
- 16Northern Africa
- 15Northern Europe
- 15Eastern Europe
- 13Northern America

![Place of birth for the foreign-born population - Countries]()
- 163Mexico
- 44India
- 44Philippines
- 30Honduras
- 25Germany
- 24China
- 20Thailand
- 16Algeria
- 15United Kingdom
- 15Hungary
- 14Uruguay
- 14Venezuela
- 13Canada
- 11Chile
- 7Korea
- 7Burma (Myanmar)
- 3Vietnam

Grandparents responsible for own grandchildren in Oak Grove
Zip codes: 29073.