Races in Oakwood, Georgia (GA) Detailed Stats
Data:
Races - White alone (%)
Races - White alone (% change since 2000)
Races - Black alone (%)
Races - Black alone (% change since 2000)
Races - American Indian alone (%)
Races - American Indian alone (% change since 2000)
Races - Asian alone (%)
Races - Asian alone (% change since 2000)
Races - Hispanic (%)
Races - Hispanic (% change since 2000)
Races - Native Hawaiian and Other Pacific Islander alone (%)
Races - Native Hawaiian and Other Pacific Islander alone (% change since 2000)
Races - Two or more races(%)
Races - Two or more races(% change since 2000)
Races - Other race alone (%)
Races - Other race alone (% change since 2000)
Racial diversity
Place of birth - Born in state of residence (%)
Place of birth - Born in state of residence (%) - White
Place of birth - Born in state of residence (%) - Black or African American
Place of birth - Born in state of residence (%) - Asian
Place of birth - Born in state of residence (%) - Hispanic or Latino
Place of birth - Born in state of residence (%) - American Indian and Alaska Native
Place of birth - Born in state of residence (%) - Multirace
Place of birth - Born in state of residence (%) - Other Race
Place of birth - Born in other state (%)
Place of birth - Born in other state (%) - White
Place of birth - Born in other state (%) - Black or African American
Place of birth - Born in other state (%) - Asian
Place of birth - Born in other state (%) - Hispanic or Latino
Place of birth - Born in other state (%) - American Indian and Alaska Native
Place of birth - Born in other state (%) - Multirace
Place of birth - Born in other state (%) - Other Race
Place of birth - Native, outside of US (%)
Place of birth - Native, outside of US (%) - White
Place of birth - Native, outside of US (%) - Black or African American
Place of birth - Native, outside of US (%) - Asian
Place of birth - Native, outside of US (%) - Hispanic or Latino
Place of birth - Native, outside of US (%) - American Indian and Alaska Native
Place of birth - Native, outside of US (%) - Multirace
Place of birth - Native, outside of US (%) - Other Race
Place of birth - Foreign born (%)
Place of birth - Foreign born (%) - White
Place of birth - Foreign born (%) - Black or African American
Place of birth - Foreign born (%) - Asian
Place of birth - Foreign born (%) - Hispanic or Latino
Place of birth - Foreign born (%) - American Indian and Alaska Native
Place of birth - Foreign born (%) - Multirace
Place of birth - Foreign born (%) - Other Race
Residents speaking English at home (%)
Residents speaking English at home - Born in the United States (%)
Residents speaking English at home - Native, born elsewhere (%)
Residents speaking English at home - Foreign born (%)
Residents speaking Spanish at home (%)
Residents speaking Spanish at home - Born in the United States (%)
Residents speaking Spanish at home - Native, born elsewhere (%)
Residents speaking Spanish at home - Foreign born (%)
Residents speaking other language at home (%)
Residents speaking other language at home - Born in the United States (%)
Residents speaking other language at home - Native, born elsewhere (%)
Residents speaking other language at home - Foreign born (%)
Marital status - Never married (%)
Marital status - Now married (%)
Marital status - Separated (%)
Marital status - Widowed (%)
Marital status - Divorced (%)
Ancestries Reported - Arab (%)
Ancestries Reported - Czech (%)
Ancestries Reported - Danish (%)
Ancestries Reported - Dutch (%)
Ancestries Reported - English (%)
Ancestries Reported - French (%)
Ancestries Reported - French Canadian (%)
Ancestries Reported - German (%)
Ancestries Reported - Greek (%)
Ancestries Reported - Hungarian (%)
Ancestries Reported - Irish (%)
Ancestries Reported - Italian (%)
Ancestries Reported - Lithuanian (%)
Ancestries Reported - Norwegian (%)
Ancestries Reported - Polish (%)
Ancestries Reported - Portuguese (%)
Ancestries Reported - Russian (%)
Ancestries Reported - Scotch-Irish (%)
Ancestries Reported - Scottish (%)
Ancestries Reported - Slovak (%)
Ancestries Reported - Subsaharan African (%)
Ancestries Reported - Swedish (%)
Ancestries Reported - Swiss (%)
Ancestries Reported - Ukrainian (%)
Ancestries Reported - United States (%)
Ancestries Reported - Welsh (%)
Ancestries Reported - West Indian (%)
Ancestries Reported - Other (%)
Geographical mobility - Same house 1 year ago (%)
Geographical mobility - Same house 1 year ago (%) - White
Geographical mobility - Same house 1 year ago (%) - Black or African American
Geographical mobility - Same house 1 year ago (%) - Asian
Geographical mobility - Same house 1 year ago (%) - Hispanic or Latino
Geographical mobility - Same house 1 year ago (%) - American Indian and Alaska Native
Geographical mobility - Same house 1 year ago (%) - Multirace
Geographical mobility - Same house 1 year ago (%) - Other Race
Geographical mobility - Moved within same county (%)
Geographical mobility - Moved within same county (%) - White
Geographical mobility - Moved within same county (%) - Black or African American
Geographical mobility - Moved within same county (%) - Asian
Geographical mobility - Moved within same county (%) - Hispanic or Latino
Geographical mobility - Moved within same county (%) - American Indian and Alaska Native
Geographical mobility - Moved within same county (%) - Multirace
Geographical mobility - Moved within same county (%) - Other Race
Geographical mobility - Moved from different county within same state (%)
Geographical mobility - Moved from different county within same state (%) - White
Geographical mobility - Moved from different county within same state (%) - Black or African American
Geographical mobility - Moved from different county within same state (%) - Asian
Geographical mobility - Moved from different county within same state (%) - Hispanic or Latino
Geographical mobility - Moved from different county within same state (%) - American Indian and Alaska Native
Geographical mobility - Moved from different county within same state (%) - Multirace
Geographical mobility - Moved from different county within same state (%) - Other Race
Geographical mobility - Moved from different state (%)
Geographical mobility - Moved from different state (%) - White
Geographical mobility - Moved from different state (%) - Black or African American
Geographical mobility - Moved from different state (%) - Asian
Geographical mobility - Moved from different state (%) - Hispanic or Latino
Geographical mobility - Moved from different state (%) - American Indian and Alaska Native
Geographical mobility - Moved from different state (%) - Multirace
Geographical mobility - Moved from different state (%) - Other Race
Geographical mobility - Moved from abroad (%)
Geographical mobility - Moved from abroad (%) - White
Geographical mobility - Moved from abroad (%) - Black or African American
Geographical mobility - Moved from abroad (%) - Asian
Geographical mobility - Moved from abroad (%) - Hispanic or Latino
Geographical mobility - Moved from abroad (%) - American Indian and Alaska Native
Geographical mobility - Moved from abroad (%) - Multirace
Geographical mobility - Moved from abroad (%) - Other Race
Place of birth for the foreign-born population - Ireland (%)
Place of birth for the foreign-born population - Denmark (%)
Place of birth for the foreign-born population - Norway (%)
Place of birth for the foreign-born population - Sweden (%)
Place of birth for the foreign-born population - United Kingdom (%)
Place of birth for the foreign-born population - England (%)
Place of birth for the foreign-born population - Scotland (%)
Place of birth for the foreign-born population - Other Northern Europe (%)
Place of birth for the foreign-born population - Austria (%)
Place of birth for the foreign-born population - Belgium (%)
Place of birth for the foreign-born population - France (%)
Place of birth for the foreign-born population - Germany (%)
Place of birth for the foreign-born population - Netherlands (%)
Place of birth for the foreign-born population - Switzerland (%)
Place of birth for the foreign-born population - Other Western Europe (%)
Place of birth for the foreign-born population - Greece (%)
Place of birth for the foreign-born population - Italy (%)
Place of birth for the foreign-born population - Portugal (%)
Place of birth for the foreign-born population - Spain (%)
Place of birth for the foreign-born population - Other Southern Europe (%)
Place of birth for the foreign-born population - Albania (%)
Place of birth for the foreign-born population - Belarus (%)
Place of birth for the foreign-born population - Bosnia and Herzegovina (%)
Place of birth for the foreign-born population - Bulgaria (%)
Place of birth for the foreign-born population - Croatia (%)
Place of birth for the foreign-born population - Czechoslovakia (%)
Place of birth for the foreign-born population - Hungary (%)
Place of birth for the foreign-born population - Latvia (%)
Place of birth for the foreign-born population - Lithuania (%)
Place of birth for the foreign-born population - North Macedonia (Macedonia) (%)
Place of birth for the foreign-born population - Moldova (%)
Place of birth for the foreign-born population - Poland (%)
Place of birth for the foreign-born population - Romania (%)
Place of birth for the foreign-born population - Russia (%)
Place of birth for the foreign-born population - Serbia (%)
Place of birth for the foreign-born population - Ukraine (%)
Place of birth for the foreign-born population - Other Eastern Europe (%)
Place of birth for the foreign-born population - China (%)
Place of birth for the foreign-born population - Hong Kong (%)
Place of birth for the foreign-born population - Taiwan (%)
Place of birth for the foreign-born population - Japan (%)
Place of birth for the foreign-born population - Korea (%)
Place of birth for the foreign-born population - Other Eastern Asia (%)
Place of birth for the foreign-born population - Afghanistan (%)
Place of birth for the foreign-born population - Bangladesh (%)
Place of birth for the foreign-born population - India (%)
Place of birth for the foreign-born population - Iran (%)
Place of birth for the foreign-born population - Kazakhstan (%)
Place of birth for the foreign-born population - Nepal (%)
Place of birth for the foreign-born population - Pakistan (%)
Place of birth for the foreign-born population - Sri Lanka (%)
Place of birth for the foreign-born population - Uzbekistan (%)
Place of birth for the foreign-born population - Other South Central Asia (%)
Place of birth for the foreign-born population - Burma (%)
Place of birth for the foreign-born population - Cambodia (%)
Place of birth for the foreign-born population - Indonesia (%)
Place of birth for the foreign-born population - Laos (%)
Place of birth for the foreign-born population - Malaysia (%)
Place of birth for the foreign-born population - Philippines (%)
Place of birth for the foreign-born population - Singapore (%)
Place of birth for the foreign-born population - Thailand (%)
Place of birth for the foreign-born population - Vietnam (%)
Place of birth for the foreign-born population - Other South Eastern Asia (%)
Place of birth for the foreign-born population - Armenia (%)
Place of birth for the foreign-born population - Iraq (%)
Place of birth for the foreign-born population - Israel (%)
Place of birth for the foreign-born population - Jordan (%)
Place of birth for the foreign-born population - Kuwait (%)
Place of birth for the foreign-born population - Lebanon (%)
Place of birth for the foreign-born population - Saudi Arabia (%)
Place of birth for the foreign-born population - Syria (%)
Place of birth for the foreign-born population - Turkey (%)
Place of birth for the foreign-born population - Yemen (%)
Place of birth for the foreign-born population - Other Western Asia (%)
Place of birth for the foreign-born population - Eritrea (%)
Place of birth for the foreign-born population - Ethiopia (%)
Place of birth for the foreign-born population - Kenya (%)
Place of birth for the foreign-born population - Somalia (%)
Place of birth for the foreign-born population - Uganda (%)
Place of birth for the foreign-born population - Zimbabwe (%)
Place of birth for the foreign-born population - Other Eastern Africa (%)
Place of birth for the foreign-born population - Cameroon (%)
Place of birth for the foreign-born population - Congo (%)
Place of birth for the foreign-born population - Democratic Republic of Congo (Zaire) (%)
Place of birth for the foreign-born population - Other Middle Africa (%)
Place of birth for the foreign-born population - Egypt (%)
Place of birth for the foreign-born population - Morocco (%)
Place of birth for the foreign-born population - Sudan (%)
Place of birth for the foreign-born population - Other Northern Africa (%)
Place of birth for the foreign-born population - South Africa (%)
Place of birth for the foreign-born population - Other Southern Africa (%)
Place of birth for the foreign-born population - Cabo Verde (%)
Place of birth for the foreign-born population - Ghana (%)
Place of birth for the foreign-born population - Liberia (%)
Place of birth for the foreign-born population - Nigeria (%)
Place of birth for the foreign-born population - Senegal (%)
Place of birth for the foreign-born population - Sierra Leone (%)
Place of birth for the foreign-born population - Other Western Africa (%)
Place of birth for the foreign-born population - Australia (%)
Place of birth for the foreign-born population - New Zealand (%)
Place of birth for the foreign-born population - Fiji (%)
Place of birth for the foreign-born population - Micronesia (%)
Place of birth for the foreign-born population - Bahamas (%)
Place of birth for the foreign-born population - Barbados (%)
Place of birth for the foreign-born population - Cuba (%)
Place of birth for the foreign-born population - Dominica (%)
Place of birth for the foreign-born population - Dominican Republic (%)
Place of birth for the foreign-born population - Grenada (%)
Place of birth for the foreign-born population - Haiti (%)
Place of birth for the foreign-born population - Jamaica (%)
Place of birth for the foreign-born population - St. Vincent and the Grenadines (%)
Place of birth for the foreign-born population - Trinidad and Tobago (%)
Place of birth for the foreign-born population - West Indies (%)
Place of birth for the foreign-born population - Other Caribbean (%)
Place of birth for the foreign-born population - Belize (%)
Place of birth for the foreign-born population - Costa Rica (%)
Place of birth for the foreign-born population - El Salvador (%)
Place of birth for the foreign-born population - Guatemala (%)
Place of birth for the foreign-born population - Honduras (%)
Place of birth for the foreign-born population - Mexico (%)
Place of birth for the foreign-born population - Nicaragua (%)
Place of birth for the foreign-born population - Panama (%)
Place of birth for the foreign-born population - Other Central America (%)
Place of birth for the foreign-born population - Argentina (%)
Place of birth for the foreign-born population - Bolivia (%)
Place of birth for the foreign-born population - Brazil (%)
Place of birth for the foreign-born population - Chile (%)
Place of birth for the foreign-born population - Colombia (%)
Place of birth for the foreign-born population - Ecuador (%)
Place of birth for the foreign-born population - Guyana (%)
Place of birth for the foreign-born population - Peru (%)
Place of birth for the foreign-born population - Uruguay (%)
Place of birth for the foreign-born population - Venezuela (%)
Place of birth for the foreign-born population - Other South America (%)
Place of birth for the foreign-born population - Canada (%)
Place of birth for the foreign-born population - Other Northern America (%)
Place of birth for the foreign-born population - Other (%)
Latest news about races in Oakwood, GA collected exclusively by city-data.com from local newspapers, TV, and radio stations
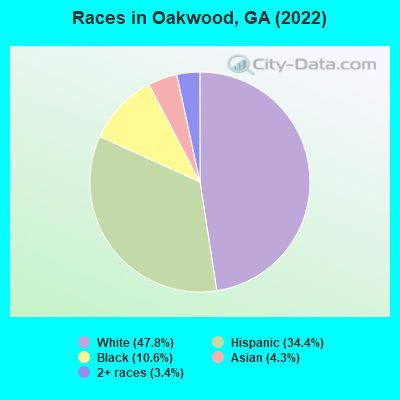
According to 2022 data, the most numerous races in Oakwood, GA are White alone (2,543 residents), Black alone (564 residents), and Hispanic (1,832 residents). 67.6% of Oakwood residents speak English at home. 16.8% of Oakwood, GA residents are foreign-born (13.2% born in Latin America, 3.0% born in Asia), which is 40.5% greater than the foreign-born rate of 10.0% across the entire state of Georgia.
Race distribution in Oakwood
2000 2022
5,128,661 62.6% White alone 2,331,465 28.5% Black alone 435,227 5.3% Hispanic 171,513 2.1% Asian alone 87,364 1.1% Two or more races 17,670 0.2% American Indian alone 11,275 0.1% Other race alone 3,278 0.04% Native Hawaiian and Other
5,415,657 49.6% White alone 3,349,240 30.7% Black alone 1,132,604 10.4% Hispanic 479,156 4.4% Asian alone 462,923 4.2% Two or more races 54,416 0.5% Other race alone 11,923 0.1% American Indian alone 6,957 0.06% Native Hawaiian and Other
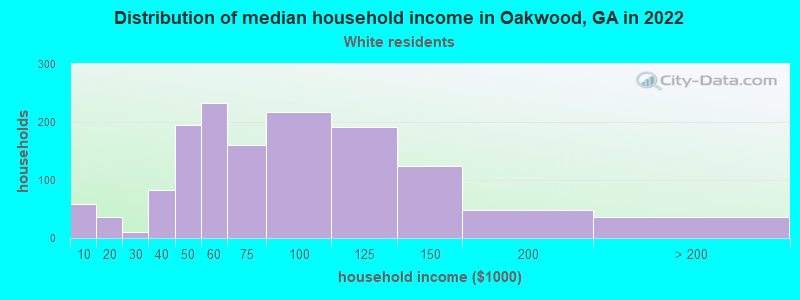
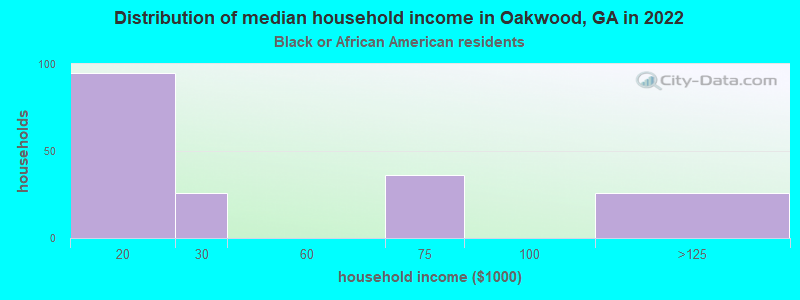
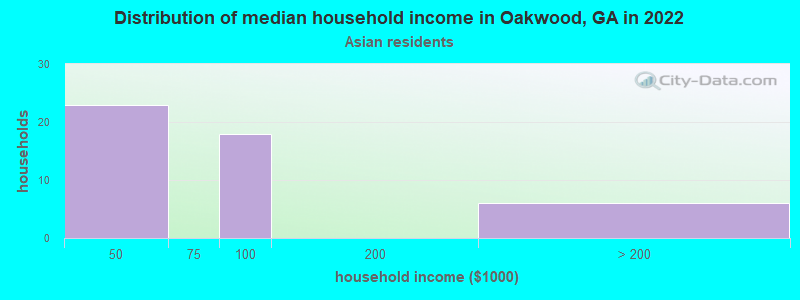
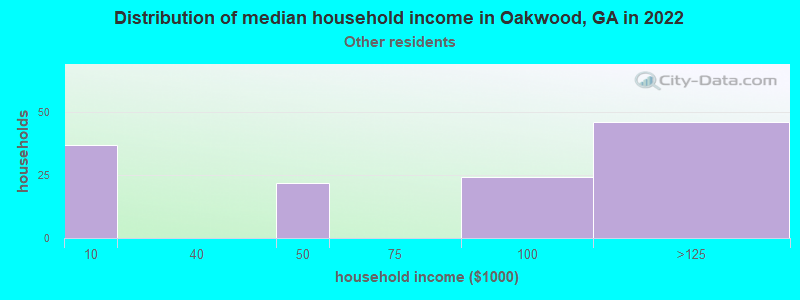
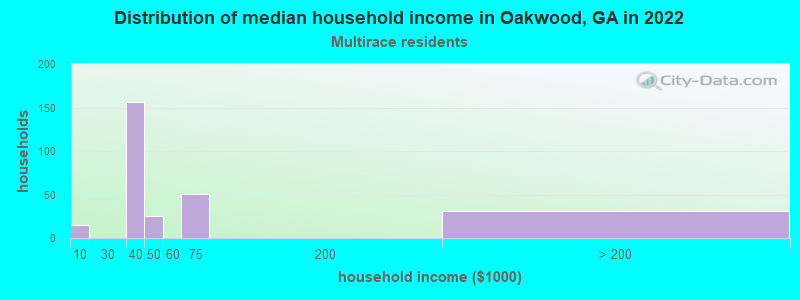
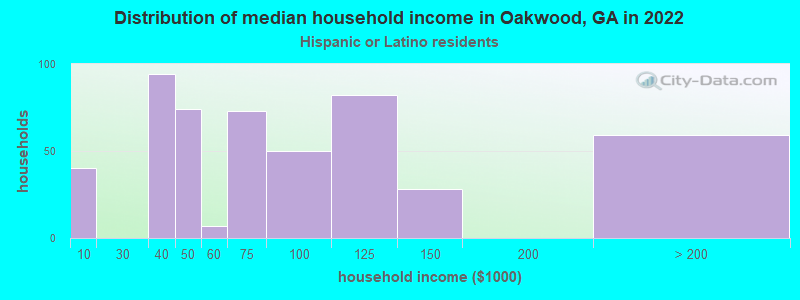
Income and house value in Oakwood Median household income in 2022 $61,178 White non-Hispanic householders$41,100 Two or more races householders$71,194 Hispanic or Latino race householdersMedian 2022 house value $299,483 White Non-Hispanic householders$292,972 Black or African American householders$221,357 Hispanic or Latino householders
Median age by race in Oakwood
34.1 Median age for White residents31.0 34.7 31.7 Median age for Black or African American residents28.1 39.9 -1,045,751,632.9 Median age for American Indian / Alaska Native residents-924,369,747.0 -728,842,831.7 27.0 Median age for Asian residents31.8 25.5 -666,666,666.0 Median age for Native Hawaiian / Pacific Islander residents-666,666,666.0 -666,666,666.0 37.5 Median age for Other race residents46.9 14.0 29.9 Median age for Two or more races residents26.5 32.0 32.9 Median age for White alone residents33.1 33.0 29.8 Median age for Hispanic or Latino residents28.1 31.4
Owner/renter occupied households by race in Oakwood
House owners and renters - White residents 662 49.5% Owner occupied676 50.5% Renter occupiedHouse owners and renters - Black or African American residents 24 12.2% Owner occupied172 87.8% Renter occupiedHouse owners and renters - Asian residents 4 7.0% Owner occupied52 93.0% Renter occupiedHouse owners and renters - Other race residents 49 27.0% Owner occupied133 73.0% Renter occupiedHouse owners and renters - Two or more races residents 112 34.2% Owner occupied216 65.8% Renter occupiedHouse owners and renters - White alone residents 532 42.9% Owner occupied708 57.1% Renter occupiedHouse owners and renters - Hispanic or Latino residents 287 57.4% Owner occupied213 42.6% Renter occupied
Language usage in Oakwood
English speakers - Total 67.6% of residents of Oakwood speak English at home.
29.0% of residents speak Spanish at home 582 40.3% Speak English very well862 59.7% Speak English less than very well3.4% of residents speak other language at home 133 78.2% Speak English very well37 21.8% Speak English less than very well
English speakers - Born in the United States 88.7% of residents of Oakwood speak English at home.
10.0% of residents speak Spanish at home 102 100.0% Speak English very well2.0% of residents speak other language at home 20 100.0% Speak English less than very well
English speakers - Native, born elsewhere 0.0% of residents of Oakwood speak English at home.
167.7% of residents speak Spanish at home 176 78.9% Speak English very well47 21.1% Speak English less than very well3.8% of residents speak other language at home 5 100.0% Speak English very well
English speakers - Foreign-born 10.2% of residents of Oakwood speak English at home.
74.6% of residents speak Spanish at home 125 18.6% Speak English very well546 81.4% Speak English less than very well15.5% of residents speak other language at home 106 76.3% Speak English very well33 23.7% Speak English less than very well
White (Caucasian) - Speak only English Native:
84.7% (2,437)Foreign-born:
4.4% (5)
White (Caucasian) - Speak another language Native:
10.9% (313)Foreign-born:
100.0% (103)
Black or African American - Speak only English Native:
99.8% (464)Foreign-born:
97.7% (15)
Asian - Speak another language Native:
100.0% (8)Foreign-born:
89.5% (146)
Other race - Speak another language Native:
73.1% (150)Foreign-born:
96.7% (386)
Two or more races - Speak only English Native:
60.7% (287)Foreign-born:
22.4% (71)
Two or more races - Speak another language Native:
38.7% (183)Foreign-born:
83.0% (264)
White alone - Speak only English Native:
99.8% (2,374)Foreign-born:
87.9% (6)
Hispanic or Latino - Speak only English Native:
26.3% (268)Foreign-born:
10.3% (75)
Hispanic or Latino - Speak another language Native:
75.4% (769)Foreign-born:
91.6% (671)
Foreign-born residents in Oakwood 895 residents are foreign born (13.2% Latin America , 3.0% Asia ).
This city:
16.8%Georgia:
10.4%
Marital status for residents in Oakwood Marital status - White (Caucasian) population 15 years and over
Males 45.6% Never married34.2% Now married1.1% Separated0.0% Widowed19.1% DivorcedFemales 38.2% Never married27.5% Now married8.4% Separated9.3% Widowed16.6% DivorcedWomen who gave birth in the past 12 months Now married:
78.7% (53)Unmarried:
21.3% (14)
Women who did not give birth in the past 12 months Now married:
29.4% (266)Unmarried:
70.6% (637)
Marital status - Black or African American population 15 years and over
Males 57.0% Never married43.0% Now married0.0% Separated0.0% Widowed0.0% DivorcedFemales 57.0% Never married27.4% Now married4.8% Separated0.0% Widowed10.8% DivorcedWomen who did not give birth in the past 12 months Now married:
33.3% (47)Unmarried:
66.7% (95)
Marital status - Asian population 15 years and over
Males 0.0% Never married88.5% Now married0.0% Separated0.0% Widowed11.5% DivorcedFemales 41.1% Never married58.9% Now married0.0% Separated0.0% Widowed0.0% DivorcedWomen who gave birth in the past 12 months Now married:
100.0% (23)Unmarried:
0.0% (0)
Women who did not give birth in the past 12 months Now married:
46.6% (35)Unmarried:
53.4% (40)
Marital status - Other race population 15 years and over
Males 4.2% Never married95.8% Now married0.0% Separated0.0% Widowed0.0% DivorcedFemales 33.3% Never married55.3% Now married11.4% Separated0.0% Widowed0.0% DivorcedWomen who gave birth in the past 12 months Now married:
100.0% (31)Unmarried:
0.0% (0)
Women who did not give birth in the past 12 months Now married:
48.8% (65)Unmarried:
51.2% (68)
Marital status - Two or more races population 15 years and over
Males 14.8% Never married57.4% Now married0.0% Separated0.0% Widowed27.7% DivorcedFemales 47.8% Never married23.2% Now married1.4% Separated27.5% Widowed0.0% DivorcedWomen who gave birth in the past 12 months Now married:
100.0% (25)Unmarried:
0.0% (0)
Women who did not give birth in the past 12 months Now married:
27.5% (70)Unmarried:
72.5% (184)
Marital status - White alone, not Hispanic / Latino population 15 years and over
Males 40.7% Never married39.1% Now married1.4% Separated0.0% Widowed18.8% DivorcedFemales 27.7% Never married38.8% Now married0.9% Separated13.3% Widowed19.3% DivorcedWomen who gave birth in the past 12 months Now married:
100.0% (59)Unmarried:
0.0% (0)
Women who did not give birth in the past 12 months Now married:
42.7% (294)Unmarried:
57.3% (394)
Marital status - Hispanic or Latino population 15 years and over
Males 33.8% Never married49.6% Now married0.0% Separated0.0% Widowed16.5% DivorcedFemales 50.8% Never married16.6% Now married17.0% Separated9.6% Widowed5.9% DivorcedWomen who gave birth in the past 12 months Now married:
70.4% (40)Unmarried:
29.6% (17)
Women who did not give birth in the past 12 months Now married:
16.1% (87)Unmarried:
83.9% (453)
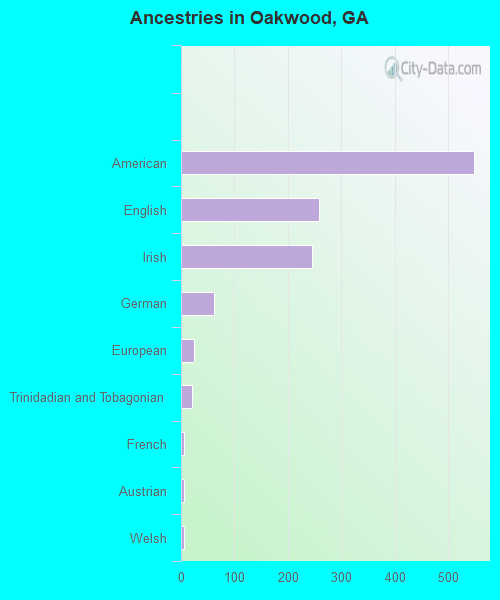
Ancestries in Oakwood
549 19.6% American259 9.2% English246 8.8% Irish62 2.2% German25 0.9% European21 0.7% Trinidadian and Tobagonian6 0.2% French5 0.2% Austrian5 0.2% Welsh4 0.1% Dutch3 0.1% British
Children Nativity (place of birth) in Oakwood
Children under 6 years - Living with two parents Both parents native 121 100.0% NativeBoth parents foreign-born 53 100.0% NativeOne native, one foreign-born parent 55 100.0% NativeChildren under 6 years - Living with one parent Native parent 168 100.0% NativeForeign-born parent 20 100.0% NativeChildren 6 to 17 years - Living with two parents Both parents native 88 100.0% NativeBoth parents foreign-born 16 100.0% NativeOne native, one foreign-born parent 74 100.0% NativeChildren 6 to 17 years - Living with one parent Native parent 317 100.0% NativeForeign-born parent 261 51.4% Native246 48.6% Foreign-born