Races in Onalaska, Wisconsin (WI) Detailed Stats
Ancestries, Foreign-born residents, place of birth
Settings
X


Recent posts about races in Onalaska, Wisconsin on our local forum with over 2,400,000 registered users:
 | Billings MT or Onalaska WI???? (22 replies) |
| housing location advice for work in Sparta: maybe West Salem or Onalaska? (3 replies) |
| Onalaska, La Crosse or ? (18 replies) |
| Onalaska or La Cresent, MN (9 replies) |
| La Crosse or Eau Claire for our family (6 replies) |
| looking for a rental home in LaCrosse,Holmen,Onalaska (4 replies) |
Latest news about races in Onalaska, WI collected exclusively by city-data.com from local newspapers, TV, and radio stations
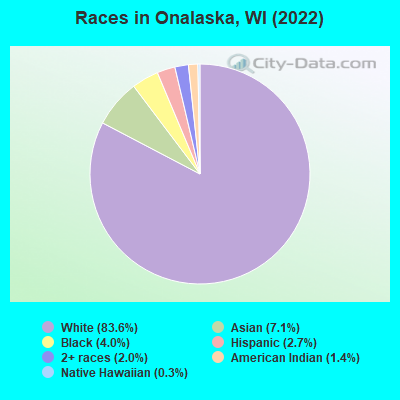
According to 2022 data, the most numerous races in Onalaska, WI are White alone (15,757 residents), Hispanic (514 residents), and Black alone (747 residents). 90.6% of Onalaska residents speak English at home. 4.1% of Onalaska, WI residents are foreign-born (3.4% born in Asia, 0.6% born in Europe), which is 22.7% less than the foreign-born rate of 5.0% across the entire state of Wisconsin.
Race distribution in Onalaska
2000
2022

- 14,04094.6%White alone
- 4132.8%Asian alone
- 1411.0%Hispanic
- 1230.8%Two or more races
- 870.6%Black alone
- 260.2%American Indian alone
- 90.06%Other race alone

-
- 15,75783.6%White alone
- 1,3367.1%Asian alone
- 7474.0%Black alone
- 5142.7%Hispanic
- 3792.0%Two or more races
- 2681.4%American Indian alone
- 480.3%Native Hawaiian and Other
Pacific Islander alone
2000
2022
-
- 4,681,63087.3%White alone
- 300,2455.6%Black alone
- 192,9213.6%Hispanic
- 87,9951.6%Asian alone
- 51,9211.0%Two or more races
- 43,9800.8%American Indian alone
- 3,6370.07%Other race alone
- 1,3460.03%Native Hawaiian and Other
Pacific Islander alone

-
- 4,654,03179.0%White alone
- 447,0227.6%Hispanic
- 345,6785.9%Black alone
- 217,5323.7%Two or more races
- 172,2422.9%Asian alone
- 33,7620.6%American Indian alone
- 19,6800.3%Other race alone
- 2,5920.04%Native Hawaiian and Other
Pacific Islander alone

Income and house value in Onalaska
- Median household income in 2022
- $79,612White non-Hispanic householders
- $103,422Black householders
- over $200,000Asian householders
- $49,397Two or more races householders
- Median 2022 house value
- $284,480White Non-Hispanic householders
- $280,245Black or African American householders
- $352,237Asian householders
- $210,246Two or more races householders
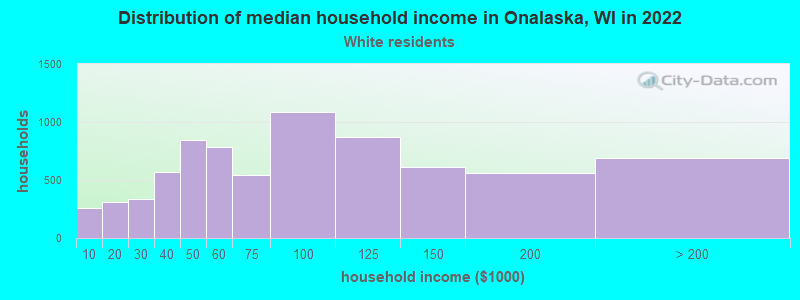
Household income for White non-Hispanic householders
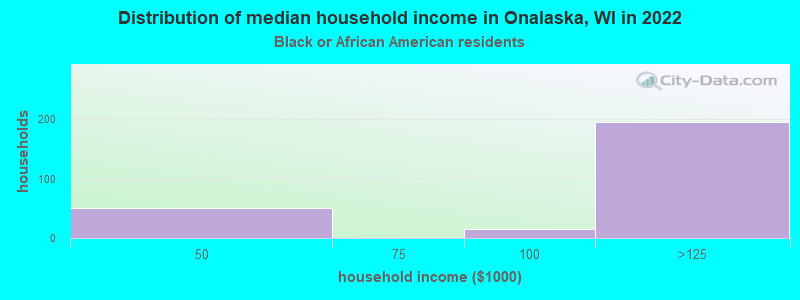
Household income for Black householders
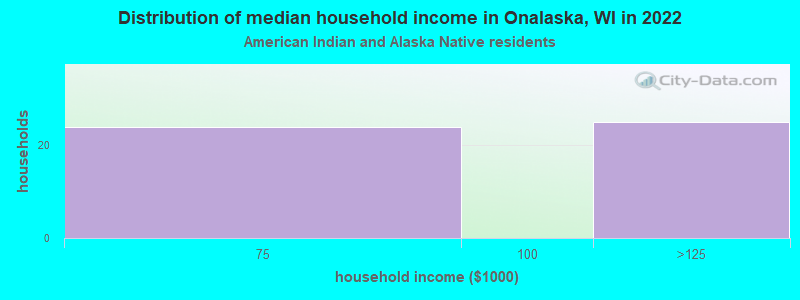
Household income for American Indian and Alaska Native householders
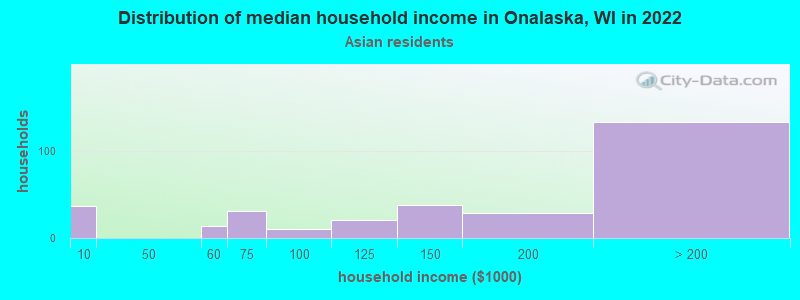
Household income for Asian householders
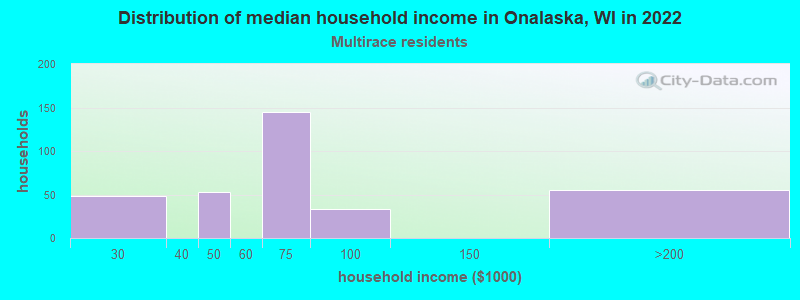
Household income for Two or more races householders
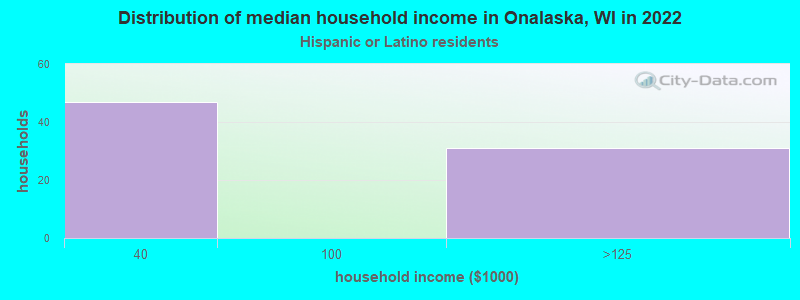
Household income for Hispanic or Latino race householders
Median age by race in Onalaska
- 43.4Median age for White residents
- 41.4Males
- 46.7Females
- 27.5Median age for Black or African American residents
- 25.8Males
- 19.9Females
- 32.9Median age for American Indian / Alaska Native residents
- 17.3Males
- 40.4Females
- 28.9Median age for Asian residents
- 24.1Males
- 33.3Females
- -825,688,072.6Median age for Native Hawaiian / Pacific Islander residents
- -666,666,666.0Males
- -732,444,443.7Females
- 49.1Median age for Other race residents
- 35.8Males
- -1,112,526,538.2Females
- 36.6Median age for Two or more races residents
- 36.1Males
- 39.2Females
- 43.0Median age for White alone residents
- 41.4Males
- 46.3Females
- 55.0Median age for Hispanic or Latino residents
- 31.9Males
- 64.7Females
Owner/renter occupied households by race in Onalaska
- House owners and renters - White residents
- 4,92464.9%Owner occupied
- 2,66635.1%Renter occupied
- House owners and renters - Black or African American residents
- 253.9%Owner occupied
- 61396.1%Renter occupied
- House owners and renters - American Indian / Alaska Native residents
- 3463.5%Owner occupied
- 2036.5%Renter occupied
- House owners and renters - Asian residents
- 19673.0%Owner occupied
- 7327.0%Renter occupied
- House owners and renters - Two or more races residents
- 17361.5%Owner occupied
- 10838.5%Renter occupied
- House owners and renters - White alone residents
- 4,84564.6%Owner occupied
- 2,65435.4%Renter occupied
- House owners and renters - Hispanic or Latino residents
- 99100.0%Owner occupied
Language usage in Onalaska
- English speakers - Total
- 90.6% of residents of Onalaska speak English at home.
- 1.7% of residents speak Spanish at home
- 14246.0%Speak English very well
- 16754.0%Speak English less than very well
- 7.4% of residents speak other language at home
- 1,10582.8%Speak English very well
- 22917.2%Speak English less than very well
- English speakers - Born in the United States
- 92.1% of residents of Onalaska speak English at home.
- 3.2% of residents speak Spanish at home
- 3522.3%Speak English very well
- 12277.7%Speak English less than very well
- 2.0% of residents speak other language at home
- 100100.0%Speak English very well
- English speakers - Native, born elsewhere
- 40.3% of residents of Onalaska speak English at home.
- 6.5% of residents speak Spanish at home
- 8100.0%Speak English very well
- 30.6% of residents speak other language at home
- 38100.0%Speak English very well
- English speakers - Foreign-born
- 13.9% of residents of Onalaska speak English at home.
- 84.4% of residents speak other language at home
- 61080.9%Speak English very well
- 14419.1%Speak English less than very well
White (Caucasian) - Speak only English
| Native: | 99.3% (14,936) |
| Foreign-born: | 36.6% (72) |
White (Caucasian) - Speak another language
| Native: | 0.7% (109) |
| Foreign-born: | 68.7% (135) |
Black or African American - Speak only English
| Native: | 44.2% (178) |
| Foreign-born: | 76.6% (15) |
Asian - Speak only English
| Native: | 23.8% (152) |
| Foreign-born: | 7.3% (49) |
Asian - Speak another language
| Native: | 45.0% (287) |
| Foreign-born: | 96.4% (649) |
White alone - Speak only English
| Native: | 99.4% (14,709) |
| Foreign-born: | 35.7% (72) |
White alone - Speak another language
| Native: | 0.6% (90) |
| Foreign-born: | 71.2% (144) |
Foreign-born residents in Onalaska
768 residents are foreign born (3.4% Asia, 0.6% Europe).
| This city: | 4.1% |
| Wisconsin: | 5.0% |


Marital status for residents in Onalaska
Marital status - White (Caucasian) population 15 years and over
- Males
- 30.9%Never married
- 57.6%Now married
- 1.4%Separated
- 3.1%Widowed
- 7.1%Divorced
- Females
- 24.4%Never married
- 47.4%Now married
- 0.3%Separated
- 15.2%Widowed
- 12.6%Divorced
Women who gave birth in the past 12 months
| Now married: | 91.5% (118) |
| Unmarried: | 8.5% (11) |
Women who did not give birth in the past 12 months
| Now married: | 43.5% (1,556) |
| Unmarried: | 56.5% (2,021) |
Marital status - Black or African American population 15 years and over
- Males
- 91.4%Never married
- 8.6%Now married
- 0.0%Separated
- 0.0%Widowed
- 0.0%Divorced
- Females
- 87.5%Never married
- 0.0%Now married
- 0.0%Separated
- 0.0%Widowed
- 12.5%Divorced
Women who gave birth in the past 12 months
| Now married: | 0.0% (0) |
| Unmarried: | 100.0% (84) |
Women who did not give birth in the past 12 months
| Now married: | 0.0% (0) |
| Unmarried: | 100.0% (40) |
Marital status - American Indian / Alaska Native population 15 years and over
- Males
- 55.6%Never married
- 44.4%Now married
- 0.0%Separated
- 0.0%Widowed
- 0.0%Divorced
- Females
- 0.0%Never married
- 100.0%Now married
- 0.0%Separated
- 0.0%Widowed
- 0.0%Divorced
Women who did not give birth in the past 12 months
| Now married: | 100.0% (49) |
| Unmarried: | 0.0% (0) |
Marital status - Asian population 15 years and over
- Males
- 39.5%Never married
- 52.1%Now married
- 5.6%Separated
- 0.0%Widowed
- 2.8%Divorced
- Females
- 23.8%Never married
- 65.8%Now married
- 0.0%Separated
- 0.0%Widowed
- 10.4%Divorced
Women who did not give birth in the past 12 months
| Now married: | 58.7% (174) |
| Unmarried: | 41.3% (122) |
Marital status - Other race population 15 years and over
- Males
- 51.9%Never married
- 17.6%Now married
- 30.5%Separated
- 0.0%Widowed
- 0.0%Divorced
- Females
- 40.2%Never married
- 59.8%Now married
- 0.0%Separated
- 0.0%Widowed
- 0.0%Divorced
Women who did not give birth in the past 12 months
| Now married: | 0.0% (0) |
| Unmarried: | 100.0% (32) |
Marital status - Two or more races population 15 years and over
- Males
- 58.6%Never married
- 41.4%Now married
- 0.0%Separated
- 0.0%Widowed
- 0.0%Divorced
- Females
- 76.8%Never married
- 23.2%Now married
- 0.0%Separated
- 0.0%Widowed
- 0.0%Divorced
Women who did not give birth in the past 12 months
| Now married: | 0.0% (0) |
| Unmarried: | 100.0% (173) |
Marital status - White alone, not Hispanic / Latino population 15 years and over
- Males
- 30.2%Never married
- 58.3%Now married
- 1.4%Separated
- 3.2%Widowed
- 6.8%Divorced
- Females
- 24.8%Never married
- 47.4%Now married
- 0.4%Separated
- 15.1%Widowed
- 12.4%Divorced
Women who gave birth in the past 12 months
| Now married: | 91.5% (117) |
| Unmarried: | 8.5% (11) |
Women who did not give birth in the past 12 months
| Now married: | 43.0% (1,498) |
| Unmarried: | 57.0% (1,987) |
Marital status - Hispanic or Latino population 15 years and over
- Males
- 59.2%Never married
- 17.7%Now married
- 14.4%Separated
- 0.0%Widowed
- 8.7%Divorced
- Females
- 18.1%Never married
- 55.4%Now married
- 0.0%Separated
- 10.9%Widowed
- 15.5%Divorced
Women who did not give birth in the past 12 months
| Now married: | 46.4% (53) |
| Unmarried: | 53.6% (61) |
Ancestries in Onalaska

- 2,37231.5%German
- 91412.1%Norwegian
- 4025.3%Irish
- 3374.5%Polish
- 2533.4%American
- 2132.8%English
- 1782.4%European
- 1391.8%Hungarian
- 821.1%Scandinavian
- 761.0%Italian
- 600.8%Syrian
- 600.8%Swedish
- 600.8%Ukrainian
- 570.8%Dutch
- 470.6%Scottish
- 290.4%West Indian
- 270.4%Croatian
- 260.3%Swiss
- 240.3%French Canadian
- 230.3%French
- 210.3%Finnish
- 190.3%Eastern European
- 180.2%Jamaican
- 170.2%Iranian
- 120.2%Nigerian
- 80.1%Scotch-Irish

Geographical mobility in Onalaska

- Same house 1 year ago
- 14,17189.4%White (Caucasian)
- 41290.5%Black or African American
- 171100.0%American Indian / Alaska Native
- 1,19198.6%Asian
- 52100.0%Native Hawaiian / Pacific Islander
- 15378.4%Other race
- 30264.9%Two or more races
- 13,92989.2%White alone, not Hispanic / Latino
- 36971.4%Hispanic or Latino

-
- Moved within same county
- 7134.5%White / Caucasian
- 408.8%Black or African American
- 3618.6%Other race
- 7916.9%Two or more races
- 7124.6%White alone, not Hispanic / Latino
- 7815.1%Hispanic or Latino

-
- Moved within same state
- 5383.4%White / Caucasian
- 121.0%Asian
- 7716.6%Two or more races
- 5453.5%White alone, not Hispanic / Latino

-
- Moved from different state
- 3982.5%White / Caucasian
- 4002.6%White alone, not Hispanic / Latino

-
- Moved from abroad
- 80.1%White
- 80.1%White alone, not Hispanic / Latino

Children Nativity (place of birth) in Onalaska
Place of birth for residents in Onalaska
![Place of birth for the foreign-born population - Regions]()
- 648Asia
- 470South Eastern Asia
- 114South Central Asia
- 103Europe
- 62Eastern Asia
- 46Eastern Europe
- 41Northern Europe
- 15China
- 15Americas
- 15Latin America
- 15Caribbean
- 14Western Europe

![Place of birth for the foreign-born population - Countries]()
- 332Laos
- 118Thailand
- 98India
- 46Ukraine
- 32Japan
- 22Scotland
- 19Philippines
- 18England
- 15Taiwan
- 15Iran
- 15Jamaica
- 14France
- 13Korea

Grandparents responsible for own grandchildren in Onalaska
Zip codes: 54650.