Races in Orland, Maine (ME) Detailed Stats
Ancestries, Foreign-born residents, place of birth

Recent posts about races in Orland, Maine on our local forum with over 2,400,000 registered users:
 | Great house in Orland (3 replies) |
| Considering moving to Maine (10 replies) |
| Alewives (17 replies) |
| Move to Belfast (20 replies) |
| Odd-Couple Retiring to Maine Summer, seek input areas (64 replies) |
| Your best memories of 2009 summer in Maine? (63 replies) |
0.9% of Orland, ME residents are foreign-born , which is 220.1% less than the foreign-born rate of 3.0% across the entire state of Maine.
Race distribution in Orland

- 2,09198.0%White alone
- 271.3%Two or more races
- 80.4%Hispanic
- 50.2%Asian alone
- 30.1%American Indian alone

2000
2022
-
- 1,230,29796.5%White alone
- 11,7310.9%Two or more races
- 9,3600.7%Hispanic
- 9,0140.7%Asian alone
- 6,4400.5%Black alone
- 6,9110.5%American Indian alone
- 8360.07%Other race alone
- 3340.03%Native Hawaiian and Other
Pacific Islander alone

-
- 1,249,23390.2%White alone
- 58,3574.2%Two or more races
- 28,7172.1%Hispanic
- 21,5831.6%Black alone
- 16,1511.2%Asian alone
- 5,8730.4%Other race alone
- 5,2050.4%American Indian alone
- 2210.02%Native Hawaiian and Other
Pacific Islander alone

Income and house value in Orland
- Median household income in 2022
- $75,009White non-Hispanic householders
- $35,651American Indian and Alaska Native householders
- $52,049Some other race householders
- $22,439Two or more races householders
- $26,540Hispanic or Latino race householders
- Median 2022 house value
- $260,324White Non-Hispanic householders
- $536,973Two or more races householders
Household income for White non-Hispanic householders

Household income for American Indian and Alaska Native householders

Household income for Two or more races householders

Household income for Hispanic or Latino race householders

Foreign-born residents in Orland
20 residents are foreign born
| This city: | 0.9% |
| Maine: | 2.9% |
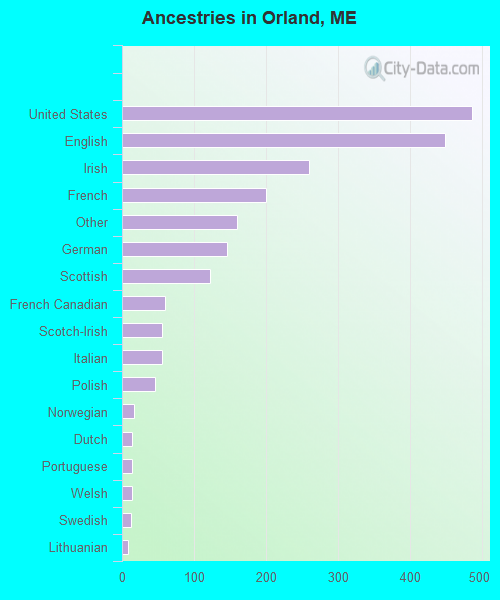
Ancestries in Orland

- 48622.8%United States
- 44921.0%English
- 26012.2%Irish
- 2009.4%French
- 1607.5%Other
- 1466.8%German
- 1225.7%Scottish
- 602.8%French Canadian
- 562.6%Scotch-Irish
- 552.6%Italian
- 462.2%Polish
- 170.8%Norwegian
- 140.7%Dutch
- 140.7%Portuguese
- 140.7%Welsh
- 120.6%Swedish
- 90.4%Lithuanian
- 40.2%Ukrainian
- 30.1%Arab
- 30.1%Hungarian
- 30.1%Russian
- 20.09%Danish
- 10.05%Czech
Zip codes: 04472.