Races in Orrington, Maine (ME) Detailed Stats
Ancestries, Foreign-born residents, place of birth

Recent posts about races in Orrington, Maine on our local forum with over 2,400,000 registered users:
 | Orrington v Veazie (maybe Brewer) Elementary schools and more! (0 replies) |
| Potential Move to Bangor (14 replies) |
| Where to live? (21 replies) |
| Orrington, Maine (14 replies) |
| Housing in Orono (34 replies) |
| questions about bangor area help please! :) (23 replies) |
2.3% of Orrington, ME residents are foreign-born (1.4% born in North America, 0.8% born in Europe), which is 30.6% less than the foreign-born rate of 3.0% across the entire state of Maine.
Race distribution in Orrington

- 3,49099.0%White alone
- 120.3%Two or more races
- 60.2%Black alone
- 80.2%Asian alone
- 50.1%Hispanic
- 40.1%American Indian alone
- 10.03%Other race alone

2000
2022
-
- 1,230,29796.5%White alone
- 11,7310.9%Two or more races
- 9,3600.7%Hispanic
- 9,0140.7%Asian alone
- 6,4400.5%Black alone
- 6,9110.5%American Indian alone
- 8360.07%Other race alone
- 3340.03%Native Hawaiian and Other
Pacific Islander alone

-
- 1,249,23390.2%White alone
- 58,3574.2%Two or more races
- 28,7172.1%Hispanic
- 21,5831.6%Black alone
- 16,1511.2%Asian alone
- 5,8730.4%Other race alone
- 5,2050.4%American Indian alone
- 2210.02%Native Hawaiian and Other
Pacific Islander alone

Income and house value in Orrington
- Median household income in 2022
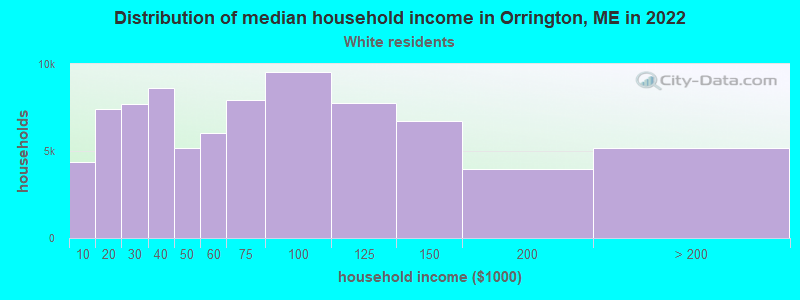
- $80,140White non-Hispanic householders
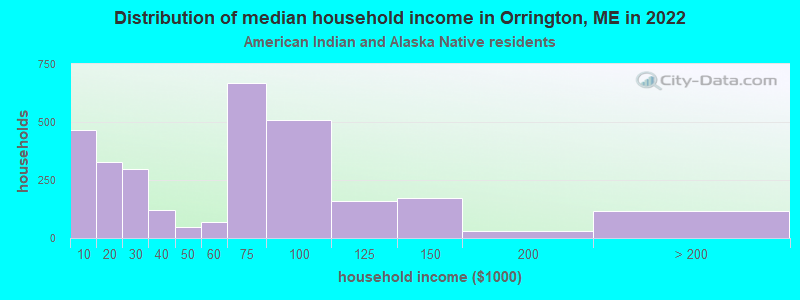
- $71,932American Indian and Alaska Native householders
- $104,002Native Hawaiian and other Pacific Islander householders
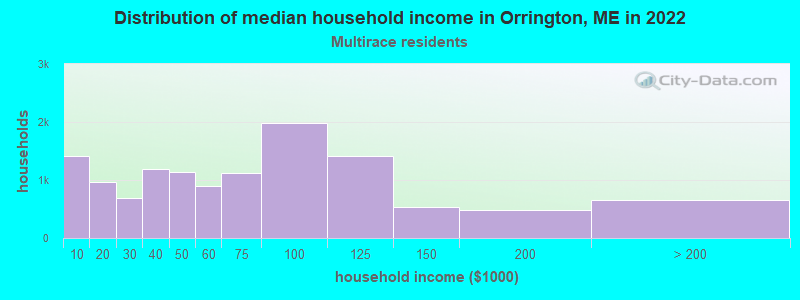
- $30,441Two or more races householders
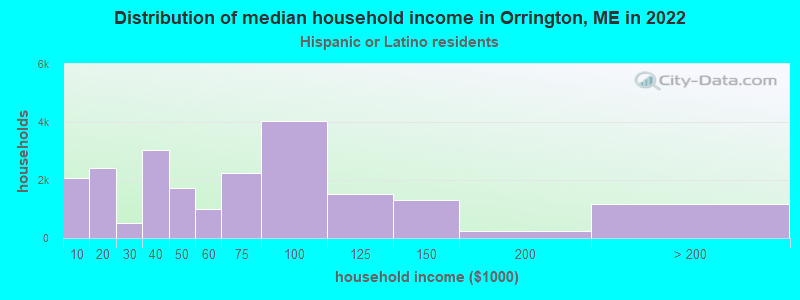
- $178,004Hispanic or Latino race householders
- Median 2022 house value
- $250,839White Non-Hispanic householders
- $195,155American Indian or Alaska Native householders
- $84,567Native Hawaiian and other Pacific Islander householders
- $231,063Two or more races householders
- $195,155Hispanic or Latino householders
Household income for White non-Hispanic householders
Household income for American Indian and Alaska Native householders
Household income for Native Hawaiian and other Pacific Islander householders

Household income for Two or more races householders
Household income for Hispanic or Latino race householders
Foreign-born residents in Orrington
81 residents are foreign born (1.4% North America, 0.8% Europe).
| This city: | 2.3% |
| Maine: | 2.9% |
Ancestries in Orrington

- 63818.2%English
- 51514.7%French
- 45112.9%Irish
- 3359.6%United States
- 2918.3%German
- 2447.0%French Canadian
- 2326.6%Scottish
- 2156.1%Other
- 1444.1%Swedish
- 1434.1%Italian
- 822.3%Scotch-Irish
- 401.1%Polish
- 320.9%Russian
- 290.8%Hungarian
- 260.7%Welsh
- 240.7%Dutch
- 240.7%Norwegian
- 140.4%Lithuanian
- 90.3%Czech
- 60.2%Arab
- 40.1%Ukrainian

Zip codes: 04474.