Races in Pace, Florida (FL) Detailed Stats
Data:
Races - White alone (%)
Races - White alone (% change since 2000)
Races - Black alone (%)
Races - Black alone (% change since 2000)
Races - American Indian alone (%)
Races - American Indian alone (% change since 2000)
Races - Asian alone (%)
Races - Asian alone (% change since 2000)
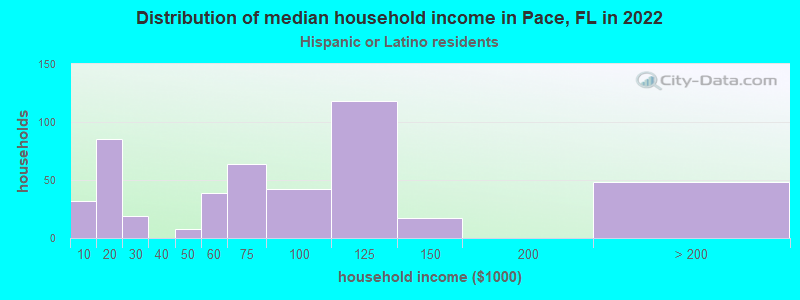
Races - Hispanic (%)
Races - Hispanic (% change since 2000)
Races - Native Hawaiian and Other Pacific Islander alone (%)
Races - Native Hawaiian and Other Pacific Islander alone (% change since 2000)
Races - Two or more races(%)
Races - Two or more races(% change since 2000)
Races - Other race alone (%)
Races - Other race alone (% change since 2000)
Racial diversity
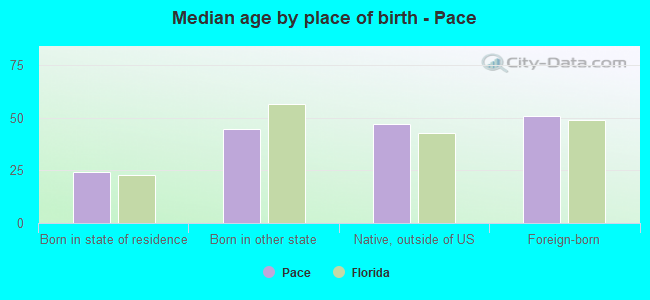
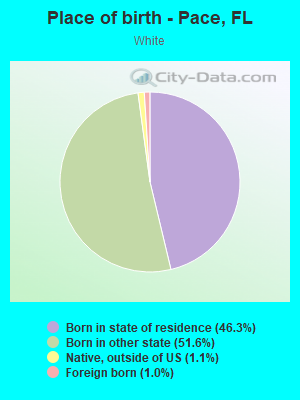
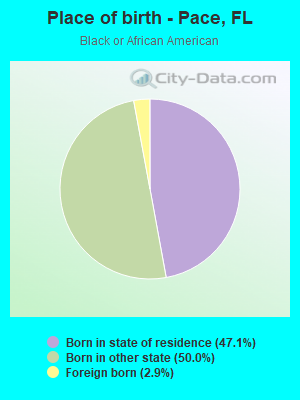
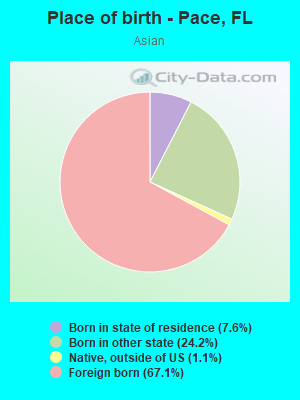
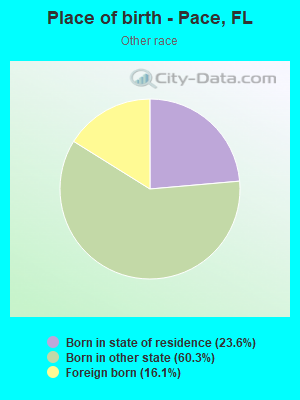
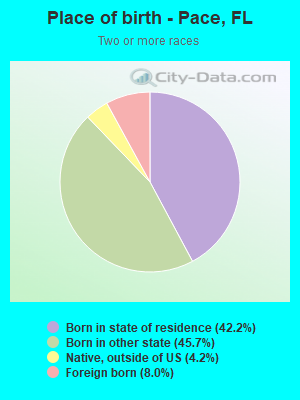
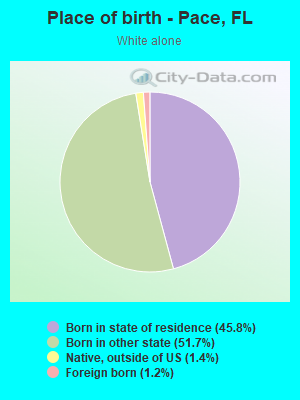
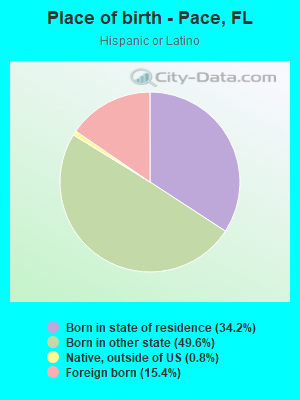
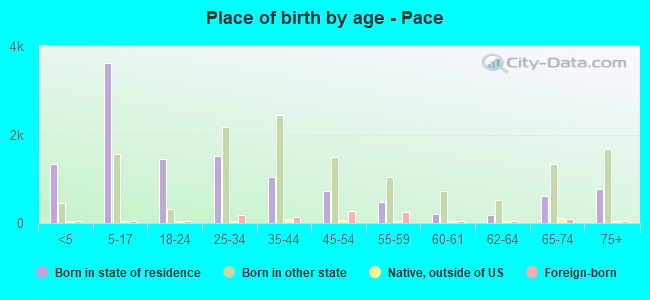
Place of birth - Born in state of residence (%)
Place of birth - Born in state of residence (%) - White
Place of birth - Born in state of residence (%) - Black or African American
Place of birth - Born in state of residence (%) - Asian
Place of birth - Born in state of residence (%) - Hispanic or Latino
Place of birth - Born in state of residence (%) - American Indian and Alaska Native
Place of birth - Born in state of residence (%) - Multirace
Place of birth - Born in state of residence (%) - Other Race
Place of birth - Born in other state (%)
Place of birth - Born in other state (%) - White
Place of birth - Born in other state (%) - Black or African American
Place of birth - Born in other state (%) - Asian
Place of birth - Born in other state (%) - Hispanic or Latino
Place of birth - Born in other state (%) - American Indian and Alaska Native
Place of birth - Born in other state (%) - Multirace
Place of birth - Born in other state (%) - Other Race
Place of birth - Native, outside of US (%)
Place of birth - Native, outside of US (%) - White
Place of birth - Native, outside of US (%) - Black or African American
Place of birth - Native, outside of US (%) - Asian
Place of birth - Native, outside of US (%) - Hispanic or Latino
Place of birth - Native, outside of US (%) - American Indian and Alaska Native
Place of birth - Native, outside of US (%) - Multirace
Place of birth - Native, outside of US (%) - Other Race
Place of birth - Foreign born (%)
Place of birth - Foreign born (%) - White
Place of birth - Foreign born (%) - Black or African American
Place of birth - Foreign born (%) - Asian
Place of birth - Foreign born (%) - Hispanic or Latino
Place of birth - Foreign born (%) - American Indian and Alaska Native
Place of birth - Foreign born (%) - Multirace
Place of birth - Foreign born (%) - Other Race
Residents speaking English at home (%)
Residents speaking English at home - Born in the United States (%)
Residents speaking English at home - Native, born elsewhere (%)
Residents speaking English at home - Foreign born (%)
Residents speaking Spanish at home (%)
Residents speaking Spanish at home - Born in the United States (%)
Residents speaking Spanish at home - Native, born elsewhere (%)
Residents speaking Spanish at home - Foreign born (%)
Residents speaking other language at home (%)
Residents speaking other language at home - Born in the United States (%)
Residents speaking other language at home - Native, born elsewhere (%)
Residents speaking other language at home - Foreign born (%)
Marital status - Never married (%)
Marital status - Now married (%)
Marital status - Separated (%)
Marital status - Widowed (%)
Marital status - Divorced (%)
Ancestries Reported - Arab (%)
Ancestries Reported - Czech (%)
Ancestries Reported - Danish (%)
Ancestries Reported - Dutch (%)
Ancestries Reported - English (%)
Ancestries Reported - French (%)
Ancestries Reported - French Canadian (%)
Ancestries Reported - German (%)
Ancestries Reported - Greek (%)
Ancestries Reported - Hungarian (%)
Ancestries Reported - Irish (%)
Ancestries Reported - Italian (%)
Ancestries Reported - Lithuanian (%)
Ancestries Reported - Norwegian (%)
Ancestries Reported - Polish (%)
Ancestries Reported - Portuguese (%)
Ancestries Reported - Russian (%)
Ancestries Reported - Scotch-Irish (%)
Ancestries Reported - Scottish (%)
Ancestries Reported - Slovak (%)
Ancestries Reported - Subsaharan African (%)
Ancestries Reported - Swedish (%)
Ancestries Reported - Swiss (%)
Ancestries Reported - Ukrainian (%)
Ancestries Reported - United States (%)
Ancestries Reported - Welsh (%)
Ancestries Reported - West Indian (%)
Ancestries Reported - Other (%)
Geographical mobility - Same house 1 year ago (%)
Geographical mobility - Same house 1 year ago (%) - White
Geographical mobility - Same house 1 year ago (%) - Black or African American
Geographical mobility - Same house 1 year ago (%) - Asian
Geographical mobility - Same house 1 year ago (%) - Hispanic or Latino
Geographical mobility - Same house 1 year ago (%) - American Indian and Alaska Native
Geographical mobility - Same house 1 year ago (%) - Multirace
Geographical mobility - Same house 1 year ago (%) - Other Race
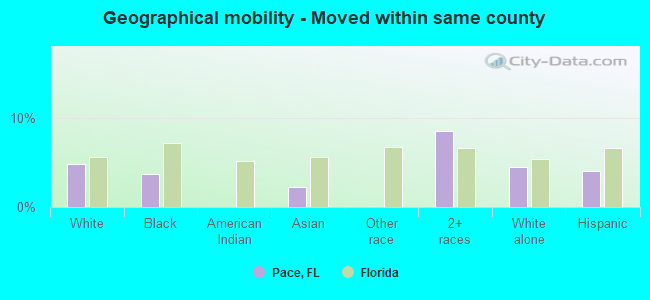
Geographical mobility - Moved within same county (%)
Geographical mobility - Moved within same county (%) - White
Geographical mobility - Moved within same county (%) - Black or African American
Geographical mobility - Moved within same county (%) - Asian
Geographical mobility - Moved within same county (%) - Hispanic or Latino
Geographical mobility - Moved within same county (%) - American Indian and Alaska Native
Geographical mobility - Moved within same county (%) - Multirace
Geographical mobility - Moved within same county (%) - Other Race
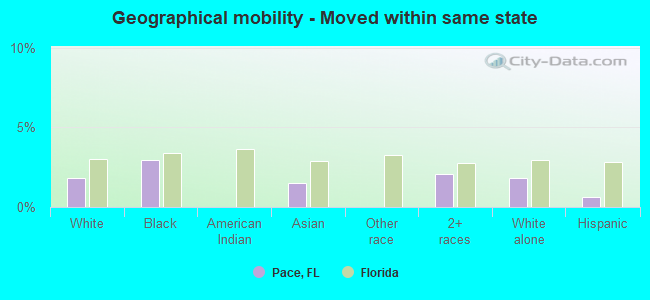
Geographical mobility - Moved from different county within same state (%)
Geographical mobility - Moved from different county within same state (%) - White
Geographical mobility - Moved from different county within same state (%) - Black or African American
Geographical mobility - Moved from different county within same state (%) - Asian
Geographical mobility - Moved from different county within same state (%) - Hispanic or Latino
Geographical mobility - Moved from different county within same state (%) - American Indian and Alaska Native
Geographical mobility - Moved from different county within same state (%) - Multirace
Geographical mobility - Moved from different county within same state (%) - Other Race
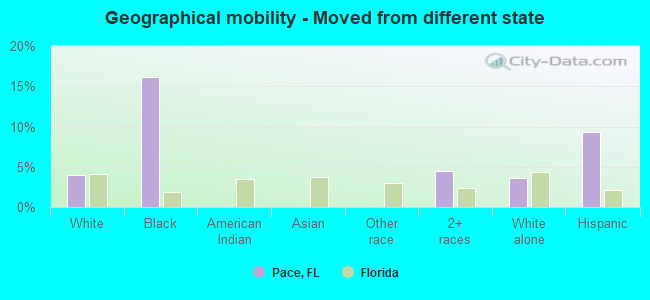
Geographical mobility - Moved from different state (%)
Geographical mobility - Moved from different state (%) - White
Geographical mobility - Moved from different state (%) - Black or African American
Geographical mobility - Moved from different state (%) - Asian
Geographical mobility - Moved from different state (%) - Hispanic or Latino
Geographical mobility - Moved from different state (%) - American Indian and Alaska Native
Geographical mobility - Moved from different state (%) - Multirace
Geographical mobility - Moved from different state (%) - Other Race
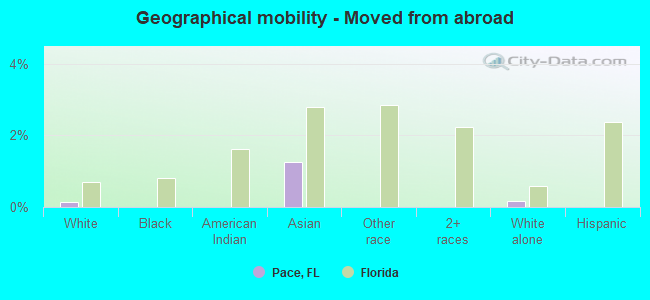
Geographical mobility - Moved from abroad (%)
Geographical mobility - Moved from abroad (%) - White
Geographical mobility - Moved from abroad (%) - Black or African American
Geographical mobility - Moved from abroad (%) - Asian
Geographical mobility - Moved from abroad (%) - Hispanic or Latino
Geographical mobility - Moved from abroad (%) - American Indian and Alaska Native
Geographical mobility - Moved from abroad (%) - Multirace
Geographical mobility - Moved from abroad (%) - Other Race
Place of birth for the foreign-born population - Ireland (%)
Place of birth for the foreign-born population - Denmark (%)
Place of birth for the foreign-born population - Norway (%)
Place of birth for the foreign-born population - Sweden (%)
Place of birth for the foreign-born population - United Kingdom (%)
Place of birth for the foreign-born population - England (%)
Place of birth for the foreign-born population - Scotland (%)
Place of birth for the foreign-born population - Other Northern Europe (%)
Place of birth for the foreign-born population - Austria (%)
Place of birth for the foreign-born population - Belgium (%)
Place of birth for the foreign-born population - France (%)
Place of birth for the foreign-born population - Germany (%)
Place of birth for the foreign-born population - Netherlands (%)
Place of birth for the foreign-born population - Switzerland (%)
Place of birth for the foreign-born population - Other Western Europe (%)
Place of birth for the foreign-born population - Greece (%)
Place of birth for the foreign-born population - Italy (%)
Place of birth for the foreign-born population - Portugal (%)
Place of birth for the foreign-born population - Spain (%)
Place of birth for the foreign-born population - Other Southern Europe (%)
Place of birth for the foreign-born population - Albania (%)
Place of birth for the foreign-born population - Belarus (%)
Place of birth for the foreign-born population - Bosnia and Herzegovina (%)
Place of birth for the foreign-born population - Bulgaria (%)
Place of birth for the foreign-born population - Croatia (%)
Place of birth for the foreign-born population - Czechoslovakia (%)
Place of birth for the foreign-born population - Hungary (%)
Place of birth for the foreign-born population - Latvia (%)
Place of birth for the foreign-born population - Lithuania (%)
Place of birth for the foreign-born population - North Macedonia (Macedonia) (%)
Place of birth for the foreign-born population - Moldova (%)
Place of birth for the foreign-born population - Poland (%)
Place of birth for the foreign-born population - Romania (%)
Place of birth for the foreign-born population - Russia (%)
Place of birth for the foreign-born population - Serbia (%)
Place of birth for the foreign-born population - Ukraine (%)
Place of birth for the foreign-born population - Other Eastern Europe (%)
Place of birth for the foreign-born population - China (%)
Place of birth for the foreign-born population - Hong Kong (%)
Place of birth for the foreign-born population - Taiwan (%)
Place of birth for the foreign-born population - Japan (%)
Place of birth for the foreign-born population - Korea (%)
Place of birth for the foreign-born population - Other Eastern Asia (%)
Place of birth for the foreign-born population - Afghanistan (%)
Place of birth for the foreign-born population - Bangladesh (%)
Place of birth for the foreign-born population - India (%)
Place of birth for the foreign-born population - Iran (%)
Place of birth for the foreign-born population - Kazakhstan (%)
Place of birth for the foreign-born population - Nepal (%)
Place of birth for the foreign-born population - Pakistan (%)
Place of birth for the foreign-born population - Sri Lanka (%)
Place of birth for the foreign-born population - Uzbekistan (%)
Place of birth for the foreign-born population - Other South Central Asia (%)
Place of birth for the foreign-born population - Burma (%)
Place of birth for the foreign-born population - Cambodia (%)
Place of birth for the foreign-born population - Indonesia (%)
Place of birth for the foreign-born population - Laos (%)
Place of birth for the foreign-born population - Malaysia (%)
Place of birth for the foreign-born population - Philippines (%)
Place of birth for the foreign-born population - Singapore (%)
Place of birth for the foreign-born population - Thailand (%)
Place of birth for the foreign-born population - Vietnam (%)
Place of birth for the foreign-born population - Other South Eastern Asia (%)
Place of birth for the foreign-born population - Armenia (%)
Place of birth for the foreign-born population - Iraq (%)
Place of birth for the foreign-born population - Israel (%)
Place of birth for the foreign-born population - Jordan (%)
Place of birth for the foreign-born population - Kuwait (%)
Place of birth for the foreign-born population - Lebanon (%)
Place of birth for the foreign-born population - Saudi Arabia (%)
Place of birth for the foreign-born population - Syria (%)
Place of birth for the foreign-born population - Turkey (%)
Place of birth for the foreign-born population - Yemen (%)
Place of birth for the foreign-born population - Other Western Asia (%)
Place of birth for the foreign-born population - Eritrea (%)
Place of birth for the foreign-born population - Ethiopia (%)
Place of birth for the foreign-born population - Kenya (%)
Place of birth for the foreign-born population - Somalia (%)
Place of birth for the foreign-born population - Uganda (%)
Place of birth for the foreign-born population - Zimbabwe (%)
Place of birth for the foreign-born population - Other Eastern Africa (%)
Place of birth for the foreign-born population - Cameroon (%)
Place of birth for the foreign-born population - Congo (%)
Place of birth for the foreign-born population - Democratic Republic of Congo (Zaire) (%)
Place of birth for the foreign-born population - Other Middle Africa (%)
Place of birth for the foreign-born population - Egypt (%)
Place of birth for the foreign-born population - Morocco (%)
Place of birth for the foreign-born population - Sudan (%)
Place of birth for the foreign-born population - Other Northern Africa (%)
Place of birth for the foreign-born population - South Africa (%)
Place of birth for the foreign-born population - Other Southern Africa (%)
Place of birth for the foreign-born population - Cabo Verde (%)
Place of birth for the foreign-born population - Ghana (%)
Place of birth for the foreign-born population - Liberia (%)
Place of birth for the foreign-born population - Nigeria (%)
Place of birth for the foreign-born population - Senegal (%)
Place of birth for the foreign-born population - Sierra Leone (%)
Place of birth for the foreign-born population - Other Western Africa (%)
Place of birth for the foreign-born population - Australia (%)
Place of birth for the foreign-born population - New Zealand (%)
Place of birth for the foreign-born population - Fiji (%)
Place of birth for the foreign-born population - Micronesia (%)
Place of birth for the foreign-born population - Bahamas (%)
Place of birth for the foreign-born population - Barbados (%)
Place of birth for the foreign-born population - Cuba (%)
Place of birth for the foreign-born population - Dominica (%)
Place of birth for the foreign-born population - Dominican Republic (%)
Place of birth for the foreign-born population - Grenada (%)
Place of birth for the foreign-born population - Haiti (%)
Place of birth for the foreign-born population - Jamaica (%)
Place of birth for the foreign-born population - St. Vincent and the Grenadines (%)
Place of birth for the foreign-born population - Trinidad and Tobago (%)
Place of birth for the foreign-born population - West Indies (%)
Place of birth for the foreign-born population - Other Caribbean (%)
Place of birth for the foreign-born population - Belize (%)
Place of birth for the foreign-born population - Costa Rica (%)
Place of birth for the foreign-born population - El Salvador (%)
Place of birth for the foreign-born population - Guatemala (%)
Place of birth for the foreign-born population - Honduras (%)
Place of birth for the foreign-born population - Mexico (%)
Place of birth for the foreign-born population - Nicaragua (%)
Place of birth for the foreign-born population - Panama (%)
Place of birth for the foreign-born population - Other Central America (%)
Place of birth for the foreign-born population - Argentina (%)
Place of birth for the foreign-born population - Bolivia (%)
Place of birth for the foreign-born population - Brazil (%)
Place of birth for the foreign-born population - Chile (%)
Place of birth for the foreign-born population - Colombia (%)
Place of birth for the foreign-born population - Ecuador (%)
Place of birth for the foreign-born population - Guyana (%)
Place of birth for the foreign-born population - Peru (%)
Place of birth for the foreign-born population - Uruguay (%)
Place of birth for the foreign-born population - Venezuela (%)
Place of birth for the foreign-born population - Other South America (%)
Place of birth for the foreign-born population - Canada (%)
Place of birth for the foreign-born population - Other Northern America (%)
Place of birth for the foreign-born population - Other (%)
Latest news about races in Pace, FL collected exclusively by city-data.com from local newspapers, TV, and radio stations
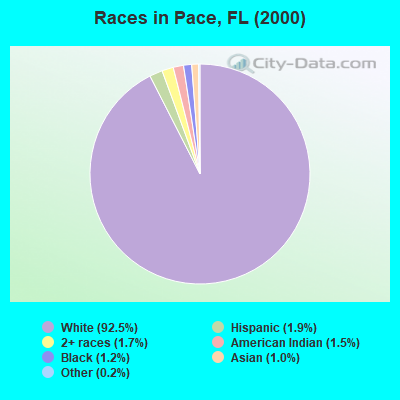
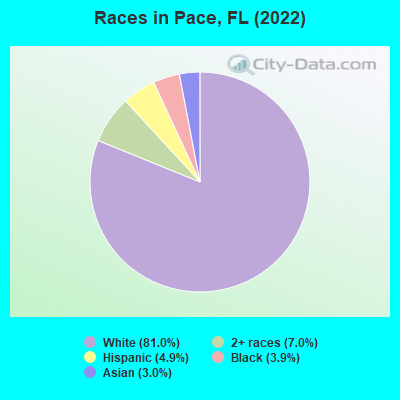
According to 2022 data, the most numerous races in Pace, FL are White alone (21,800 residents), Hispanic (1,312 residents), and Black alone (1,042 residents). 94.8% of Pace residents speak English at home. 4.6% of Pace, FL residents are foreign-born (1.9% born in Asia, 1.2% born in Europe, 1.0% born in Latin America), which is 354.0% less than the foreign-born rate of 21.0% across the entire state of Florida.
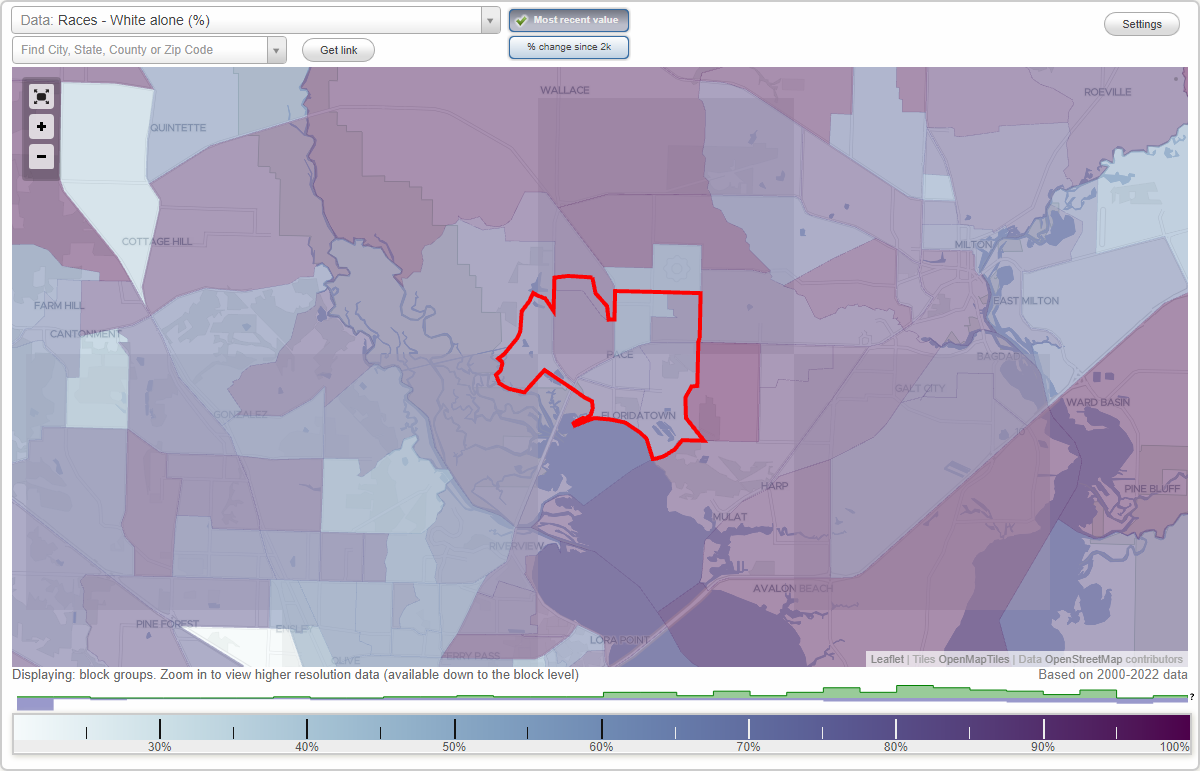
Race distribution in Pace
2000 2022
10,458,509 65.4% White alone 2,682,715 16.8% Hispanic 2,264,268 14.2% Black alone 261,693 1.6% Asian alone 236,954 1.5% Two or more races 42,358 0.3% American Indian alone 28,994 0.2% Other race alone 6,887 0.04% Native Hawaiian and Other
11,309,403 50.8% White alone 6,025,039 27.1% Hispanic 3,241,015 14.6% Black alone 861,630 3.9% Two or more races 623,692 2.8% Asian alone 152,054 0.7% Other race alone 22,504 0.1% American Indian alone 9,486 0.04% Native Hawaiian and Other
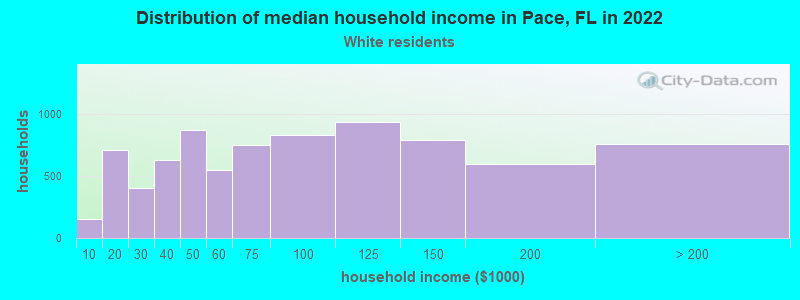
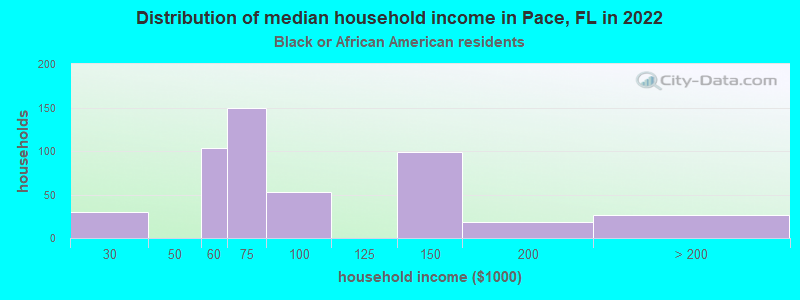
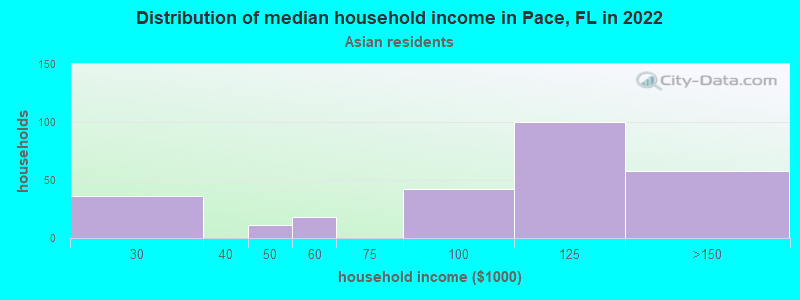
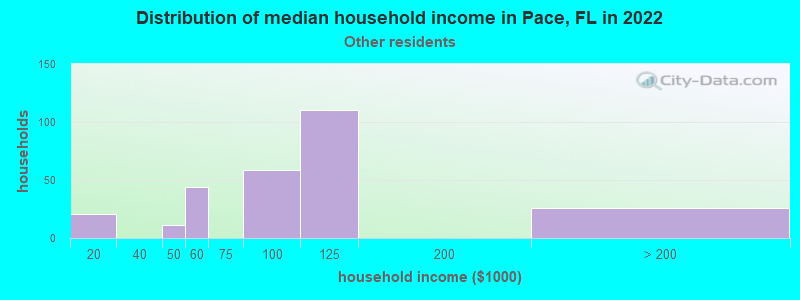
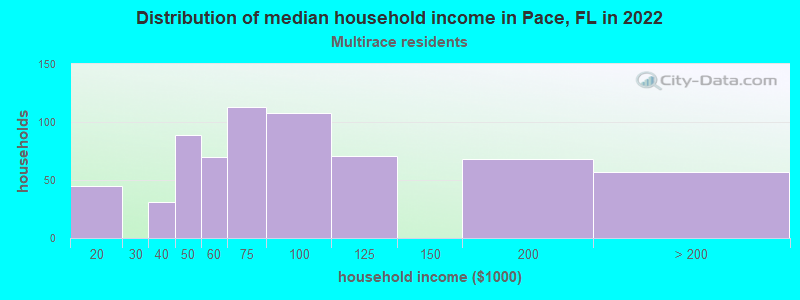
Income and house value in Pace Median household income in 2022 $75,760 White non-Hispanic householders$71,145 Black householders$127,361 Asian householders$97,998 Some other race householders$57,066 Two or more races householders$60,355 Hispanic or Latino race householdersMedian 2022 house value $301,228 White Non-Hispanic householders$394,508 American Indian or Alaska Native householders $505,321 Asian householders$157,803 Native Hawaiian and other Pacific Islander householders$394,508 Some other race householders$290,358 Two or more races householders$373,467 Hispanic or Latino householders
Median age by race in Pace
37.0 Median age for White residents34.2 39.0 37.8 Median age for Black or African American residents36.6 40.6 -930,120,481.0 Median age for American Indian / Alaska Native residents-1,057,851,238.6 -859,386,151.9 40.6 Median age for Asian residents37.5 39.4 -679,849,340.2 Median age for Native Hawaiian / Pacific Islander residents-858,307,848.3 -443,298,968.6 37.9 Median age for Other race residents51.5 26.4 36.0 Median age for Two or more races residents27.5 44.7 37.4 Median age for White alone residents34.8 39.4 34.9 Median age for Hispanic or Latino residents41.0 29.6
Owner/renter occupied households by race in Pace
House owners and renters - White residents 6,704 84.8% Owner occupied1,200 15.2% Renter occupiedHouse owners and renters - Black or African American residents 353 80.3% Owner occupied86 19.7% Renter occupiedHouse owners and renters - Asian residents 283 100.0% Owner occupiedHouse owners and renters - Other race residents 189 47.2% Owner occupied211 52.8% Renter occupiedHouse owners and renters - Two or more races residents 517 86.4% Owner occupied82 13.6% Renter occupiedHouse owners and renters - White alone residents 6,623 85.4% Owner occupied1,130 14.6% Renter occupiedHouse owners and renters - Hispanic or Latino residents 315 61.1% Owner occupied201 38.9% Renter occupied
Language usage in Pace
English speakers - Total 94.8% of residents of Pace speak English at home.
1.9% of residents speak Spanish at home 344 73.0% Speak English very well127 27.0% Speak English less than very well2.9% of residents speak other language at home 560 76.9% Speak English very well168 23.1% Speak English less than very well
English speakers - Born in the United States 97.4% of residents of Pace speak English at home.
2.5% of residents speak Spanish at home 165 51.1% Speak English very well158 48.9% Speak English less than very well0.5% of residents speak other language at home 59 100.0% Speak English very well
English speakers - Native, born elsewhere 99.4% of residents of Pace speak English at home.
2.8% of residents speak Spanish at home 10 100.0% Speak English less than very well
English speakers - Foreign-born 26.8% of residents of Pace speak English at home.
14.1% of residents speak Spanish at home 71 47.0% Speak English very well80 53.0% Speak English less than very well51.6% of residents speak other language at home 398 71.8% Speak English very well156 28.2% Speak English less than very well
White (Caucasian) - Speak only English Native:
99.3% (20,283)Foreign-born:
57.6% (130)
White (Caucasian) - Speak another language Native:
0.9% (182)Foreign-born:
43.1% (97)
Black or African American - Speak another language Native:
5.4% (45)Foreign-born:
100.0% (55)
Asian - Speak only English Native:
100.0% (206)Foreign-born:
23.4% (113)
Other race - Speak another language Native:
69.9% (307)Foreign-born:
100.0% (185)
Two or more races - Speak only English Native:
95.3% (1,955)Foreign-born:
26.6% (47)
Two or more races - Speak another language Native:
4.3% (88)Foreign-born:
77.0% (136)
White alone - Speak only English Native:
98.9% (19,782)Foreign-born:
54.3% (139)
White alone - Speak another language Native:
0.9% (189)Foreign-born:
45.8% (117)
Hispanic or Latino - Speak another language Native:
15.3% (156)Foreign-born:
74.3% (159)
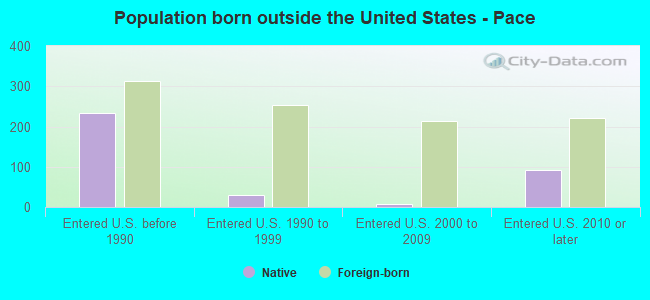
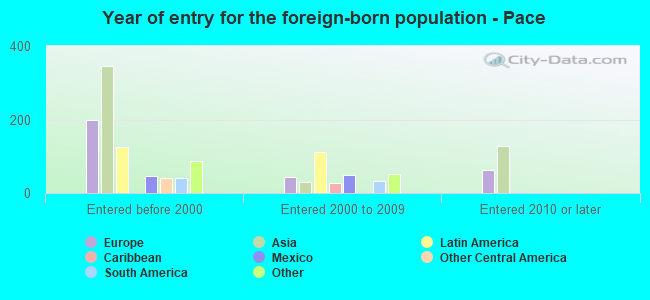
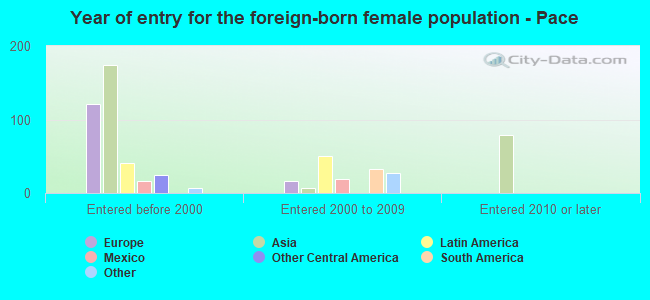
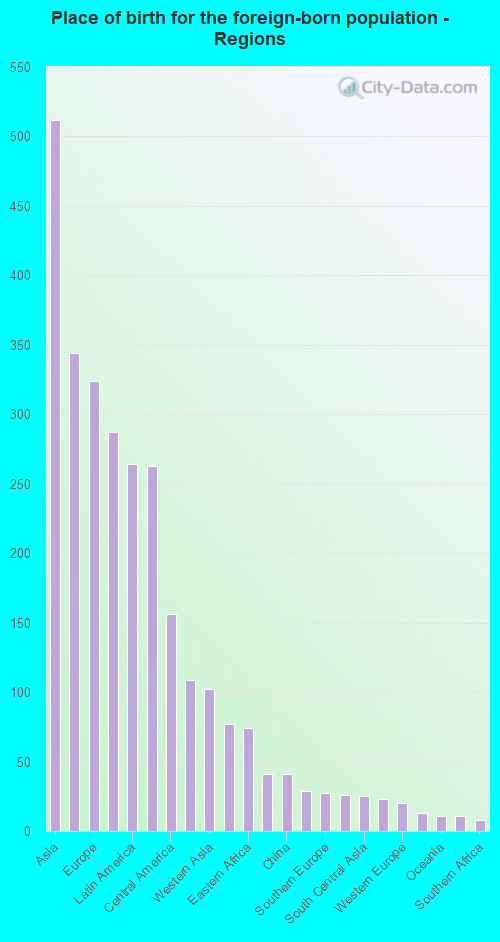
Foreign-born residents in Pace 1,245 residents are foreign born (1.9% Asia , 1.2% Europe , 1.0% Latin America ).
This city:
4.6%Florida:
21.1%
Marital status for residents in Pace Marital status - White (Caucasian) population 15 years and over
Males 22.2% Never married62.1% Now married0.2% Separated1.8% Widowed13.7% DivorcedFemales 21.0% Never married55.6% Now married1.0% Separated10.4% Widowed12.0% DivorcedWomen who gave birth in the past 12 months Now married:
40.6% (165)Unmarried:
59.4% (241)
Women who did not give birth in the past 12 months Now married:
56.0% (2,366)Unmarried:
44.0% (1,861)
Marital status - Black or African American population 15 years and over
Males 9.3% Never married49.3% Now married0.0% Separated0.0% Widowed41.4% DivorcedFemales 20.1% Never married36.3% Now married3.6% Separated40.1% Widowed0.0% DivorcedWomen who gave birth in the past 12 months Now married:
68.4% (66)Unmarried:
31.6% (31)
Women who did not give birth in the past 12 months Now married:
60.4% (63)Unmarried:
39.6% (42)
Marital status - Asian population 15 years and over
Males 4.6% Never married88.3% Now married0.0% Separated0.0% Widowed7.1% DivorcedFemales 31.8% Never married62.4% Now married0.0% Separated5.8% Widowed0.0% DivorcedWomen who did not give birth in the past 12 months Now married:
44.1% (81)Unmarried:
55.9% (102)
Marital status - Other race population 15 years and over
Males 20.1% Never married45.1% Now married0.0% Separated0.0% Widowed34.8% DivorcedFemales 47.8% Never married52.2% Now married0.0% Separated0.0% Widowed0.0% DivorcedWomen who did not give birth in the past 12 months Now married:
52.2% (139)Unmarried:
47.8% (128)
Marital status - Two or more races population 15 years and over
Males 55.5% Never married24.4% Now married0.0% Separated0.0% Widowed20.2% DivorcedFemales 21.8% Never married46.4% Now married0.0% Separated16.3% Widowed15.5% DivorcedWomen who gave birth in the past 12 months Now married:
100.0% (17)Unmarried:
0.0% (0)
Women who did not give birth in the past 12 months Now married:
56.2% (263)Unmarried:
43.8% (205)
Marital status - White alone, not Hispanic / Latino population 15 years and over
Males 22.3% Never married61.9% Now married0.2% Separated1.7% Widowed13.9% DivorcedFemales 20.7% Never married56.1% Now married0.7% Separated10.4% Widowed12.2% DivorcedWomen who gave birth in the past 12 months Now married:
40.6% (164)Unmarried:
59.4% (240)
Women who did not give birth in the past 12 months Now married:
56.2% (2,300)Unmarried:
43.8% (1,791)
Marital status - Hispanic or Latino population 15 years and over
Males 20.9% Never married59.6% Now married0.0% Separated2.0% Widowed17.5% DivorcedFemales 30.7% Never married45.9% Now married6.3% Separated3.8% Widowed13.3% DivorcedWomen who gave birth in the past 12 months Now married:
100.0% (19)Unmarried:
0.0% (0)
Women who did not give birth in the past 12 months Now married:
48.8% (225)Unmarried:
51.2% (236)
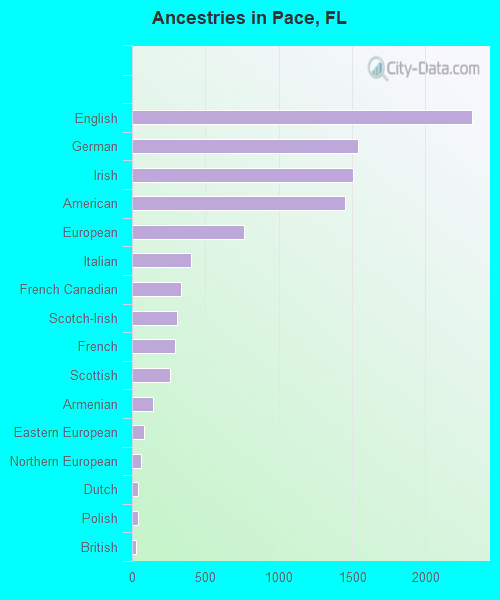
Ancestries in Pace
2,318 17.3% English1,538 11.5% German1,507 11.3% Irish1,449 10.8% American762 5.7% European399 3.0% Italian332 2.5% French Canadian310 2.3% Scotch-Irish295 2.2% French256 1.9% Scottish145 1.1% Armenian82 0.6% Eastern European58 0.4% Northern European44 0.3% Dutch44 0.3% Polish27 0.2% British19 0.1% Scandinavian16 0.1% Swedish16 0.1% Welsh14 0.1% South African13 0.10% Cajun13 0.10% Czech12 0.09% Canadian10 0.07% Greek10 0.07% Pennsylvania German9 0.07% Czechoslovakian9 0.07% Norwegian8 0.06% Danish
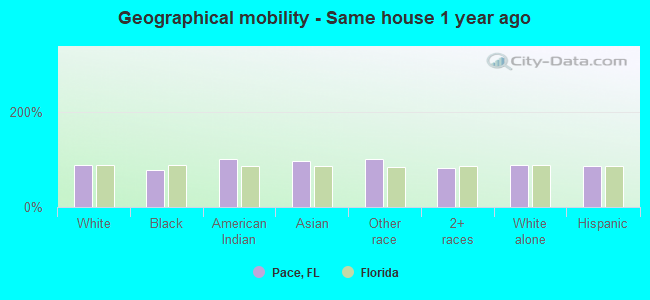
Geographical mobility in Pace Same house 1 year ago 19,562 89.2% White (Caucasian)748 77.9% Black or African American5 100.0% American Indian / Alaska Native687 95.8% Asian665 100.0% Other race1,809 81.6% Two or more races19,288 89.5% White alone, not Hispanic / Latino1,123 85.7% Hispanic or LatinoMoved within same county 1,045 4.8% White / Caucasian35 3.7% Black or African American16 2.2% Asian189 8.5% Two or more races974 4.5% White alone, not Hispanic / Latino53 4.0% Hispanic or LatinoMoved within same state 394 1.8% White / Caucasian28 2.9% Black or African American11 1.5% Asian46 2.1% Two or more races389 1.8% White alone, not Hispanic / Latino9 0.7% Hispanic or LatinoMoved from different state 867 4.0% White / Caucasian155 16.2% Black or African American99 4.5% Two or more races784 3.6% White alone, not Hispanic / Latino122 9.3% Hispanic or LatinoMoved from abroad 29 0.1% White9 1.3% Asian34 0.2% White alone, not Hispanic / Latino
Children Nativity (place of birth) in Pace
Children under 6 years - Living with two parents Both parents native 1,327 100.0% NativeBoth parents foreign-born 73 100.0% NativeOne native, one foreign-born parent 28 100.0% NativeChildren under 6 years - Living with one parent Native parent 642 100.0% NativeForeign-born parent 27 100.0% NativeChildren 6 to 17 years - Living with two parents Both parents native 3,003 100.0% NativeBoth parents foreign-born 184 95.4% Native9 4.6% Foreign-bornOne native, one foreign-born parent 221 100.0% NativeChildren 6 to 17 years - Living with one parent Native parent 814 100.0% NativeForeign-born parent 69 50.6% Native68 49.4% Foreign-born
Grandparents responsible for own grandchildren in Pace
Grandparents (30 to 59 years) White / Caucasian 80 76.1% Responsible for grandchildren25 23.9% Not responsible for grandchildrenWhite alone, not Hispanic / Latino 80 75.5% Responsible for grandchildren26 24.5% Not responsible for grandchildrenGrandparents (60 years and over) White / Caucasian 193 45.3% Responsible for grandchildren232 54.7% Not responsible for grandchildrenWhite alone, not Hispanic / Latino 196 44.2% Responsible for grandchildren248 55.8% Not responsible for grandchildren