Races in Pass Christian, Mississippi (MS) Detailed Stats
Data:
Races - White alone (%)
Races - White alone (% change since 2000)
Races - Black alone (%)
Races - Black alone (% change since 2000)
Races - American Indian alone (%)
Races - American Indian alone (% change since 2000)
Races - Asian alone (%)
Races - Asian alone (% change since 2000)
Races - Hispanic (%)
Races - Hispanic (% change since 2000)
Races - Native Hawaiian and Other Pacific Islander alone (%)
Races - Native Hawaiian and Other Pacific Islander alone (% change since 2000)
Races - Two or more races(%)
Races - Two or more races(% change since 2000)
Races - Other race alone (%)
Races - Other race alone (% change since 2000)
Racial diversity
Place of birth - Born in state of residence (%)
Place of birth - Born in state of residence (%) - White
Place of birth - Born in state of residence (%) - Black or African American
Place of birth - Born in state of residence (%) - Asian
Place of birth - Born in state of residence (%) - Hispanic or Latino
Place of birth - Born in state of residence (%) - American Indian and Alaska Native
Place of birth - Born in state of residence (%) - Multirace
Place of birth - Born in state of residence (%) - Other Race
Place of birth - Born in other state (%)
Place of birth - Born in other state (%) - White
Place of birth - Born in other state (%) - Black or African American
Place of birth - Born in other state (%) - Asian
Place of birth - Born in other state (%) - Hispanic or Latino
Place of birth - Born in other state (%) - American Indian and Alaska Native
Place of birth - Born in other state (%) - Multirace
Place of birth - Born in other state (%) - Other Race
Place of birth - Native, outside of US (%)
Place of birth - Native, outside of US (%) - White
Place of birth - Native, outside of US (%) - Black or African American
Place of birth - Native, outside of US (%) - Asian
Place of birth - Native, outside of US (%) - Hispanic or Latino
Place of birth - Native, outside of US (%) - American Indian and Alaska Native
Place of birth - Native, outside of US (%) - Multirace
Place of birth - Native, outside of US (%) - Other Race
Place of birth - Foreign born (%)
Place of birth - Foreign born (%) - White
Place of birth - Foreign born (%) - Black or African American
Place of birth - Foreign born (%) - Asian
Place of birth - Foreign born (%) - Hispanic or Latino
Place of birth - Foreign born (%) - American Indian and Alaska Native
Place of birth - Foreign born (%) - Multirace
Place of birth - Foreign born (%) - Other Race
Residents speaking English at home (%)
Residents speaking English at home - Born in the United States (%)
Residents speaking English at home - Native, born elsewhere (%)
Residents speaking English at home - Foreign born (%)
Residents speaking Spanish at home (%)
Residents speaking Spanish at home - Born in the United States (%)
Residents speaking Spanish at home - Native, born elsewhere (%)
Residents speaking Spanish at home - Foreign born (%)
Residents speaking other language at home (%)
Residents speaking other language at home - Born in the United States (%)
Residents speaking other language at home - Native, born elsewhere (%)
Residents speaking other language at home - Foreign born (%)
Marital status - Never married (%)
Marital status - Now married (%)
Marital status - Separated (%)
Marital status - Widowed (%)
Marital status - Divorced (%)
Ancestries Reported - Arab (%)
Ancestries Reported - Czech (%)
Ancestries Reported - Danish (%)
Ancestries Reported - Dutch (%)
Ancestries Reported - English (%)
Ancestries Reported - French (%)
Ancestries Reported - French Canadian (%)
Ancestries Reported - German (%)
Ancestries Reported - Greek (%)
Ancestries Reported - Hungarian (%)
Ancestries Reported - Irish (%)
Ancestries Reported - Italian (%)
Ancestries Reported - Lithuanian (%)
Ancestries Reported - Norwegian (%)
Ancestries Reported - Polish (%)
Ancestries Reported - Portuguese (%)
Ancestries Reported - Russian (%)
Ancestries Reported - Scotch-Irish (%)
Ancestries Reported - Scottish (%)
Ancestries Reported - Slovak (%)
Ancestries Reported - Subsaharan African (%)
Ancestries Reported - Swedish (%)
Ancestries Reported - Swiss (%)
Ancestries Reported - Ukrainian (%)
Ancestries Reported - United States (%)
Ancestries Reported - Welsh (%)
Ancestries Reported - West Indian (%)
Ancestries Reported - Other (%)
Geographical mobility - Same house 1 year ago (%)
Geographical mobility - Same house 1 year ago (%) - White
Geographical mobility - Same house 1 year ago (%) - Black or African American
Geographical mobility - Same house 1 year ago (%) - Asian
Geographical mobility - Same house 1 year ago (%) - Hispanic or Latino
Geographical mobility - Same house 1 year ago (%) - American Indian and Alaska Native
Geographical mobility - Same house 1 year ago (%) - Multirace
Geographical mobility - Same house 1 year ago (%) - Other Race
Geographical mobility - Moved within same county (%)
Geographical mobility - Moved within same county (%) - White
Geographical mobility - Moved within same county (%) - Black or African American
Geographical mobility - Moved within same county (%) - Asian
Geographical mobility - Moved within same county (%) - Hispanic or Latino
Geographical mobility - Moved within same county (%) - American Indian and Alaska Native
Geographical mobility - Moved within same county (%) - Multirace
Geographical mobility - Moved within same county (%) - Other Race
Geographical mobility - Moved from different county within same state (%)
Geographical mobility - Moved from different county within same state (%) - White
Geographical mobility - Moved from different county within same state (%) - Black or African American
Geographical mobility - Moved from different county within same state (%) - Asian
Geographical mobility - Moved from different county within same state (%) - Hispanic or Latino
Geographical mobility - Moved from different county within same state (%) - American Indian and Alaska Native
Geographical mobility - Moved from different county within same state (%) - Multirace
Geographical mobility - Moved from different county within same state (%) - Other Race
Geographical mobility - Moved from different state (%)
Geographical mobility - Moved from different state (%) - White
Geographical mobility - Moved from different state (%) - Black or African American
Geographical mobility - Moved from different state (%) - Asian
Geographical mobility - Moved from different state (%) - Hispanic or Latino
Geographical mobility - Moved from different state (%) - American Indian and Alaska Native
Geographical mobility - Moved from different state (%) - Multirace
Geographical mobility - Moved from different state (%) - Other Race
Geographical mobility - Moved from abroad (%)
Geographical mobility - Moved from abroad (%) - White
Geographical mobility - Moved from abroad (%) - Black or African American
Geographical mobility - Moved from abroad (%) - Asian
Geographical mobility - Moved from abroad (%) - Hispanic or Latino
Geographical mobility - Moved from abroad (%) - American Indian and Alaska Native
Geographical mobility - Moved from abroad (%) - Multirace
Geographical mobility - Moved from abroad (%) - Other Race
Place of birth for the foreign-born population - Ireland (%)
Place of birth for the foreign-born population - Denmark (%)
Place of birth for the foreign-born population - Norway (%)
Place of birth for the foreign-born population - Sweden (%)
Place of birth for the foreign-born population - United Kingdom (%)
Place of birth for the foreign-born population - England (%)
Place of birth for the foreign-born population - Scotland (%)
Place of birth for the foreign-born population - Other Northern Europe (%)
Place of birth for the foreign-born population - Austria (%)
Place of birth for the foreign-born population - Belgium (%)
Place of birth for the foreign-born population - France (%)
Place of birth for the foreign-born population - Germany (%)
Place of birth for the foreign-born population - Netherlands (%)
Place of birth for the foreign-born population - Switzerland (%)
Place of birth for the foreign-born population - Other Western Europe (%)
Place of birth for the foreign-born population - Greece (%)
Place of birth for the foreign-born population - Italy (%)
Place of birth for the foreign-born population - Portugal (%)
Place of birth for the foreign-born population - Spain (%)
Place of birth for the foreign-born population - Other Southern Europe (%)
Place of birth for the foreign-born population - Albania (%)
Place of birth for the foreign-born population - Belarus (%)
Place of birth for the foreign-born population - Bosnia and Herzegovina (%)
Place of birth for the foreign-born population - Bulgaria (%)
Place of birth for the foreign-born population - Croatia (%)
Place of birth for the foreign-born population - Czechoslovakia (%)
Place of birth for the foreign-born population - Hungary (%)
Place of birth for the foreign-born population - Latvia (%)
Place of birth for the foreign-born population - Lithuania (%)
Place of birth for the foreign-born population - North Macedonia (Macedonia) (%)
Place of birth for the foreign-born population - Moldova (%)
Place of birth for the foreign-born population - Poland (%)
Place of birth for the foreign-born population - Romania (%)
Place of birth for the foreign-born population - Russia (%)
Place of birth for the foreign-born population - Serbia (%)
Place of birth for the foreign-born population - Ukraine (%)
Place of birth for the foreign-born population - Other Eastern Europe (%)
Place of birth for the foreign-born population - China (%)
Place of birth for the foreign-born population - Hong Kong (%)
Place of birth for the foreign-born population - Taiwan (%)
Place of birth for the foreign-born population - Japan (%)
Place of birth for the foreign-born population - Korea (%)
Place of birth for the foreign-born population - Other Eastern Asia (%)
Place of birth for the foreign-born population - Afghanistan (%)
Place of birth for the foreign-born population - Bangladesh (%)
Place of birth for the foreign-born population - India (%)
Place of birth for the foreign-born population - Iran (%)
Place of birth for the foreign-born population - Kazakhstan (%)
Place of birth for the foreign-born population - Nepal (%)
Place of birth for the foreign-born population - Pakistan (%)
Place of birth for the foreign-born population - Sri Lanka (%)
Place of birth for the foreign-born population - Uzbekistan (%)
Place of birth for the foreign-born population - Other South Central Asia (%)
Place of birth for the foreign-born population - Burma (%)
Place of birth for the foreign-born population - Cambodia (%)
Place of birth for the foreign-born population - Indonesia (%)
Place of birth for the foreign-born population - Laos (%)
Place of birth for the foreign-born population - Malaysia (%)
Place of birth for the foreign-born population - Philippines (%)
Place of birth for the foreign-born population - Singapore (%)
Place of birth for the foreign-born population - Thailand (%)
Place of birth for the foreign-born population - Vietnam (%)
Place of birth for the foreign-born population - Other South Eastern Asia (%)
Place of birth for the foreign-born population - Armenia (%)
Place of birth for the foreign-born population - Iraq (%)
Place of birth for the foreign-born population - Israel (%)
Place of birth for the foreign-born population - Jordan (%)
Place of birth for the foreign-born population - Kuwait (%)
Place of birth for the foreign-born population - Lebanon (%)
Place of birth for the foreign-born population - Saudi Arabia (%)
Place of birth for the foreign-born population - Syria (%)
Place of birth for the foreign-born population - Turkey (%)
Place of birth for the foreign-born population - Yemen (%)
Place of birth for the foreign-born population - Other Western Asia (%)
Place of birth for the foreign-born population - Eritrea (%)
Place of birth for the foreign-born population - Ethiopia (%)
Place of birth for the foreign-born population - Kenya (%)
Place of birth for the foreign-born population - Somalia (%)
Place of birth for the foreign-born population - Uganda (%)
Place of birth for the foreign-born population - Zimbabwe (%)
Place of birth for the foreign-born population - Other Eastern Africa (%)
Place of birth for the foreign-born population - Cameroon (%)
Place of birth for the foreign-born population - Congo (%)
Place of birth for the foreign-born population - Democratic Republic of Congo (Zaire) (%)
Place of birth for the foreign-born population - Other Middle Africa (%)
Place of birth for the foreign-born population - Egypt (%)
Place of birth for the foreign-born population - Morocco (%)
Place of birth for the foreign-born population - Sudan (%)
Place of birth for the foreign-born population - Other Northern Africa (%)
Place of birth for the foreign-born population - South Africa (%)
Place of birth for the foreign-born population - Other Southern Africa (%)
Place of birth for the foreign-born population - Cabo Verde (%)
Place of birth for the foreign-born population - Ghana (%)
Place of birth for the foreign-born population - Liberia (%)
Place of birth for the foreign-born population - Nigeria (%)
Place of birth for the foreign-born population - Senegal (%)
Place of birth for the foreign-born population - Sierra Leone (%)
Place of birth for the foreign-born population - Other Western Africa (%)
Place of birth for the foreign-born population - Australia (%)
Place of birth for the foreign-born population - New Zealand (%)
Place of birth for the foreign-born population - Fiji (%)
Place of birth for the foreign-born population - Micronesia (%)
Place of birth for the foreign-born population - Bahamas (%)
Place of birth for the foreign-born population - Barbados (%)
Place of birth for the foreign-born population - Cuba (%)
Place of birth for the foreign-born population - Dominica (%)
Place of birth for the foreign-born population - Dominican Republic (%)
Place of birth for the foreign-born population - Grenada (%)
Place of birth for the foreign-born population - Haiti (%)
Place of birth for the foreign-born population - Jamaica (%)
Place of birth for the foreign-born population - St. Vincent and the Grenadines (%)
Place of birth for the foreign-born population - Trinidad and Tobago (%)
Place of birth for the foreign-born population - West Indies (%)
Place of birth for the foreign-born population - Other Caribbean (%)
Place of birth for the foreign-born population - Belize (%)
Place of birth for the foreign-born population - Costa Rica (%)
Place of birth for the foreign-born population - El Salvador (%)
Place of birth for the foreign-born population - Guatemala (%)
Place of birth for the foreign-born population - Honduras (%)
Place of birth for the foreign-born population - Mexico (%)
Place of birth for the foreign-born population - Nicaragua (%)
Place of birth for the foreign-born population - Panama (%)
Place of birth for the foreign-born population - Other Central America (%)
Place of birth for the foreign-born population - Argentina (%)
Place of birth for the foreign-born population - Bolivia (%)
Place of birth for the foreign-born population - Brazil (%)
Place of birth for the foreign-born population - Chile (%)
Place of birth for the foreign-born population - Colombia (%)
Place of birth for the foreign-born population - Ecuador (%)
Place of birth for the foreign-born population - Guyana (%)
Place of birth for the foreign-born population - Peru (%)
Place of birth for the foreign-born population - Uruguay (%)
Place of birth for the foreign-born population - Venezuela (%)
Place of birth for the foreign-born population - Other South America (%)
Place of birth for the foreign-born population - Canada (%)
Place of birth for the foreign-born population - Other Northern America (%)
Place of birth for the foreign-born population - Other (%)
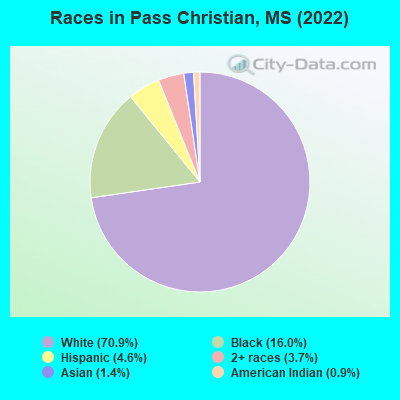
According to 2022 data, the most numerous races in Pass Christian, MS are White alone (4,161 residents), Black alone (937 residents), and Hispanic (268 residents). 94.8% of Pass Christian residents speak English at home. 2.9% of Pass Christian, MS residents are foreign-born (1.8% born in Asia, 0.6% born in Europe, 0.4% born in Latin America), which is 30.2% greater than the foreign-born rate of 2.0% across the entire state of Mississippi.
Race distribution in Pass Christian
2000 2022
1,727,908 60.7% White alone 1,028,473 36.2% Black alone 39,569 1.4% Hispanic 17,272 0.6% Two or more races 18,349 0.6% Asian alone 11,224 0.4% American Indian alone 1,294 0.05% Other race alone 569 0.02% Native Hawaiian and Other
1,625,979 55.3% White alone 1,072,962 36.5% Black alone 97,177 3.3% Hispanic 96,367 3.3% Two or more races 25,217 0.9% Asian alone 12,457 0.4% American Indian alone 9,501 0.3% Other race alone 397 0.01% Native Hawaiian and Other
Income and house value in Pass Christian Median household income in 2022 $71,260 White non-Hispanic householders$42,462 Black householdersMedian 2022 house value $329,286 White Non-Hispanic householders$161,536 Black or African American householders $231,500 Asian householders$187,199 Some other race householders$202,596 Two or more races householders$163,968 Hispanic or Latino householders
Median age by race in Pass Christian
42.3 Median age for White residents38.9 45.0 45.2 Median age for Black or African American residents41.8 45.7 67.5 Median age for American Indian / Alaska Native residents-661,654,134.7 -624,521,072.2 52.5 Median age for Asian residents-620,865,139.3 -700,617,283.2 -666,666,666.0 Median age for Native Hawaiian / Pacific Islander residents-668,724,279.2 -670,599,802.7 -529,976,018.7 Median age for Other race residents-606,837,606.2 -416,326,530.2 20.4 Median age for Two or more races residents18.4 18.6 42.0 Median age for White alone residents38.0 46.3 36.5 Median age for Hispanic or Latino residents16.1 38.5
Owner/renter occupied households by race in Pass Christian
House owners and renters - White residents 1,375 79.2% Owner occupied361 20.8% Renter occupiedHouse owners and renters - Black or African American residents 212 57.4% Owner occupied157 42.6% Renter occupiedHouse owners and renters - American Indian / Alaska Native residents 74 100.0% Owner occupiedHouse owners and renters - Asian residents 74 100.0% Owner occupiedHouse owners and renters - Two or more races residents 48 40.7% Owner occupied70 59.3% Renter occupiedHouse owners and renters - White alone residents 1,362 79.9% Owner occupied342 20.1% Renter occupiedHouse owners and renters - Hispanic or Latino residents 26 38.7% Owner occupied41 61.3% Renter occupied
Language usage in Pass Christian
English speakers - Total 94.8% of residents of Pass Christian speak English at home.
1.1% of residents speak Spanish at home 57 90.5% Speak English very well6 9.5% Speak English less than very well4.7% of residents speak other language at home 227 88.0% Speak English very well31 12.0% Speak English less than very well
English speakers - Born in the United States 95.4% of residents of Pass Christian speak English at home.
0.5% of residents speak Spanish at home 8 53.3% Speak English very well7 46.7% Speak English less than very well1.5% of residents speak other language at home 42 100.0% Speak English very well
English speakers - Native, born elsewhere 83.7% of residents of Pass Christian speak English at home.
17.4% of residents speak other language at home 16 100.0% Speak English very well
English speakers - Foreign-born 11.5% of residents of Pass Christian speak English at home.
20.0% of residents speak Spanish at home 26 100.0% Speak English very well70.8% of residents speak other language at home 73 79.3% Speak English very well19 20.7% Speak English less than very well
White (Caucasian) - Speak only English Native:
98.1% (3,826)Foreign-born:
68.1% (14)
White (Caucasian) - Speak another language Native:
1.9% (72)Foreign-born:
42.4% (9)
White alone - Speak only English Native:
98.0% (3,778)Foreign-born:
47.9% (15)
White alone - Speak another language Native:
2.0% (76)Foreign-born:
51.1% (16)
Foreign-born residents in Pass Christian 168 residents are foreign born (1.8% Asia , 0.6% Europe , 0.4% Latin America ).
This city:
2.9%Mississippi:
2.3%
Marital status for residents in Pass Christian Marital status - White (Caucasian) population 15 years and over
Males 23.7% Never married56.6% Now married0.7% Separated4.4% Widowed14.5% DivorcedFemales 30.2% Never married43.0% Now married0.0% Separated12.5% Widowed14.2% DivorcedWomen who gave birth in the past 12 months Now married:
100.0% (50)Unmarried:
0.0% (0)
Women who did not give birth in the past 12 months Now married:
35.7% (279)Unmarried:
64.3% (502)
Marital status - Black or African American population 15 years and over
Males 50.8% Never married33.3% Now married0.0% Separated0.0% Widowed15.9% DivorcedFemales 38.9% Never married27.7% Now married6.4% Separated7.9% Widowed19.1% DivorcedWomen who did not give birth in the past 12 months Now married:
5.4% (11)Unmarried:
94.6% (189)
Marital status - American Indian / Alaska Native population 15 years and over
Males 0.0% Never married16.7% Now married0.0% Separated83.3% Widowed0.0% DivorcedFemales 0.0% Never married0.0% Now married0.0% Separated100.0% Widowed0.0% DivorcedMarital status - Asian population 15 years and over
Males 17.1% Never married82.9% Now married0.0% Separated0.0% Widowed0.0% DivorcedFemales 0.0% Never married65.5% Now married0.0% Separated0.0% Widowed34.5% DivorcedWomen who did not give birth in the past 12 months Now married:
100.0% (16)Unmarried:
0.0% (0)
Marital status - Two or more races population 15 years and over
Males 23.9% Never married12.8% Now married46.2% Separated17.1% Widowed0.0% DivorcedFemales 37.7% Never married42.6% Now married0.0% Separated0.0% Widowed19.7% DivorcedWomen who gave birth in the past 12 months Now married:
0.0% (0)Unmarried:
100.0% (29)
Women who did not give birth in the past 12 months Now married:
55.0% (23)Unmarried:
45.0% (18)
Marital status - White alone, not Hispanic / Latino population 15 years and over
Males 24.2% Never married55.7% Now married0.7% Separated4.5% Widowed14.8% DivorcedFemales 29.1% Never married43.7% Now married0.0% Separated12.7% Widowed14.4% DivorcedWomen who gave birth in the past 12 months Now married:
100.0% (50)Unmarried:
0.0% (0)
Women who did not give birth in the past 12 months Now married:
37.0% (280)Unmarried:
63.0% (478)
Marital status - Hispanic or Latino population 15 years and over
Males 25.5% Never married25.5% Now married49.1% Separated0.0% Widowed0.0% DivorcedFemales 77.8% Never married0.0% Now married0.0% Separated0.0% Widowed22.2% DivorcedWomen who gave birth in the past 12 months Now married:
0.0% (0)Unmarried:
100.0% (15)
Women who did not give birth in the past 12 months Now married:
0.0% (0)Unmarried:
100.0% (30)
Ancestries in Pass Christian
339 12.4% English301 11.0% American188 6.9% Italian153 5.6% German149 5.4% European134 4.9% Irish78 2.8% Scotch-Irish53 1.9% French30 1.1% British27 1.0% French Canadian17 0.6% Scottish15 0.5% Russian13 0.5% Greek12 0.4% Cajun11 0.4% Romanian10 0.4% Scandinavian7 0.3% Slavic5 0.2% Norwegian5 0.2% Yugoslavian4 0.1% Canadian
Children Nativity (place of birth) in Pass Christian
Children under 6 years - Living with two parents Both parents native 290 100.0% NativeOne native, one foreign-born parent 8 100.0% NativeChildren under 6 years - Living with one parent Native parent 144 100.0% Native
Children 6 to 17 years - Living with two parents Both parents native 398 100.0% NativeOne native, one foreign-born parent 20 100.0% NativeChildren 6 to 17 years - Living with one parent Native parent 396 100.0% Native
Grandparents responsible for own grandchildren in Pass Christian
Grandparents (30 to 59 years) White / Caucasian 9 40.4% Responsible for grandchildren14 59.6% Not responsible for grandchildrenBlack or African American 15 100.0% Not responsible for grandchildrenWhite alone, not Hispanic / Latino 9 40.4% Responsible for grandchildren14 59.6% Not responsible for grandchildrenGrandparents (60 years and over) White / Caucasian 9 70.9% Responsible for grandchildren4 29.1% Not responsible for grandchildrenWhite alone, not Hispanic / Latino 9 70.7% Responsible for grandchildren4 29.3% Not responsible for grandchildren