Races in Pena Blanca, New Mexico (NM) Detailed Stats
Ancestries, Foreign-born residents, place of birth

Recent posts about races in Pena Blanca, New Mexico on our local forum with over 2,400,000 registered users:
 | Is March a nice time to visit? (61 replies) |
| ABQ ranks 87 out of 100 on Best Cities for Successful Aging (12 replies) |
| Camper attacked (59 replies) |
| The *Official* New Mexico "Off-Topic" Chat Thread (2766 replies) |
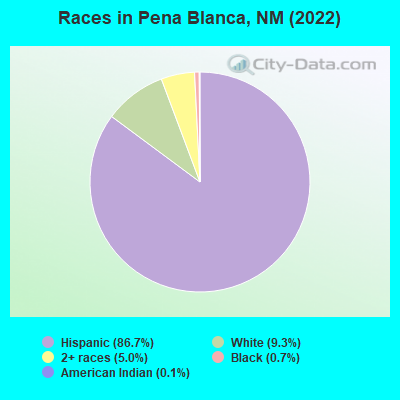
According to 2022 data, the most numerous races in Pena Blanca, NM are Hispanic (612 residents), White alone (66 residents), and American Indian alone (1 residents). 41.5% of Pena Blanca residents speak English at home. 5.5% of Pena Blanca, NM residents are foreign-born (5.7% born in Latin America), which is 63.2% less than the foreign-born rate of 9.0% across the entire state of New Mexico.
Race distribution in Pena Blanca

2000
2022

- 813,49544.7%White alone
- 765,38642.1%Hispanic
- 161,4608.9%American Indian alone
- 30,6541.7%Black alone
- 25,7931.4%Two or more races
- 18,2571.0%Asian alone
- 3,0090.2%Other race alone
- 9920.05%Native Hawaiian and Other
Pacific Islander alone

-
- 1,059,86750.2%Hispanic
- 735,47834.8%White alone
- 171,8088.1%American Indian alone
- 65,0843.1%Two or more races
- 36,8701.7%Black alone
- 35,8701.7%Asian alone
- 7,5820.4%Other race alone
- 7850.04%Native Hawaiian and Other
Pacific Islander alone

Income and house value in Pena Blanca
- Median household income in 2022
- $94,700Two or more races householders
- $56,382Hispanic or Latino race householders
- Median 2022 house value
- $234,587White Non-Hispanic householders
- $178,590American Indian or Alaska Native householders
- $200,482Some other race householders
- $202,787Hispanic or Latino householders
Household income for White non-Hispanic householders

Household income for Some other race householders

Household income for Two or more races householders

Household income for Hispanic or Latino race householders

Median age by race in Pena Blanca
- 37.5Median age for White residents
- 25.9Males
- 38.3Females
- -714,924,038.6Median age for Black or African American residents
- -783,377,541.2Males
- -564,814,814.2Females
- -662,525,879.3Median age for American Indian / Alaska Native residents
- -653,968,253.3Males
- -702,594,809.7Females
- -538,170,823.3Median age for Asian residents
- -598,765,431.5Males
- -612,724,757.3Females
- -679,089,026.2Median age for Native Hawaiian / Pacific Islander residents
- -685,897,435.2Males
- -659,380,691.5Females
- 23.7Median age for Other race residents
- 24.7Males
- 23.9Females
- 62.8Median age for Two or more races residents
- 59.8Males
- 58.1Females
- 37.9Median age for White alone residents
- 15.9Males
- 38.0Females
- 44.1Median age for Hispanic or Latino residents
- 49.0Males
- 39.9Females
Owner/renter occupied households by race in Pena Blanca
- House owners and renters - White residents
- 5991.8%Owner occupied
- 58.2%Renter occupied
- House owners and renters - Black or African American residents
- 2100.0%Owner occupied
- House owners and renters - American Indian / Alaska Native residents
- 1100.0%Owner occupied
- House owners and renters - Other race residents
- 3250.9%Owner occupied
- 3149.1%Renter occupied
- House owners and renters - Two or more races residents
- 25998.1%Owner occupied
- 51.9%Renter occupied
- House owners and renters - White alone residents
- 1290.9%Owner occupied
- 19.1%Renter occupied
- House owners and renters - Hispanic or Latino residents
- 22888.8%Owner occupied
- 2911.2%Renter occupied
Language usage in Pena Blanca
- English speakers - Total
- 41.5% of residents of Pena Blanca speak English at home.
- 40.9% of residents speak Spanish at home
- 26091.2%Speak English very well
- 258.8%Speak English less than very well
- 7.6% of residents speak other language at home
- 53100.0%Speak English very well
- English speakers - Born in the United States
- 32.7% of residents of Pena Blanca speak English at home.
- 32.7% of residents speak Spanish at home
- 34100.0%Speak English very well
- 24.0% of residents speak other language at home
- 25100.0%Speak English very well
All residents speak only English at home
- English speakers - Foreign-born
- 16.7% of residents of Pena Blanca speak English at home.
- 87.5% of residents speak Spanish at home
- 1023.8%Speak English very well
- 3276.2%Speak English less than very well
White (Caucasian) - Speak only English
| Native: | 57.6% (123) |
| Foreign-born: | 100.0% (3) |
Other race - Speak another language
| Native: | 46.2% (45) |
| Foreign-born: | 89.9% (20) |
Two or more races - Speak another language
| Native: | 53.5% (226) |
| Foreign-born: | 79.6% (33) |
Hispanic or Latino - Speak only English
| Native: | 43.6% (240) |
| Foreign-born: | 23.1% (12) |
Hispanic or Latino - Speak another language
| Native: | 44.0% (242) |
| Foreign-born: | 73.8% (39) |
Foreign-born residents in Pena Blanca
39 residents are foreign born (5.7% Latin America).
| This city: | 5.5% |
| New Mexico: | 9.2% |


Marital status for residents in Pena Blanca
Marital status - White (Caucasian) population 15 years and over
- Males
- 56.9%Never married
- 36.7%Now married
- 0.0%Separated
- 1.8%Widowed
- 4.6%Divorced
- Females
- 26.5%Never married
- 63.3%Now married
- 0.0%Separated
- 4.1%Widowed
- 6.1%Divorced
Women who did not give birth in the past 12 months
| Now married: | 61.3% (39) |
| Unmarried: | 38.7% (24) |
Marital status - American Indian / Alaska Native population 15 years and over
- Males
- 0.0%Never married
- 100.0%Now married
- 0.0%Separated
- 0.0%Widowed
- 0.0%Divorced
- Females
- 0.0%Never married
- 100.0%Now married
- 0.0%Separated
- 0.0%Widowed
- 0.0%Divorced
Marital status - Other race population 15 years and over
- Males
- 76.2%Never married
- 11.9%Now married
- 0.0%Separated
- 7.1%Widowed
- 4.8%Divorced
- Females
- 73.0%Never married
- 8.1%Now married
- 0.0%Separated
- 8.1%Widowed
- 10.8%Divorced
Women who did not give birth in the past 12 months
| Now married: | 6.9% (3) |
| Unmarried: | 93.1% (39) |
Marital status - Two or more races population 15 years and over
- Males
- 42.9%Never married
- 50.8%Now married
- 6.3%Separated
- 0.0%Widowed
- 0.0%Divorced
- Females
- 18.2%Never married
- 60.0%Now married
- 0.0%Separated
- 14.5%Widowed
- 7.3%Divorced
Women who gave birth in the past 12 months
| Now married: | 100.0% (5) |
| Unmarried: | 0.0% (0) |
Women who did not give birth in the past 12 months
| Now married: | 37.8% (23) |
| Unmarried: | 62.2% (37) |
Marital status - White alone, not Hispanic / Latino population 15 years and over
- Males
- 68.6%Never married
- 25.7%Now married
- 0.0%Separated
- 0.0%Widowed
- 5.7%Divorced
- Females
- 9.4%Never married
- 87.5%Now married
- 0.0%Separated
- 3.1%Widowed
- 0.0%Divorced
Women who did not give birth in the past 12 months
| Now married: | 88.5% (23) |
| Unmarried: | 11.5% (3) |
Marital status - Hispanic or Latino population 15 years and over
- Males
- 52.5%Never married
- 39.8%Now married
- 4.2%Separated
- 1.8%Widowed
- 1.8%Divorced
- Females
- 32.9%Never married
- 48.4%Now married
- 0.0%Separated
- 10.3%Widowed
- 8.5%Divorced
Women who gave birth in the past 12 months
| Now married: | 100.0% (4) |
| Unmarried: | 0.0% (0) |
Women who did not give birth in the past 12 months
| Now married: | 34.1% (44) |
| Unmarried: | 65.9% (85) |
Ancestries in Pena Blanca

- 20.4%Lebanese
- 20.4%Irish
- 20.4%Italian
- 10.2%Scotch-Irish

Geographical mobility in Pena Blanca

- Same house 1 year ago
- 220100.0%White (Caucasian)
- 482.0%Black or African American
- 899.7%American Indian / Alaska Native
- 10585.3%Other race
- 45698.7%Two or more races
- 68100.0%White alone, not Hispanic / Latino
- 59797.7%Hispanic or Latino

-
- Moved within same state
- 127.9%Black or African American
- 2117.1%Other race
- 162.7%Hispanic or Latino

-
- Moved from different state
- 71.5%Two or more races
- 30.5%Hispanic or Latino

-
- Moved from abroad
- 51.0%Two or more races

Children Nativity (place of birth) in Pena Blanca
Place of birth for residents in Pena Blanca
![Place of birth for the foreign-born population - Regions]()
- 39Americas
- 39Latin America
- 39Central America
