Races in Penasco, New Mexico (NM) Detailed Stats
Ancestries, Foreign-born residents, place of birth

Recent posts about races in Penasco, New Mexico on our local forum with over 2,400,000 registered users:
 | Is March a nice time to visit? (61 replies) |
| Relocating to Santa Fe, working in Los Alamos, concerned about water (38 replies) |
| Camper attacked (59 replies) |
| Towns Between Santa Fe And Taos....... (21 replies) |
| Long Weekend in ABQ...looking for scenery (6 replies) |
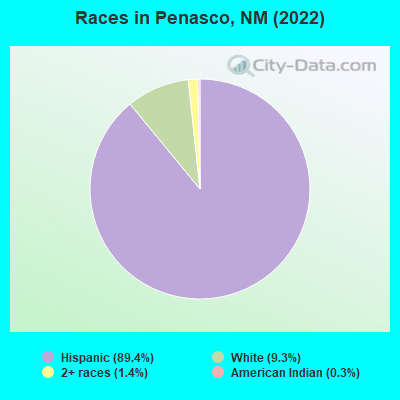
According to 2022 data, the most numerous races in Penasco, NM are Hispanic (633 residents), White alone (66 residents), and American Indian alone (2 residents). 57.5% of Penasco residents speak English at home. 0.6% of Penasco, NM residents are foreign-born , which is 1493.0% less than the foreign-born rate of 9.0% across the entire state of New Mexico.
Race distribution in Penasco

2000
2022

- 813,49544.7%White alone
- 765,38642.1%Hispanic
- 161,4608.9%American Indian alone
- 30,6541.7%Black alone
- 25,7931.4%Two or more races
- 18,2571.0%Asian alone
- 3,0090.2%Other race alone
- 9920.05%Native Hawaiian and Other
Pacific Islander alone

-
- 1,059,86750.2%Hispanic
- 735,47834.8%White alone
- 171,8088.1%American Indian alone
- 65,0843.1%Two or more races
- 36,8701.7%Black alone
- 35,8701.7%Asian alone
- 7,5820.4%Other race alone
- 7850.04%Native Hawaiian and Other
Pacific Islander alone

Income and house value in Penasco
- Median household income in 2022
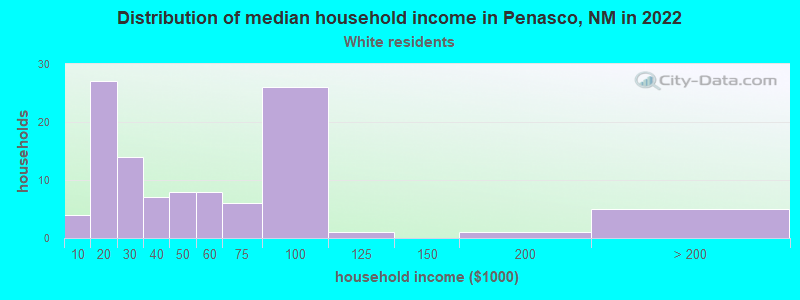
- $61,264White non-Hispanic householders
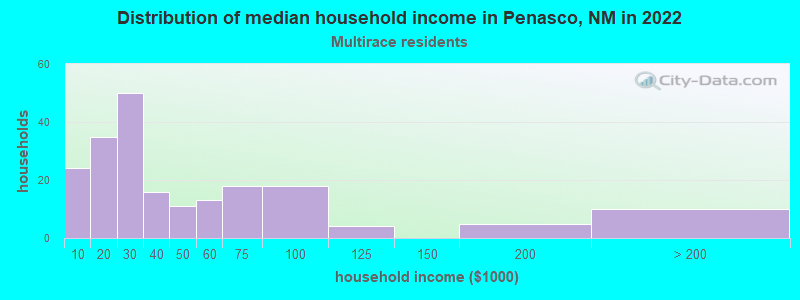
- $24,891Two or more races householders
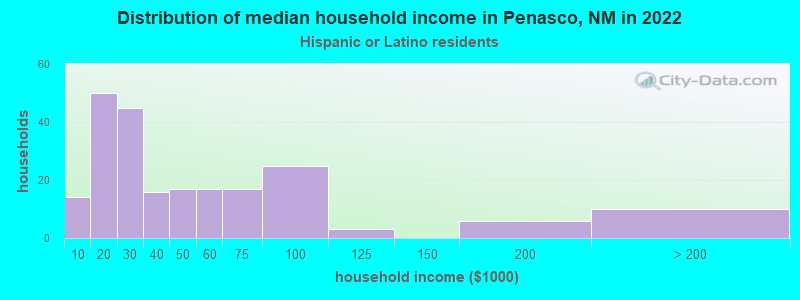
- $30,256Hispanic or Latino race householders
- Median 2022 house value
- $422,166White Non-Hispanic householders
- $275,136Some other race householders
- $349,379Two or more races householders
- $278,047Hispanic or Latino householders
Household income for White non-Hispanic householders
Household income for Some other race householders

Household income for Two or more races householders
Household income for Hispanic or Latino race householders
Median age by race in Penasco
- 43.7Median age for White residents
- 44.8Males
- 43.3Females
- -656,596,172.6Median age for Black or African American residents
- -648,594,376.9Males
- -670,719,350.9Females
- 36.0Median age for American Indian / Alaska Native residents
- -685,534,590.5Males
- -676,413,254.7Females
- 15.5Median age for Asian residents
- -687,619,046.9Males
- 13.7Females
- -658,511,722.1Median age for Native Hawaiian / Pacific Islander residents
- -685,897,435.2Males
- -659,380,691.5Females
- 42.4Median age for Other race residents
- -614,814,814.2Males
- 50.5Females
- 40.1Median age for Two or more races residents
- 40.0Males
- 47.3Females
- 47.4Median age for White alone residents
- 50.0Males
- 40.1Females
- 38.1Median age for Hispanic or Latino residents
- 37.8Males
- 44.7Females
Owner/renter occupied households by race in Penasco
- House owners and renters - White residents
- 7768.0%Owner occupied
- 3632.0%Renter occupied
- House owners and renters - American Indian / Alaska Native residents
- 2100.0%Renter occupied
- House owners and renters - Other race residents
- 344.4%Owner occupied
- 455.6%Renter occupied
- House owners and renters - Two or more races residents
- 15276.4%Owner occupied
- 4723.6%Renter occupied
- House owners and renters - White alone residents
- 2970.0%Owner occupied
- 1230.0%Renter occupied
- House owners and renters - Hispanic or Latino residents
- 16172.2%Owner occupied
- 6227.8%Renter occupied
Language usage in Penasco
- English speakers - Total
- 57.5% of residents of Penasco speak English at home.
- 39.9% of residents speak Spanish at home
- 25394.1%Speak English very well
- 165.9%Speak English less than very well
- 0.9% of residents speak other language at home
- 6100.0%Speak English very well
- English speakers - Born in the United States
- 67.7% of residents of Penasco speak English at home.
- 29.7% of residents speak Spanish at home
- 4595.7%Speak English very well
- 24.3%Speak English less than very well
- English speakers - Native, born elsewhere
- 0.0% of residents of Penasco speak English at home.
- English speakers - Foreign-born
- 0.0% of residents of Penasco speak English at home.
- 25.0% of residents speak Spanish at home
- 1100.0%Speak English very well
- 50.0% of residents speak other language at home
- 2100.0%Speak English very well
White (Caucasian) - Speak another language
| Native: | 21.3% (53) |
| Foreign-born: | 100.0% (2) |
White alone - Speak another language
| Native: | 3.8% (2) |
| Foreign-born: | 94.6% (2) |
Hispanic or Latino - Speak another language
| Native: | 47.3% (285) |
| Foreign-born: | 96.8% (2) |
Foreign-born residents in Penasco
4 residents are foreign born
| This city: | 0.6% |
| New Mexico: | 9.2% |


Marital status for residents in Penasco
Marital status - White (Caucasian) population 15 years and over
- Males
- 49.2%Never married
- 31.1%Now married
- 0.8%Separated
- 2.3%Widowed
- 16.7%Divorced
- Females
- 39.7%Never married
- 40.5%Now married
- 7.9%Separated
- 5.6%Widowed
- 6.3%Divorced
Women who gave birth in the past 12 months
| Now married: | 100.0% (3) |
| Unmarried: | 0.0% (0) |
Women who did not give birth in the past 12 months
| Now married: | 43.5% (23) |
| Unmarried: | 56.5% (29) |
Marital status - American Indian / Alaska Native population 15 years and over
- Males
- 0.0%Never married
- 100.0%Now married
- 0.0%Separated
- 0.0%Widowed
- 0.0%Divorced
- Females
- 0.0%Never married
- 100.0%Now married
- 0.0%Separated
- 0.0%Widowed
- 0.0%Divorced
Women who did not give birth in the past 12 months
| Now married: | 100.0% (2) |
| Unmarried: | 0.0% (0) |
Marital status - Asian population 15 years and over
- Males
- 100.0%Never married
- 0.0%Now married
- 0.0%Separated
- 0.0%Widowed
- 0.0%Divorced
- Females
- 0.0%Never married
- 100.0%Now married
- 0.0%Separated
- 0.0%Widowed
- 0.0%Divorced
Women who did not give birth in the past 12 months
| Now married: | 100.0% (2) |
| Unmarried: | 0.0% (0) |
Marital status - Other race population 15 years and over
- Males
- 20.0%Never married
- 80.0%Now married
- 0.0%Separated
- 0.0%Widowed
- 0.0%Divorced
- Females
- 33.3%Never married
- 33.3%Now married
- 0.0%Separated
- 0.0%Widowed
- 33.3%Divorced
Women who did not give birth in the past 12 months
| Now married: | 50.0% (3) |
| Unmarried: | 50.0% (3) |
Marital status - Two or more races population 15 years and over
- Males
- 33.5%Never married
- 27.1%Now married
- 26.1%Separated
- 9.4%Widowed
- 3.9%Divorced
- Females
- 31.4%Never married
- 30.2%Now married
- 7.0%Separated
- 17.4%Widowed
- 14.0%Divorced
Women who did not give birth in the past 12 months
| Now married: | 21.9% (11) |
| Unmarried: | 78.1% (38) |
Marital status - White alone, not Hispanic / Latino population 15 years and over
- Males
- 22.7%Never married
- 45.5%Now married
- 0.0%Separated
- 0.0%Widowed
- 31.8%Divorced
- Females
- 36.4%Never married
- 50.0%Now married
- 13.6%Separated
- 0.0%Widowed
- 0.0%Divorced
Women who did not give birth in the past 12 months
| Now married: | 51.7% (15) |
| Unmarried: | 48.3% (14) |
Marital status - Hispanic or Latino population 15 years and over
- Males
- 41.3%Never married
- 29.0%Now married
- 17.0%Separated
- 6.9%Widowed
- 5.7%Divorced
- Females
- 35.8%Never married
- 33.5%Now married
- 5.7%Separated
- 12.5%Widowed
- 12.5%Divorced
Women who gave birth in the past 12 months
| Now married: | 100.0% (4) |
| Unmarried: | 0.0% (0) |
Women who did not give birth in the past 12 months
| Now married: | 33.3% (26) |
| Unmarried: | 66.7% (53) |
Ancestries in Penasco

- 132.8%English
- 61.3%Irish
- 20.4%German
- 10.2%American
- 10.2%British

Geographical mobility in Penasco

- Same house 1 year ago
- 24196.2%White (Caucasian)
- 8100.0%Black or African American
- 599.7%American Indian / Alaska Native
- 9100.0%Asian
- 15100.0%Other race
- 54199.2%Two or more races
- 6598.4%White alone, not Hispanic / Latino
- 62699.0%Hispanic or Latino

-
- Moved within same county
- 103.9%White / Caucasian
- 22.3%White alone, not Hispanic / Latino
- 121.9%Hispanic or Latino

Children Nativity (place of birth) in Penasco
Place of birth for residents in Penasco
![Place of birth for the foreign-born population - Regions]()
- 2Europe
- 2Western Europe
- 2Americas
- 2Latin America
- 2Central America

Grandparents responsible for own grandchildren in Penasco
Zip codes: 87553.