Races in Pickerington, Ohio (OH) Detailed Stats
Data:
Races - White alone (%)
Races - White alone (% change since 2000)
Races - Black alone (%)
Races - Black alone (% change since 2000)
Races - American Indian alone (%)
Races - American Indian alone (% change since 2000)
Races - Asian alone (%)
Races - Asian alone (% change since 2000)
Races - Hispanic (%)
Races - Hispanic (% change since 2000)
Races - Native Hawaiian and Other Pacific Islander alone (%)
Races - Native Hawaiian and Other Pacific Islander alone (% change since 2000)
Races - Two or more races(%)
Races - Two or more races(% change since 2000)
Races - Other race alone (%)
Races - Other race alone (% change since 2000)
Racial diversity
Place of birth - Born in state of residence (%)
Place of birth - Born in state of residence (%) - White
Place of birth - Born in state of residence (%) - Black or African American
Place of birth - Born in state of residence (%) - Asian
Place of birth - Born in state of residence (%) - Hispanic or Latino
Place of birth - Born in state of residence (%) - American Indian and Alaska Native
Place of birth - Born in state of residence (%) - Multirace
Place of birth - Born in state of residence (%) - Other Race
Place of birth - Born in other state (%)
Place of birth - Born in other state (%) - White
Place of birth - Born in other state (%) - Black or African American
Place of birth - Born in other state (%) - Asian
Place of birth - Born in other state (%) - Hispanic or Latino
Place of birth - Born in other state (%) - American Indian and Alaska Native
Place of birth - Born in other state (%) - Multirace
Place of birth - Born in other state (%) - Other Race
Place of birth - Native, outside of US (%)
Place of birth - Native, outside of US (%) - White
Place of birth - Native, outside of US (%) - Black or African American
Place of birth - Native, outside of US (%) - Asian
Place of birth - Native, outside of US (%) - Hispanic or Latino
Place of birth - Native, outside of US (%) - American Indian and Alaska Native
Place of birth - Native, outside of US (%) - Multirace
Place of birth - Native, outside of US (%) - Other Race
Place of birth - Foreign born (%)
Place of birth - Foreign born (%) - White
Place of birth - Foreign born (%) - Black or African American
Place of birth - Foreign born (%) - Asian
Place of birth - Foreign born (%) - Hispanic or Latino
Place of birth - Foreign born (%) - American Indian and Alaska Native
Place of birth - Foreign born (%) - Multirace
Place of birth - Foreign born (%) - Other Race
Residents speaking English at home (%)
Residents speaking English at home - Born in the United States (%)
Residents speaking English at home - Native, born elsewhere (%)
Residents speaking English at home - Foreign born (%)
Residents speaking Spanish at home (%)
Residents speaking Spanish at home - Born in the United States (%)
Residents speaking Spanish at home - Native, born elsewhere (%)
Residents speaking Spanish at home - Foreign born (%)
Residents speaking other language at home (%)
Residents speaking other language at home - Born in the United States (%)
Residents speaking other language at home - Native, born elsewhere (%)
Residents speaking other language at home - Foreign born (%)
Marital status - Never married (%)
Marital status - Now married (%)
Marital status - Separated (%)
Marital status - Widowed (%)
Marital status - Divorced (%)
Ancestries Reported - Arab (%)
Ancestries Reported - Czech (%)
Ancestries Reported - Danish (%)
Ancestries Reported - Dutch (%)
Ancestries Reported - English (%)
Ancestries Reported - French (%)
Ancestries Reported - French Canadian (%)
Ancestries Reported - German (%)
Ancestries Reported - Greek (%)
Ancestries Reported - Hungarian (%)
Ancestries Reported - Irish (%)
Ancestries Reported - Italian (%)
Ancestries Reported - Lithuanian (%)
Ancestries Reported - Norwegian (%)
Ancestries Reported - Polish (%)
Ancestries Reported - Portuguese (%)
Ancestries Reported - Russian (%)
Ancestries Reported - Scotch-Irish (%)
Ancestries Reported - Scottish (%)
Ancestries Reported - Slovak (%)
Ancestries Reported - Subsaharan African (%)
Ancestries Reported - Swedish (%)
Ancestries Reported - Swiss (%)
Ancestries Reported - Ukrainian (%)
Ancestries Reported - United States (%)
Ancestries Reported - Welsh (%)
Ancestries Reported - West Indian (%)
Ancestries Reported - Other (%)
Geographical mobility - Same house 1 year ago (%)
Geographical mobility - Same house 1 year ago (%) - White
Geographical mobility - Same house 1 year ago (%) - Black or African American
Geographical mobility - Same house 1 year ago (%) - Asian
Geographical mobility - Same house 1 year ago (%) - Hispanic or Latino
Geographical mobility - Same house 1 year ago (%) - American Indian and Alaska Native
Geographical mobility - Same house 1 year ago (%) - Multirace
Geographical mobility - Same house 1 year ago (%) - Other Race
Geographical mobility - Moved within same county (%)
Geographical mobility - Moved within same county (%) - White
Geographical mobility - Moved within same county (%) - Black or African American
Geographical mobility - Moved within same county (%) - Asian
Geographical mobility - Moved within same county (%) - Hispanic or Latino
Geographical mobility - Moved within same county (%) - American Indian and Alaska Native
Geographical mobility - Moved within same county (%) - Multirace
Geographical mobility - Moved within same county (%) - Other Race
Geographical mobility - Moved from different county within same state (%)
Geographical mobility - Moved from different county within same state (%) - White
Geographical mobility - Moved from different county within same state (%) - Black or African American
Geographical mobility - Moved from different county within same state (%) - Asian
Geographical mobility - Moved from different county within same state (%) - Hispanic or Latino
Geographical mobility - Moved from different county within same state (%) - American Indian and Alaska Native
Geographical mobility - Moved from different county within same state (%) - Multirace
Geographical mobility - Moved from different county within same state (%) - Other Race
Geographical mobility - Moved from different state (%)
Geographical mobility - Moved from different state (%) - White
Geographical mobility - Moved from different state (%) - Black or African American
Geographical mobility - Moved from different state (%) - Asian
Geographical mobility - Moved from different state (%) - Hispanic or Latino
Geographical mobility - Moved from different state (%) - American Indian and Alaska Native
Geographical mobility - Moved from different state (%) - Multirace
Geographical mobility - Moved from different state (%) - Other Race
Geographical mobility - Moved from abroad (%)
Geographical mobility - Moved from abroad (%) - White
Geographical mobility - Moved from abroad (%) - Black or African American
Geographical mobility - Moved from abroad (%) - Asian
Geographical mobility - Moved from abroad (%) - Hispanic or Latino
Geographical mobility - Moved from abroad (%) - American Indian and Alaska Native
Geographical mobility - Moved from abroad (%) - Multirace
Geographical mobility - Moved from abroad (%) - Other Race
Place of birth for the foreign-born population - Ireland (%)
Place of birth for the foreign-born population - Denmark (%)
Place of birth for the foreign-born population - Norway (%)
Place of birth for the foreign-born population - Sweden (%)
Place of birth for the foreign-born population - United Kingdom (%)
Place of birth for the foreign-born population - England (%)
Place of birth for the foreign-born population - Scotland (%)
Place of birth for the foreign-born population - Other Northern Europe (%)
Place of birth for the foreign-born population - Austria (%)
Place of birth for the foreign-born population - Belgium (%)
Place of birth for the foreign-born population - France (%)
Place of birth for the foreign-born population - Germany (%)
Place of birth for the foreign-born population - Netherlands (%)
Place of birth for the foreign-born population - Switzerland (%)
Place of birth for the foreign-born population - Other Western Europe (%)
Place of birth for the foreign-born population - Greece (%)
Place of birth for the foreign-born population - Italy (%)
Place of birth for the foreign-born population - Portugal (%)
Place of birth for the foreign-born population - Spain (%)
Place of birth for the foreign-born population - Other Southern Europe (%)
Place of birth for the foreign-born population - Albania (%)
Place of birth for the foreign-born population - Belarus (%)
Place of birth for the foreign-born population - Bosnia and Herzegovina (%)
Place of birth for the foreign-born population - Bulgaria (%)
Place of birth for the foreign-born population - Croatia (%)
Place of birth for the foreign-born population - Czechoslovakia (%)
Place of birth for the foreign-born population - Hungary (%)
Place of birth for the foreign-born population - Latvia (%)
Place of birth for the foreign-born population - Lithuania (%)
Place of birth for the foreign-born population - North Macedonia (Macedonia) (%)
Place of birth for the foreign-born population - Moldova (%)
Place of birth for the foreign-born population - Poland (%)
Place of birth for the foreign-born population - Romania (%)
Place of birth for the foreign-born population - Russia (%)
Place of birth for the foreign-born population - Serbia (%)
Place of birth for the foreign-born population - Ukraine (%)
Place of birth for the foreign-born population - Other Eastern Europe (%)
Place of birth for the foreign-born population - China (%)
Place of birth for the foreign-born population - Hong Kong (%)
Place of birth for the foreign-born population - Taiwan (%)
Place of birth for the foreign-born population - Japan (%)
Place of birth for the foreign-born population - Korea (%)
Place of birth for the foreign-born population - Other Eastern Asia (%)
Place of birth for the foreign-born population - Afghanistan (%)
Place of birth for the foreign-born population - Bangladesh (%)
Place of birth for the foreign-born population - India (%)
Place of birth for the foreign-born population - Iran (%)
Place of birth for the foreign-born population - Kazakhstan (%)
Place of birth for the foreign-born population - Nepal (%)
Place of birth for the foreign-born population - Pakistan (%)
Place of birth for the foreign-born population - Sri Lanka (%)
Place of birth for the foreign-born population - Uzbekistan (%)
Place of birth for the foreign-born population - Other South Central Asia (%)
Place of birth for the foreign-born population - Burma (%)
Place of birth for the foreign-born population - Cambodia (%)
Place of birth for the foreign-born population - Indonesia (%)
Place of birth for the foreign-born population - Laos (%)
Place of birth for the foreign-born population - Malaysia (%)
Place of birth for the foreign-born population - Philippines (%)
Place of birth for the foreign-born population - Singapore (%)
Place of birth for the foreign-born population - Thailand (%)
Place of birth for the foreign-born population - Vietnam (%)
Place of birth for the foreign-born population - Other South Eastern Asia (%)
Place of birth for the foreign-born population - Armenia (%)
Place of birth for the foreign-born population - Iraq (%)
Place of birth for the foreign-born population - Israel (%)
Place of birth for the foreign-born population - Jordan (%)
Place of birth for the foreign-born population - Kuwait (%)
Place of birth for the foreign-born population - Lebanon (%)
Place of birth for the foreign-born population - Saudi Arabia (%)
Place of birth for the foreign-born population - Syria (%)
Place of birth for the foreign-born population - Turkey (%)
Place of birth for the foreign-born population - Yemen (%)
Place of birth for the foreign-born population - Other Western Asia (%)
Place of birth for the foreign-born population - Eritrea (%)
Place of birth for the foreign-born population - Ethiopia (%)
Place of birth for the foreign-born population - Kenya (%)
Place of birth for the foreign-born population - Somalia (%)
Place of birth for the foreign-born population - Uganda (%)
Place of birth for the foreign-born population - Zimbabwe (%)
Place of birth for the foreign-born population - Other Eastern Africa (%)
Place of birth for the foreign-born population - Cameroon (%)
Place of birth for the foreign-born population - Congo (%)
Place of birth for the foreign-born population - Democratic Republic of Congo (Zaire) (%)
Place of birth for the foreign-born population - Other Middle Africa (%)
Place of birth for the foreign-born population - Egypt (%)
Place of birth for the foreign-born population - Morocco (%)
Place of birth for the foreign-born population - Sudan (%)
Place of birth for the foreign-born population - Other Northern Africa (%)
Place of birth for the foreign-born population - South Africa (%)
Place of birth for the foreign-born population - Other Southern Africa (%)
Place of birth for the foreign-born population - Cabo Verde (%)
Place of birth for the foreign-born population - Ghana (%)
Place of birth for the foreign-born population - Liberia (%)
Place of birth for the foreign-born population - Nigeria (%)
Place of birth for the foreign-born population - Senegal (%)
Place of birth for the foreign-born population - Sierra Leone (%)
Place of birth for the foreign-born population - Other Western Africa (%)
Place of birth for the foreign-born population - Australia (%)
Place of birth for the foreign-born population - New Zealand (%)
Place of birth for the foreign-born population - Fiji (%)
Place of birth for the foreign-born population - Micronesia (%)
Place of birth for the foreign-born population - Bahamas (%)
Place of birth for the foreign-born population - Barbados (%)
Place of birth for the foreign-born population - Cuba (%)
Place of birth for the foreign-born population - Dominica (%)
Place of birth for the foreign-born population - Dominican Republic (%)
Place of birth for the foreign-born population - Grenada (%)
Place of birth for the foreign-born population - Haiti (%)
Place of birth for the foreign-born population - Jamaica (%)
Place of birth for the foreign-born population - St. Vincent and the Grenadines (%)
Place of birth for the foreign-born population - Trinidad and Tobago (%)
Place of birth for the foreign-born population - West Indies (%)
Place of birth for the foreign-born population - Other Caribbean (%)
Place of birth for the foreign-born population - Belize (%)
Place of birth for the foreign-born population - Costa Rica (%)
Place of birth for the foreign-born population - El Salvador (%)
Place of birth for the foreign-born population - Guatemala (%)
Place of birth for the foreign-born population - Honduras (%)
Place of birth for the foreign-born population - Mexico (%)
Place of birth for the foreign-born population - Nicaragua (%)
Place of birth for the foreign-born population - Panama (%)
Place of birth for the foreign-born population - Other Central America (%)
Place of birth for the foreign-born population - Argentina (%)
Place of birth for the foreign-born population - Bolivia (%)
Place of birth for the foreign-born population - Brazil (%)
Place of birth for the foreign-born population - Chile (%)
Place of birth for the foreign-born population - Colombia (%)
Place of birth for the foreign-born population - Ecuador (%)
Place of birth for the foreign-born population - Guyana (%)
Place of birth for the foreign-born population - Peru (%)
Place of birth for the foreign-born population - Uruguay (%)
Place of birth for the foreign-born population - Venezuela (%)
Place of birth for the foreign-born population - Other South America (%)
Place of birth for the foreign-born population - Canada (%)
Place of birth for the foreign-born population - Other Northern America (%)
Place of birth for the foreign-born population - Other (%)
Latest news about races in Pickerington, OH collected exclusively by city-data.com from local newspapers, TV, and radio stations
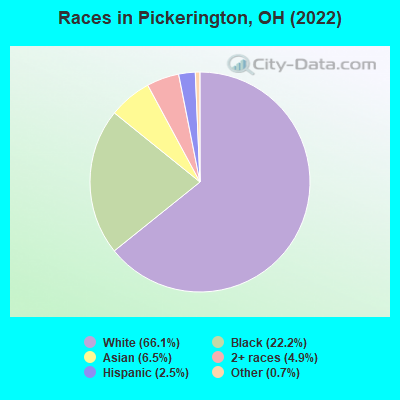
According to 2022 data, the most numerous races in Pickerington, OH are White alone (15,690 residents), Black alone (5,266 residents), and Two or more races (1,160 residents). 91.3% of Pickerington residents speak English at home. 6.1% of Pickerington, OH residents are foreign-born (4.0% born in Asia, 1.0% born in Africa), which is 35.0% greater than the foreign-born rate of 4.0% across the entire state of Ohio.
Race distribution in Pickerington
2000 2022
9,538,111 84.0% White alone 1,290,662 11.4% Black alone 217,123 1.9% Hispanic 137,770 1.2% Two or more races 131,670 1.2% Asian alone 21,985 0.2% American Indian alone 13,483 0.1% Other race alone 2,336 0.02% Native Hawaiian and Other
8,948,793 76.1% White alone 1,401,403 11.9% Black alone 529,291 4.5% Two or more races 517,232 4.4% Hispanic 293,387 2.5% Asian alone 52,805 0.4% Other race alone 9,785 0.08% American Indian alone 3,362 0.03% Native Hawaiian and Other
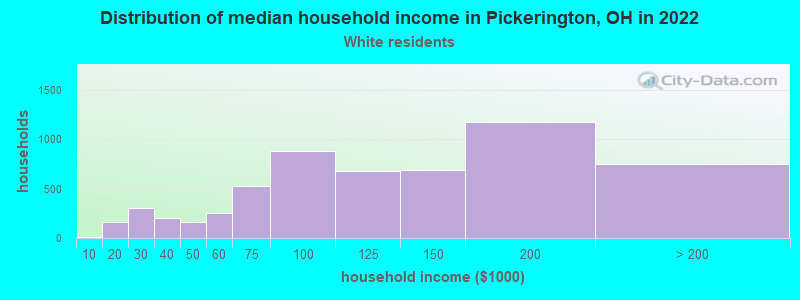
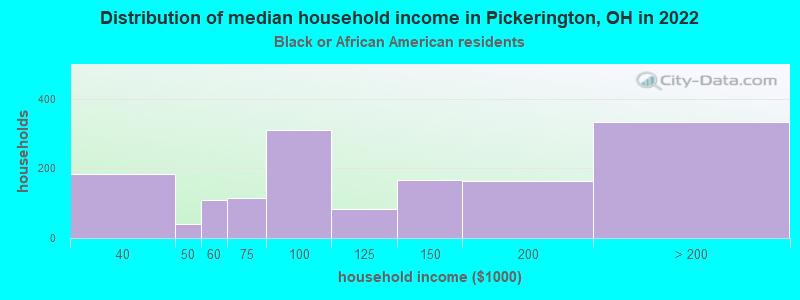
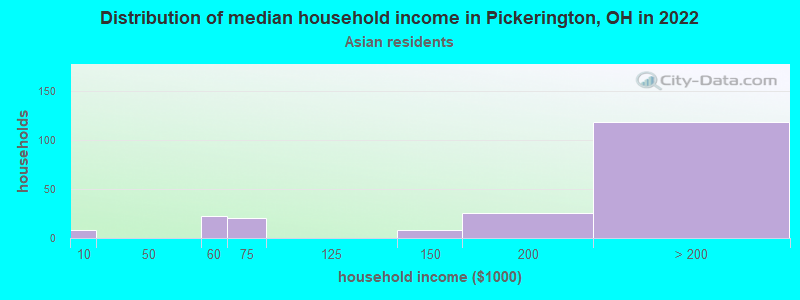
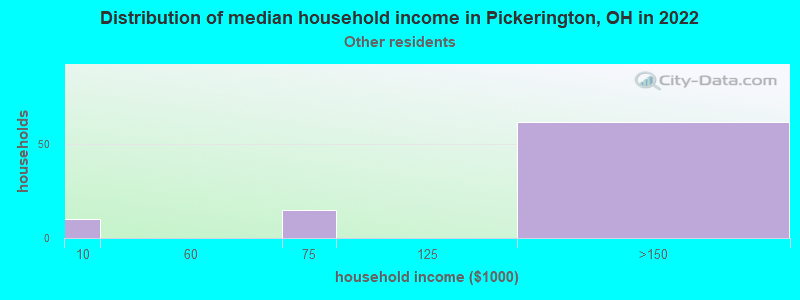
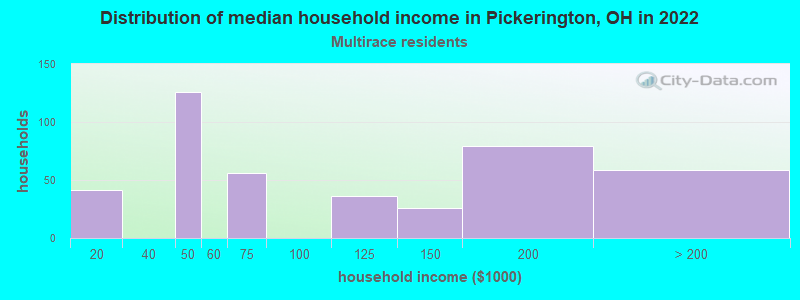
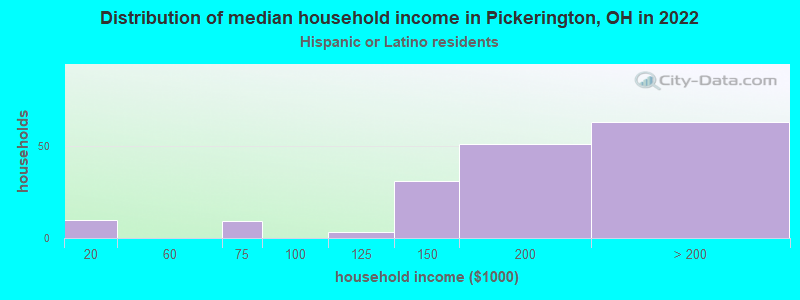
Income and house value in Pickerington Median household income in 2022 $113,381 White non-Hispanic householders$128,170 Black householdersover $200,000 Asian householders$126,531 Some other race householders$169,378 Hispanic or Latino race householdersMedian 2022 house value $321,286 White Non-Hispanic householders$414,828 Black or African American householders $415,063 Asian householders$233,620 Some other race householders$273,810 Hispanic or Latino householders
Median age by race in Pickerington
38.0 Median age for White residents35.1 38.7 32.4 Median age for Black or African American residents27.5 38.7 -676,818,950.3 Median age for American Indian / Alaska Native residents-685,185,184.5 -658,163,264.6 36.5 Median age for Asian residents25.5 37.8 -800,387,596.1 Median age for Native Hawaiian / Pacific Islander residents-666,666,666.0 -666,666,666.0 33.0 Median age for Other race residents29.1 24.4 20.0 Median age for Two or more races residents19.5 19.6 38.0 Median age for White alone residents35.2 38.7 27.9 Median age for Hispanic or Latino residents17.0 40.0
Owner/renter occupied households by race in Pickerington
House owners and renters - White residents 4,670 81.9% Owner occupied1,032 18.1% Renter occupiedHouse owners and renters - Black or African American residents 1,044 65.7% Owner occupied545 34.3% Renter occupiedHouse owners and renters - American Indian / Alaska Native residents 2 100.0% Owner occupiedHouse owners and renters - Asian residents 343 100.0% Owner occupiedHouse owners and renters - Other race residents 153 96.0% Owner occupied6 4.0% Renter occupiedHouse owners and renters - Two or more races residents 294 76.3% Owner occupied91 23.7% Renter occupiedHouse owners and renters - White alone residents 4,601 81.5% Owner occupied1,045 18.5% Renter occupiedHouse owners and renters - Hispanic or Latino residents 206 94.8% Owner occupied11 5.2% Renter occupied
Language usage in Pickerington
English speakers - Total 91.3% of residents of Pickerington speak English at home.
1.1% of residents speak Spanish at home 221 92.1% Speak English very well19 7.9% Speak English less than very well8.6% of residents speak other language at home 1,102 58.2% Speak English very well791 41.8% Speak English less than very well
English speakers - Born in the United States 94.5% of residents of Pickerington speak English at home.
1.7% of residents speak Spanish at home 81 85.3% Speak English very well14 14.7% Speak English less than very well1.7% of residents speak other language at home 98 100.0% Speak English very well
English speakers - Native, born elsewhere 69.2% of residents of Pickerington speak English at home.
37.4% of residents speak Spanish at home 34 85.0% Speak English very well6 15.0% Speak English less than very well27.1% of residents speak other language at home 29 100.0% Speak English very well
English speakers - Foreign-born 40.2% of residents of Pickerington speak English at home.
1.4% of residents speak Spanish at home 18 64.3% Speak English very well10 35.7% Speak English less than very well56.9% of residents speak other language at home 358 30.5% Speak English very well815 69.5% Speak English less than very well
White (Caucasian) - Speak only English Native:
97.6% (14,091)Foreign-born:
41.1% (148)
White (Caucasian) - Speak another language Native:
2.5% (365)Foreign-born:
53.6% (193)
Black or African American - Speak only English Native:
98.8% (4,005)Foreign-born:
60.4% (309)
Black or African American - Speak another language Native:
1.3% (52)Foreign-born:
43.3% (222)
Asian - Speak only English Native:
28.2% (160)Foreign-born:
22.4% (220)
Asian - Speak another language Native:
72.9% (414)Foreign-born:
69.7% (683)
Two or more races - Speak only English Native:
95.9% (1,549)Foreign-born:
57.8% (57)
Two or more races - Speak another language Native:
3.4% (55)Foreign-born:
33.0% (32)
White alone - Speak only English Native:
98.0% (13,980)Foreign-born:
32.9% (124)
White alone - Speak another language Native:
2.2% (314)Foreign-born:
58.4% (220)
Hispanic or Latino - Speak only English Native:
74.0% (292)Foreign-born:
45.1% (31)
Hispanic or Latino - Speak another language Native:
25.2% (99)Foreign-born:
49.5% (35)
Foreign-born residents in Pickerington 1,460 residents are foreign born (4.0% Asia , 1.0% Africa ).
Marital status for residents in Pickerington Marital status - White (Caucasian) population 15 years and over
Males 25.2% Never married64.6% Now married1.4% Separated2.7% Widowed6.2% DivorcedFemales 21.3% Never married59.3% Now married0.4% Separated4.8% Widowed14.2% DivorcedWomen who gave birth in the past 12 months Now married:
69.6% (156)Unmarried:
30.4% (68)
Women who did not give birth in the past 12 months Now married:
59.8% (2,313)Unmarried:
40.2% (1,556)
Marital status - Black or African American population 15 years and over
Males 52.9% Never married42.2% Now married3.4% Separated0.4% Widowed1.1% DivorcedFemales 26.6% Never married43.0% Now married13.9% Separated2.0% Widowed14.4% DivorcedWomen who gave birth in the past 12 months Now married:
50.7% (74)Unmarried:
49.3% (72)
Women who did not give birth in the past 12 months Now married:
57.2% (511)Unmarried:
42.8% (382)
Marital status - Asian population 15 years and over
Males 34.0% Never married66.0% Now married0.0% Separated0.0% Widowed0.0% DivorcedFemales 17.2% Never married36.4% Now married0.5% Separated37.8% Widowed8.2% DivorcedWomen who gave birth in the past 12 months Now married:
100.0% (4)Unmarried:
0.0% (0)
Women who did not give birth in the past 12 months Now married:
73.2% (131)Unmarried:
26.8% (48)
Marital status - Other race population 15 years and over
Males 39.0% Never married61.0% Now married0.0% Separated0.0% Widowed0.0% DivorcedFemales 30.0% Never married70.0% Now married0.0% Separated0.0% Widowed0.0% DivorcedWomen who did not give birth in the past 12 months Now married:
70.0% (55)Unmarried:
30.0% (24)
Marital status - Two or more races population 15 years and over
Males 51.0% Never married40.9% Now married0.0% Separated0.0% Widowed8.1% DivorcedFemales 64.0% Never married24.1% Now married0.0% Separated6.3% Widowed5.6% DivorcedWomen who gave birth in the past 12 months Now married:
100.0% (7)Unmarried:
0.0% (0)
Women who did not give birth in the past 12 months Now married:
12.2% (52)Unmarried:
87.8% (374)
Marital status - White alone, not Hispanic / Latino population 15 years and over
Males 25.1% Never married64.5% Now married1.4% Separated2.7% Widowed6.3% DivorcedFemales 21.2% Never married59.0% Now married0.4% Separated4.9% Widowed14.5% DivorcedWomen who gave birth in the past 12 months Now married:
69.6% (157)Unmarried:
30.4% (68)
Women who did not give birth in the past 12 months Now married:
59.3% (2,227)Unmarried:
40.7% (1,529)
Marital status - Hispanic or Latino population 15 years and over
Males 46.6% Never married53.4% Now married0.0% Separated0.0% Widowed0.0% DivorcedFemales 42.7% Never married57.3% Now married0.0% Separated0.0% Widowed0.0% DivorcedWomen who did not give birth in the past 12 months Now married:
50.7% (153)Unmarried:
49.3% (148)
Ancestries in Pickerington
1,055 10.2% German881 8.5% Irish832 8.0% English769 7.4% American476 4.6% European206 2.0% Italian189 1.8% Macedonian178 1.7% Russian166 1.6% Haitian159 1.5% Jamaican130 1.3% Polish127 1.2% Scottish95 0.9% Scotch-Irish76 0.7% Slovak73 0.7% African63 0.6% Palestinian60 0.6% Welsh54 0.5% Dutch46 0.4% Hungarian45 0.4% Scandinavian39 0.4% Eastern European34 0.3% British34 0.3% French23 0.2% Ethiopian22 0.2% Swedish21 0.2% French Canadian18 0.2% Greek16 0.2% Egyptian14 0.1% Norwegian14 0.1% Ukrainian11 0.1% Lithuanian5 0.05% Czechoslovakian3 0.03% Northern European
Geographical mobility in Pickerington Same house 1 year ago 13,771 88.0% White (Caucasian)4,245 97.6% Black or African American7 100.0% American Indian / Alaska Native979 88.3% Asian141 66.7% Other race1,481 79.0% Two or more races13,599 88.0% White alone, not Hispanic / Latino501 86.6% Hispanic or LatinoMoved within same county 427 2.7% White / Caucasian3 0.1% Black or African American421 2.7% White alone, not Hispanic / LatinoMoved within same state 1,106 7.1% White / Caucasian155 3.6% Black or African American165 14.9% Asian282 15.0% Two or more races1,092 7.1% White alone, not Hispanic / Latino29 5.0% Hispanic or LatinoMoved from different state 256 1.6% White / Caucasian70 33.4% Other race82 4.4% Two or more races259 1.7% White alone, not Hispanic / Latino55 9.6% Hispanic or LatinoMoved from abroad 10 0.2% Black or African American
Children Nativity (place of birth) in Pickerington
Children under 6 years - Living with two parents Both parents native 1,067 100.0% NativeBoth parents foreign-born 191 81.6% Native43 18.4% Foreign-bornOne native, one foreign-born parent 27 100.0% NativeChildren under 6 years - Living with one parent Native parent 537 100.0% NativeForeign-born parent 121 100.0% NativeChildren 6 to 17 years - Living with two parents Both parents native 2,229 100.0% NativeBoth parents foreign-born 257 80.0% Native64 20.0% Foreign-bornOne native, one foreign-born parent 83 100.0% NativeChildren 6 to 17 years - Living with one parent Native parent 1,105 100.0% NativeForeign-born parent 465 71.6% Native184 28.4% Foreign-born
Grandparents responsible for own grandchildren in Pickerington
Grandparents (30 to 59 years) White / Caucasian 14 41.1% Responsible for grandchildren20 58.9% Not responsible for grandchildrenBlack or African American 112 100.0% Not responsible for grandchildrenWhite alone, not Hispanic / Latino 14 40.2% Responsible for grandchildren21 59.8% Not responsible for grandchildrenGrandparents (60 years and over) White / Caucasian 12 64.6% Responsible for grandchildren7 35.4% Not responsible for grandchildrenBlack or African American 75 71.0% Responsible for grandchildren31 29.0% Not responsible for grandchildrenWhite alone, not Hispanic / Latino 12 63.7% Responsible for grandchildren7 36.3% Not responsible for grandchildren