Races in Reserve Township, Pennsylvania (PA) Detailed Stats
Ancestries, Foreign-born residents, place of birth

Recent posts about races in Reserve Township, Pennsylvania on our local forum with over 2,400,000 registered users:
 | Why is Pittsburgh so cheap in 2022? (70 replies) |
| Moving to Pittsburgh, House hunting (44 replies) |
| Amazon is looking for a second HQ. Why not, Pittsburgh? (2091 replies) |
| PA House vote on Transportation Funding Bill FAILS (82 replies) |
| A rental house in Mars (73 replies) |
| Suburb of the week: Pine Township (36 replies) |
1.2% of Reserve Township, PA residents are foreign-born , which is 486.8% less than the foreign-born rate of 7.0% across the entire state of Pennsylvania.
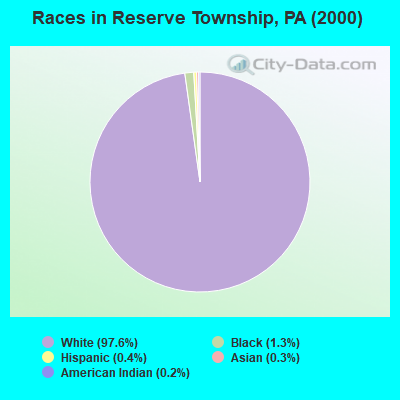
Race distribution in Reserve Township

- 3,76597.6%White alone
- 521.3%Black alone
- 170.4%Hispanic
- 110.3%Asian alone
- 70.2%American Indian alone
- 30.08%Two or more races
- 10.03%Other race alone
2000
2022
-
- 10,322,45584.1%White alone
- 1,202,4379.8%Black alone
- 394,0883.2%Hispanic
- 218,2961.8%Asian alone
- 113,0970.9%Two or more races
- 13,0860.1%Other race alone
- 14,9040.1%American Indian alone
- 2,6910.02%Native Hawaiian and Other
Pacific Islander alone

-
- 9,487,22873.1%White alone
- 1,311,58110.1%Black alone
- 1,115,9978.6%Hispanic
- 493,9423.8%Two or more races
- 487,1243.8%Asian alone
- 63,5820.5%Other race alone
- 10,1300.08%American Indian alone
- 2,4240.02%Native Hawaiian and Other
Pacific Islander alone

Income and house value in Reserve Township
- Median household income in 2022
- $74,610White non-Hispanic householders
- $108,846Black householders
- $25,878Asian householders
- Median 2022 house value
- $220,372White Non-Hispanic householders
- $189,307Black or African American householders
- $540,576Asian householders
Household income for White non-Hispanic householders

Household income for Black householders

Household income for Asian householders

Foreign-born residents in Reserve Township
46 residents are foreign born
| This city: | 1.2% |
| Pennsylvania: | 4.1% |
Ancestries in Reserve Township

- 1,95241.5%German
- 74715.9%Irish
- 4559.7%Other
- 4349.2%Italian
- 3066.5%Polish
- 1362.9%English
- 1172.5%French
- 1012.1%Czech
- 731.6%United States
- 711.5%Slovak
- 671.4%Lithuanian
- 501.1%Scottish
- 420.9%Swiss
- 360.8%Russian
- 310.7%Scotch-Irish
- 230.5%Hungarian
- 230.5%Swedish
- 150.3%Welsh
- 130.3%Ukrainian
- 60.1%Greek
- 40.09%Danish

Zip codes: 15212.