Races in Richmond, Vermont (VT) Detailed Stats
Ancestries, Foreign-born residents, place of birth

Data:
Latest news about races in Richmond, VT collected exclusively by city-data.com from local newspapers, TV, and radio stations
1.6% of Richmond, VT residents are foreign-born , which is 151.7% less than the foreign-born rate of 4.0% across the entire state of Vermont.
Race distribution in Richmond

- 4,00297.8%White alone
- 340.8%Hispanic
- 300.7%Two or more races
- 180.4%Asian alone
- 30.07%American Indian alone
- 20.05%Black alone
- 10.02%Native Hawaiian and Other
Pacific Islander alone
2000
2022
-
- 585,43196.2%White alone
- 6,8091.1%Two or more races
- 5,5040.9%Hispanic
- 5,1600.8%Asian alone
- 2,9210.5%Black alone
- 2,3250.4%American Indian alone
- 5570.09%Other race alone
- 1200.02%Native Hawaiian and Other
Pacific Islander alone
-
- 583,54690.2%White alone
- 27,3404.2%Two or more races
- 14,7702.3%Hispanic
- 11,5121.8%Asian alone
- 6,2641.0%Black alone
- 2,5210.4%Other race alone
- 1,0520.2%American Indian alone
- 590.01%Native Hawaiian and Other
Pacific Islander alone
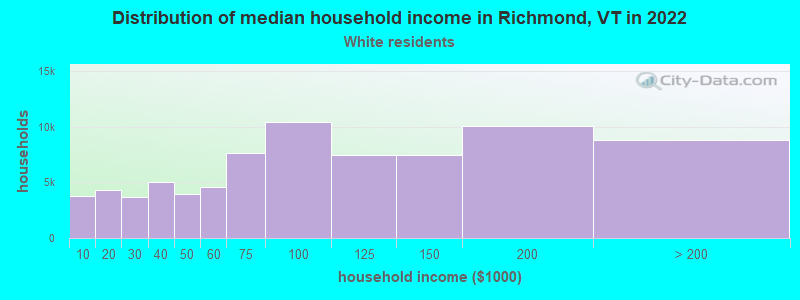
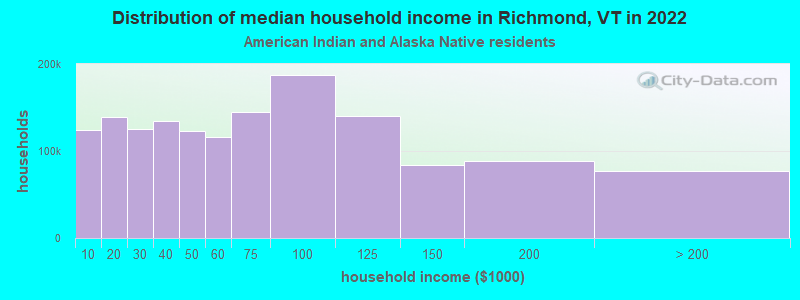
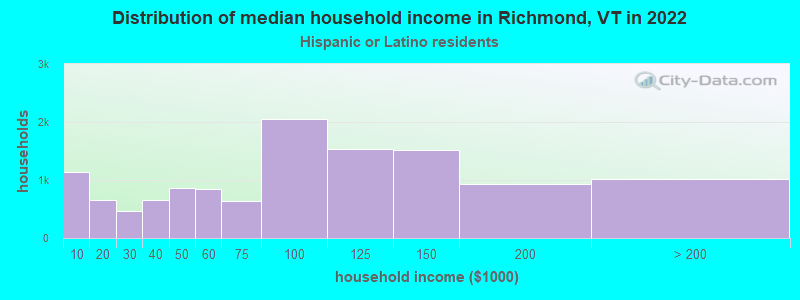
Income and house value in Richmond
- Median household income in 2022
- $104,695White non-Hispanic householders
- over $200,000Hispanic or Latino race householders
- Median 2022 house value
- $421,251White Non-Hispanic householders
Foreign-born residents in Richmond
65 residents are foreign born
| This city: | 1.6% |
| Vermont: | 3.8% |
Ancestries in Richmond

- 82216.8%English
- 77315.8%Irish
- 54511.1%French Canadian
- 53110.8%Other
- 4639.4%German
- 4048.2%French
- 2845.8%Scottish
- 2364.8%United States
- 2134.3%Italian
- 1422.9%Polish
- 1002.0%Scotch-Irish
- 951.9%Swedish
- 651.3%Welsh
- 511.0%Russian
- 370.8%Greek
- 370.8%Norwegian
- 330.7%Dutch
- 310.6%Swiss
- 200.4%Czech
- 160.3%Danish
- 50.1%Hungarian