Races in Rock Lake, Washington (WA) Detailed Stats
Ancestries, Foreign-born residents, place of birth
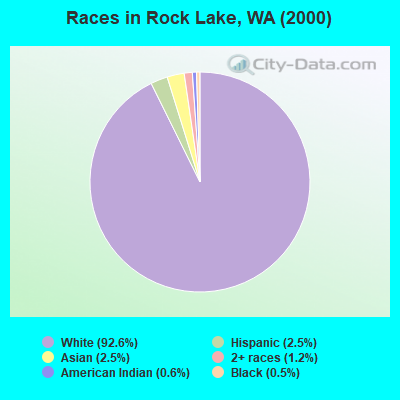
Race distribution in Rock Lake

- 2,05492.6%White alone
- 562.5%Hispanic
- 552.5%Asian alone
- 261.2%Two or more races
- 130.6%American Indian alone
- 120.5%Black alone
- 10.05%Native Hawaiian and Other
Pacific Islander alone
2000
2022
-
- 4,652,49078.9%White alone
- 441,5097.5%Hispanic
- 319,4015.4%Asian alone
- 184,6313.1%Black alone
- 175,9263.0%Two or more races
- 85,3961.4%American Indian alone
- 22,7790.4%Native Hawaiian and Other
Pacific Islander alone - 11,9890.2%Other race alone

-
- 4,941,45663.5%White alone
- 1,093,31314.0%Hispanic
- 755,8329.7%Asian alone
- 523,4486.7%Two or more races
- 299,5373.8%Black alone
- 69,0240.9%American Indian alone
- 52,2310.7%Native Hawaiian and Other
Pacific Islander alone - 50,9450.7%Other race alone

Income and house value in Rock Lake
- Median household income in 2022
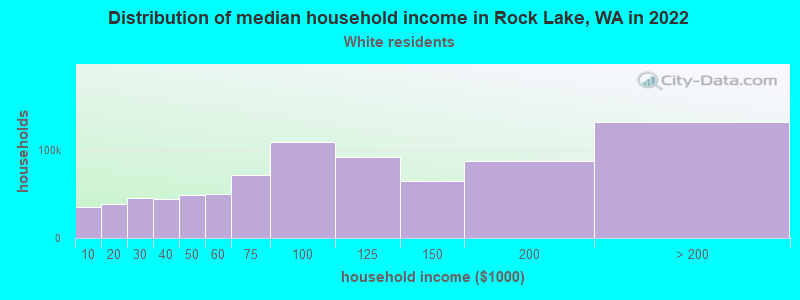
- $65,532White non-Hispanic householders
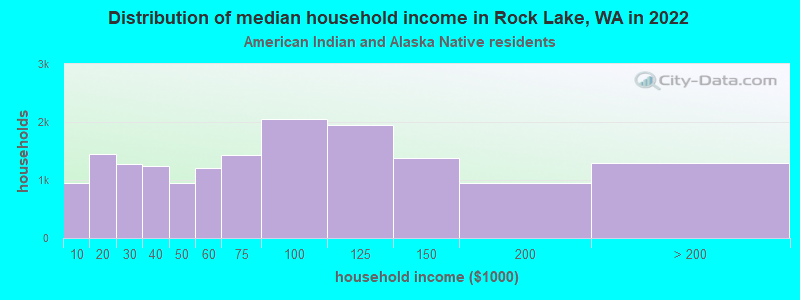
- $66,641American Indian and Alaska Native householders
- $45,453Some other race householders
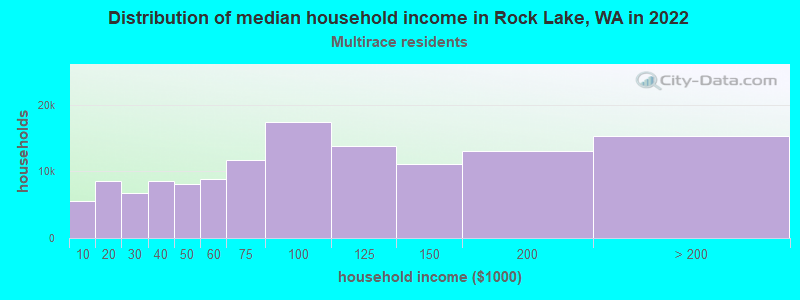
- $80,210Two or more races householders
- $95,922Hispanic or Latino race householders
- Median 2022 house value
- $244,289White Non-Hispanic householders
- $277,230Some other race householders
- $277,230Hispanic or Latino householders
Household income for White non-Hispanic householders
Household income for American Indian and Alaska Native householders
Household income for Two or more races householders
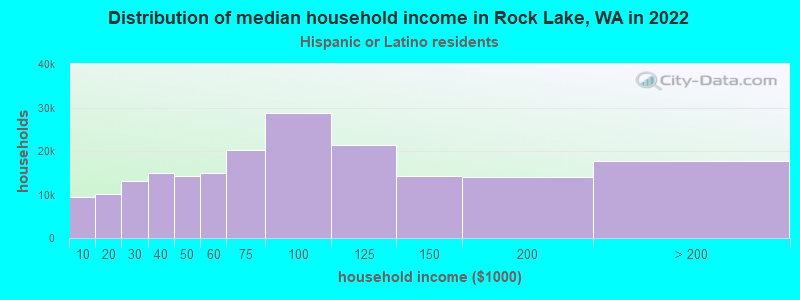
Household income for Hispanic or Latino race householders
Zip code: 99171