Races in Round Lake, Illinois (IL) Detailed Stats
Data:
Races - White alone (%)
Races - White alone (% change since 2000)
Races - Black alone (%)
Races - Black alone (% change since 2000)
Races - American Indian alone (%)
Races - American Indian alone (% change since 2000)
Races - Asian alone (%)
Races - Asian alone (% change since 2000)
Races - Hispanic (%)
Races - Hispanic (% change since 2000)
Races - Native Hawaiian and Other Pacific Islander alone (%)
Races - Native Hawaiian and Other Pacific Islander alone (% change since 2000)
Races - Two or more races(%)
Races - Two or more races(% change since 2000)
Races - Other race alone (%)
Races - Other race alone (% change since 2000)
Racial diversity
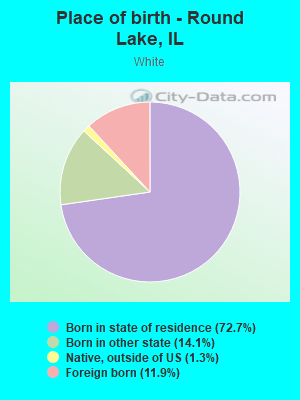
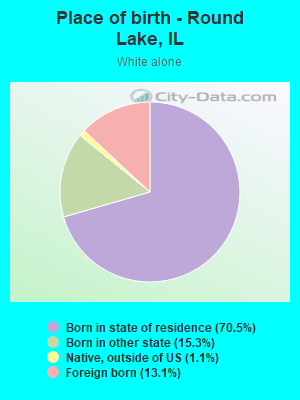
Place of birth - Born in state of residence (%)
Place of birth - Born in state of residence (%) - White
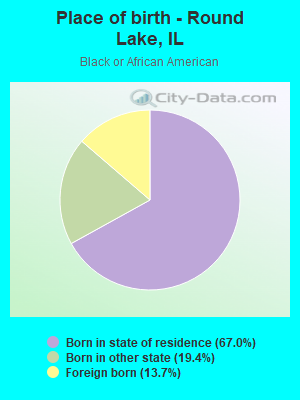
Place of birth - Born in state of residence (%) - Black or African American
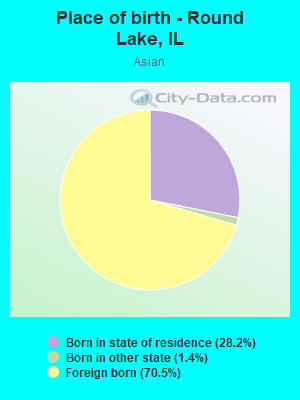
Place of birth - Born in state of residence (%) - Asian
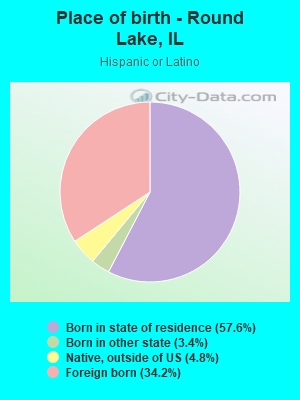
Place of birth - Born in state of residence (%) - Hispanic or Latino
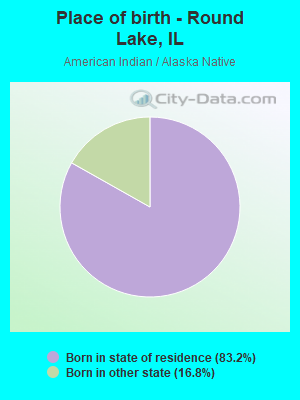
Place of birth - Born in state of residence (%) - American Indian and Alaska Native
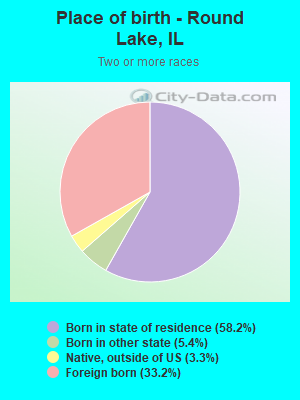
Place of birth - Born in state of residence (%) - Multirace
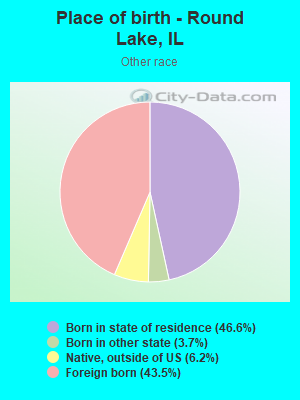
Place of birth - Born in state of residence (%) - Other Race
Place of birth - Born in other state (%)
Place of birth - Born in other state (%) - White
Place of birth - Born in other state (%) - Black or African American
Place of birth - Born in other state (%) - Asian
Place of birth - Born in other state (%) - Hispanic or Latino
Place of birth - Born in other state (%) - American Indian and Alaska Native
Place of birth - Born in other state (%) - Multirace
Place of birth - Born in other state (%) - Other Race
Place of birth - Native, outside of US (%)
Place of birth - Native, outside of US (%) - White
Place of birth - Native, outside of US (%) - Black or African American
Place of birth - Native, outside of US (%) - Asian
Place of birth - Native, outside of US (%) - Hispanic or Latino
Place of birth - Native, outside of US (%) - American Indian and Alaska Native
Place of birth - Native, outside of US (%) - Multirace
Place of birth - Native, outside of US (%) - Other Race
Place of birth - Foreign born (%)
Place of birth - Foreign born (%) - White
Place of birth - Foreign born (%) - Black or African American
Place of birth - Foreign born (%) - Asian
Place of birth - Foreign born (%) - Hispanic or Latino
Place of birth - Foreign born (%) - American Indian and Alaska Native
Place of birth - Foreign born (%) - Multirace
Place of birth - Foreign born (%) - Other Race
Residents speaking English at home (%)
Residents speaking English at home - Born in the United States (%)
Residents speaking English at home - Native, born elsewhere (%)
Residents speaking English at home - Foreign born (%)
Residents speaking Spanish at home (%)
Residents speaking Spanish at home - Born in the United States (%)
Residents speaking Spanish at home - Native, born elsewhere (%)
Residents speaking Spanish at home - Foreign born (%)
Residents speaking other language at home (%)
Residents speaking other language at home - Born in the United States (%)
Residents speaking other language at home - Native, born elsewhere (%)
Residents speaking other language at home - Foreign born (%)
Marital status - Never married (%)
Marital status - Now married (%)
Marital status - Separated (%)
Marital status - Widowed (%)
Marital status - Divorced (%)
Ancestries Reported - Arab (%)
Ancestries Reported - Czech (%)
Ancestries Reported - Danish (%)
Ancestries Reported - Dutch (%)
Ancestries Reported - English (%)
Ancestries Reported - French (%)
Ancestries Reported - French Canadian (%)
Ancestries Reported - German (%)
Ancestries Reported - Greek (%)
Ancestries Reported - Hungarian (%)
Ancestries Reported - Irish (%)
Ancestries Reported - Italian (%)
Ancestries Reported - Lithuanian (%)
Ancestries Reported - Norwegian (%)
Ancestries Reported - Polish (%)
Ancestries Reported - Portuguese (%)
Ancestries Reported - Russian (%)
Ancestries Reported - Scotch-Irish (%)
Ancestries Reported - Scottish (%)
Ancestries Reported - Slovak (%)
Ancestries Reported - Subsaharan African (%)
Ancestries Reported - Swedish (%)
Ancestries Reported - Swiss (%)
Ancestries Reported - Ukrainian (%)
Ancestries Reported - United States (%)
Ancestries Reported - Welsh (%)
Ancestries Reported - West Indian (%)
Ancestries Reported - Other (%)
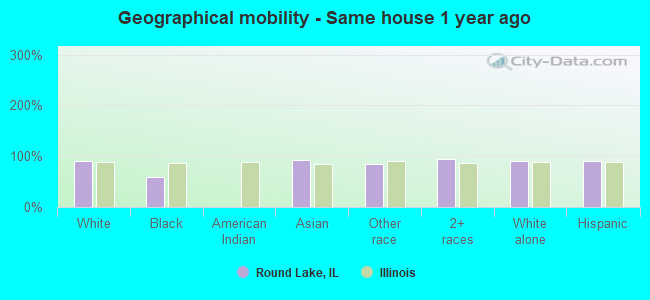
Geographical mobility - Same house 1 year ago (%)
Geographical mobility - Same house 1 year ago (%) - White
Geographical mobility - Same house 1 year ago (%) - Black or African American
Geographical mobility - Same house 1 year ago (%) - Asian
Geographical mobility - Same house 1 year ago (%) - Hispanic or Latino
Geographical mobility - Same house 1 year ago (%) - American Indian and Alaska Native
Geographical mobility - Same house 1 year ago (%) - Multirace
Geographical mobility - Same house 1 year ago (%) - Other Race
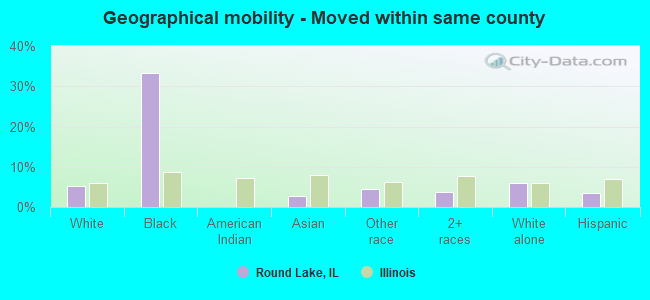
Geographical mobility - Moved within same county (%)
Geographical mobility - Moved within same county (%) - White
Geographical mobility - Moved within same county (%) - Black or African American
Geographical mobility - Moved within same county (%) - Asian
Geographical mobility - Moved within same county (%) - Hispanic or Latino
Geographical mobility - Moved within same county (%) - American Indian and Alaska Native
Geographical mobility - Moved within same county (%) - Multirace
Geographical mobility - Moved within same county (%) - Other Race
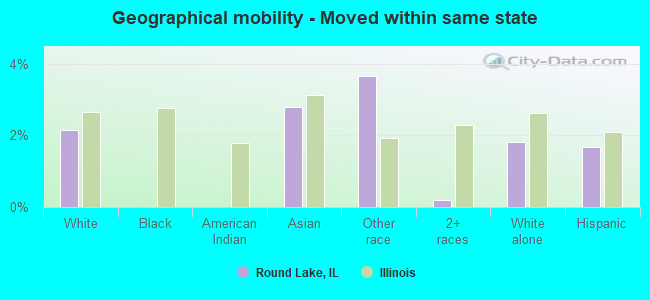
Geographical mobility - Moved from different county within same state (%)
Geographical mobility - Moved from different county within same state (%) - White
Geographical mobility - Moved from different county within same state (%) - Black or African American
Geographical mobility - Moved from different county within same state (%) - Asian
Geographical mobility - Moved from different county within same state (%) - Hispanic or Latino
Geographical mobility - Moved from different county within same state (%) - American Indian and Alaska Native
Geographical mobility - Moved from different county within same state (%) - Multirace
Geographical mobility - Moved from different county within same state (%) - Other Race
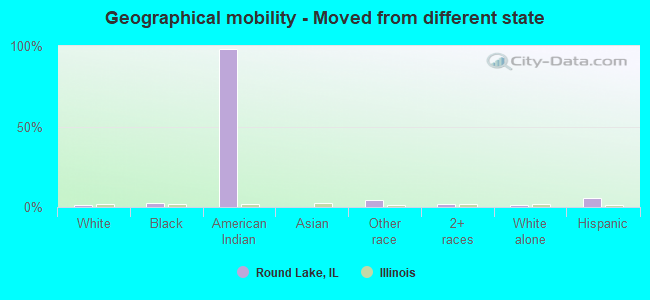
Geographical mobility - Moved from different state (%)
Geographical mobility - Moved from different state (%) - White
Geographical mobility - Moved from different state (%) - Black or African American
Geographical mobility - Moved from different state (%) - Asian
Geographical mobility - Moved from different state (%) - Hispanic or Latino
Geographical mobility - Moved from different state (%) - American Indian and Alaska Native
Geographical mobility - Moved from different state (%) - Multirace
Geographical mobility - Moved from different state (%) - Other Race
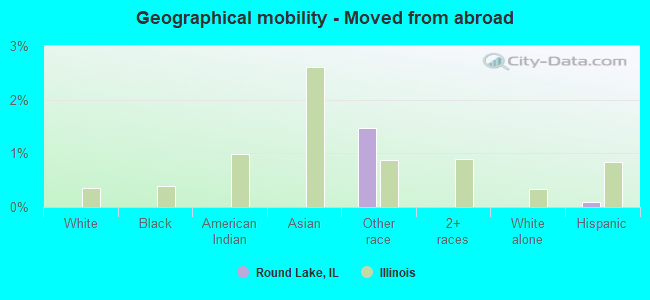
Geographical mobility - Moved from abroad (%)
Geographical mobility - Moved from abroad (%) - White
Geographical mobility - Moved from abroad (%) - Black or African American
Geographical mobility - Moved from abroad (%) - Asian
Geographical mobility - Moved from abroad (%) - Hispanic or Latino
Geographical mobility - Moved from abroad (%) - American Indian and Alaska Native
Geographical mobility - Moved from abroad (%) - Multirace
Geographical mobility - Moved from abroad (%) - Other Race
Place of birth for the foreign-born population - Ireland (%)
Place of birth for the foreign-born population - Denmark (%)
Place of birth for the foreign-born population - Norway (%)
Place of birth for the foreign-born population - Sweden (%)
Place of birth for the foreign-born population - United Kingdom (%)
Place of birth for the foreign-born population - England (%)
Place of birth for the foreign-born population - Scotland (%)
Place of birth for the foreign-born population - Other Northern Europe (%)
Place of birth for the foreign-born population - Austria (%)
Place of birth for the foreign-born population - Belgium (%)
Place of birth for the foreign-born population - France (%)
Place of birth for the foreign-born population - Germany (%)
Place of birth for the foreign-born population - Netherlands (%)
Place of birth for the foreign-born population - Switzerland (%)
Place of birth for the foreign-born population - Other Western Europe (%)
Place of birth for the foreign-born population - Greece (%)
Place of birth for the foreign-born population - Italy (%)
Place of birth for the foreign-born population - Portugal (%)
Place of birth for the foreign-born population - Spain (%)
Place of birth for the foreign-born population - Other Southern Europe (%)
Place of birth for the foreign-born population - Albania (%)
Place of birth for the foreign-born population - Belarus (%)
Place of birth for the foreign-born population - Bosnia and Herzegovina (%)
Place of birth for the foreign-born population - Bulgaria (%)
Place of birth for the foreign-born population - Croatia (%)
Place of birth for the foreign-born population - Czechoslovakia (%)
Place of birth for the foreign-born population - Hungary (%)
Place of birth for the foreign-born population - Latvia (%)
Place of birth for the foreign-born population - Lithuania (%)
Place of birth for the foreign-born population - North Macedonia (Macedonia) (%)
Place of birth for the foreign-born population - Moldova (%)
Place of birth for the foreign-born population - Poland (%)
Place of birth for the foreign-born population - Romania (%)
Place of birth for the foreign-born population - Russia (%)
Place of birth for the foreign-born population - Serbia (%)
Place of birth for the foreign-born population - Ukraine (%)
Place of birth for the foreign-born population - Other Eastern Europe (%)
Place of birth for the foreign-born population - China (%)
Place of birth for the foreign-born population - Hong Kong (%)
Place of birth for the foreign-born population - Taiwan (%)
Place of birth for the foreign-born population - Japan (%)
Place of birth for the foreign-born population - Korea (%)
Place of birth for the foreign-born population - Other Eastern Asia (%)
Place of birth for the foreign-born population - Afghanistan (%)
Place of birth for the foreign-born population - Bangladesh (%)
Place of birth for the foreign-born population - India (%)
Place of birth for the foreign-born population - Iran (%)
Place of birth for the foreign-born population - Kazakhstan (%)
Place of birth for the foreign-born population - Nepal (%)
Place of birth for the foreign-born population - Pakistan (%)
Place of birth for the foreign-born population - Sri Lanka (%)
Place of birth for the foreign-born population - Uzbekistan (%)
Place of birth for the foreign-born population - Other South Central Asia (%)
Place of birth for the foreign-born population - Burma (%)
Place of birth for the foreign-born population - Cambodia (%)
Place of birth for the foreign-born population - Indonesia (%)
Place of birth for the foreign-born population - Laos (%)
Place of birth for the foreign-born population - Malaysia (%)
Place of birth for the foreign-born population - Philippines (%)
Place of birth for the foreign-born population - Singapore (%)
Place of birth for the foreign-born population - Thailand (%)
Place of birth for the foreign-born population - Vietnam (%)
Place of birth for the foreign-born population - Other South Eastern Asia (%)
Place of birth for the foreign-born population - Armenia (%)
Place of birth for the foreign-born population - Iraq (%)
Place of birth for the foreign-born population - Israel (%)
Place of birth for the foreign-born population - Jordan (%)
Place of birth for the foreign-born population - Kuwait (%)
Place of birth for the foreign-born population - Lebanon (%)
Place of birth for the foreign-born population - Saudi Arabia (%)
Place of birth for the foreign-born population - Syria (%)
Place of birth for the foreign-born population - Turkey (%)
Place of birth for the foreign-born population - Yemen (%)
Place of birth for the foreign-born population - Other Western Asia (%)
Place of birth for the foreign-born population - Eritrea (%)
Place of birth for the foreign-born population - Ethiopia (%)
Place of birth for the foreign-born population - Kenya (%)
Place of birth for the foreign-born population - Somalia (%)
Place of birth for the foreign-born population - Uganda (%)
Place of birth for the foreign-born population - Zimbabwe (%)
Place of birth for the foreign-born population - Other Eastern Africa (%)
Place of birth for the foreign-born population - Cameroon (%)
Place of birth for the foreign-born population - Congo (%)
Place of birth for the foreign-born population - Democratic Republic of Congo (Zaire) (%)
Place of birth for the foreign-born population - Other Middle Africa (%)
Place of birth for the foreign-born population - Egypt (%)
Place of birth for the foreign-born population - Morocco (%)
Place of birth for the foreign-born population - Sudan (%)
Place of birth for the foreign-born population - Other Northern Africa (%)
Place of birth for the foreign-born population - South Africa (%)
Place of birth for the foreign-born population - Other Southern Africa (%)
Place of birth for the foreign-born population - Cabo Verde (%)
Place of birth for the foreign-born population - Ghana (%)
Place of birth for the foreign-born population - Liberia (%)
Place of birth for the foreign-born population - Nigeria (%)
Place of birth for the foreign-born population - Senegal (%)
Place of birth for the foreign-born population - Sierra Leone (%)
Place of birth for the foreign-born population - Other Western Africa (%)
Place of birth for the foreign-born population - Australia (%)
Place of birth for the foreign-born population - New Zealand (%)
Place of birth for the foreign-born population - Fiji (%)
Place of birth for the foreign-born population - Micronesia (%)
Place of birth for the foreign-born population - Bahamas (%)
Place of birth for the foreign-born population - Barbados (%)
Place of birth for the foreign-born population - Cuba (%)
Place of birth for the foreign-born population - Dominica (%)
Place of birth for the foreign-born population - Dominican Republic (%)
Place of birth for the foreign-born population - Grenada (%)
Place of birth for the foreign-born population - Haiti (%)
Place of birth for the foreign-born population - Jamaica (%)
Place of birth for the foreign-born population - St. Vincent and the Grenadines (%)
Place of birth for the foreign-born population - Trinidad and Tobago (%)
Place of birth for the foreign-born population - West Indies (%)
Place of birth for the foreign-born population - Other Caribbean (%)
Place of birth for the foreign-born population - Belize (%)
Place of birth for the foreign-born population - Costa Rica (%)
Place of birth for the foreign-born population - El Salvador (%)
Place of birth for the foreign-born population - Guatemala (%)
Place of birth for the foreign-born population - Honduras (%)
Place of birth for the foreign-born population - Mexico (%)
Place of birth for the foreign-born population - Nicaragua (%)
Place of birth for the foreign-born population - Panama (%)
Place of birth for the foreign-born population - Other Central America (%)
Place of birth for the foreign-born population - Argentina (%)
Place of birth for the foreign-born population - Bolivia (%)
Place of birth for the foreign-born population - Brazil (%)
Place of birth for the foreign-born population - Chile (%)
Place of birth for the foreign-born population - Colombia (%)
Place of birth for the foreign-born population - Ecuador (%)
Place of birth for the foreign-born population - Guyana (%)
Place of birth for the foreign-born population - Peru (%)
Place of birth for the foreign-born population - Uruguay (%)
Place of birth for the foreign-born population - Venezuela (%)
Place of birth for the foreign-born population - Other South America (%)
Place of birth for the foreign-born population - Canada (%)
Place of birth for the foreign-born population - Other Northern America (%)
Place of birth for the foreign-born population - Other (%)
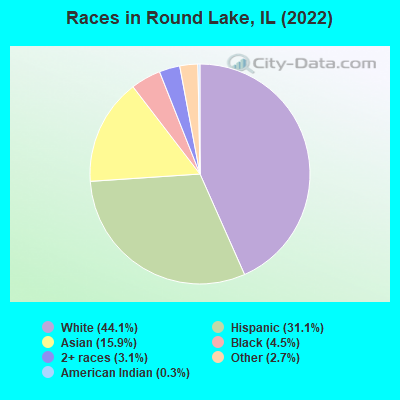
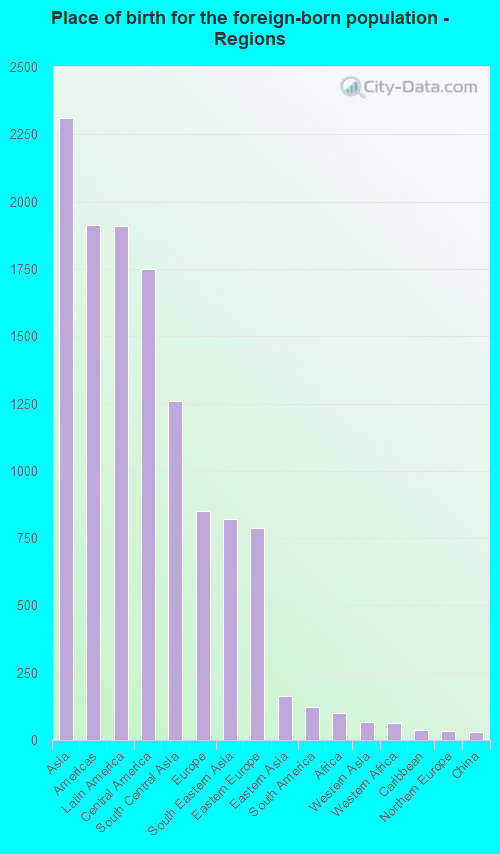
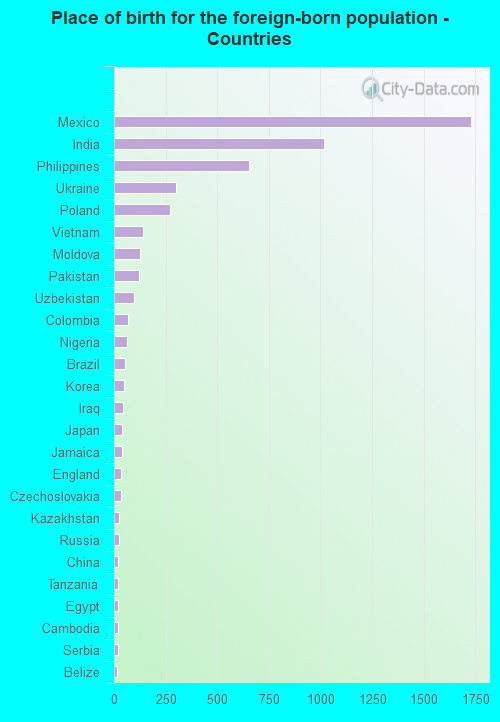
According to 2022 data, the most numerous races in Round Lake, IL are White alone (8,197 residents), Hispanic (5,771 residents), and Black alone (842 residents). 56.0% of Round Lake residents speak English at home. 27.9% of Round Lake, IL residents are foreign-born (12.3% born in Asia, 10.2% born in Latin America, 4.5% born in Europe), which is 49.8% greater than the foreign-born rate of 14.0% across the entire state of Illinois.
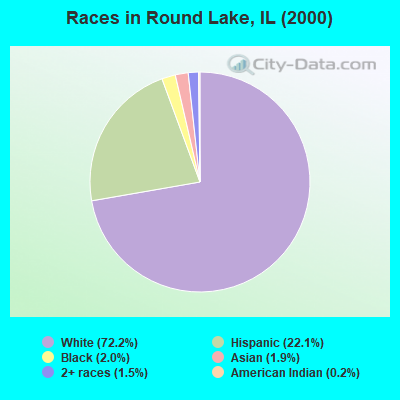
Race distribution in Round Lake
2000 2022
8,424,140 67.8% White alone 1,856,152 14.9% Black alone 1,530,262 12.3% Hispanic 419,916 3.4% Asian alone 153,996 1.2% Two or more races 13,479 0.1% Other race alone 18,232 0.1% American Indian alone 3,116 0.03% Native Hawaiian and Other
7,356,301 58.5% White alone 2,299,726 18.3% Hispanic 1,660,423 13.2% Black alone 747,296 5.9% Asian alone 458,599 3.6% Two or more races 45,386 0.4% Other race alone 10,405 0.08% American Indian alone 3,896 0.03% Native Hawaiian and Other
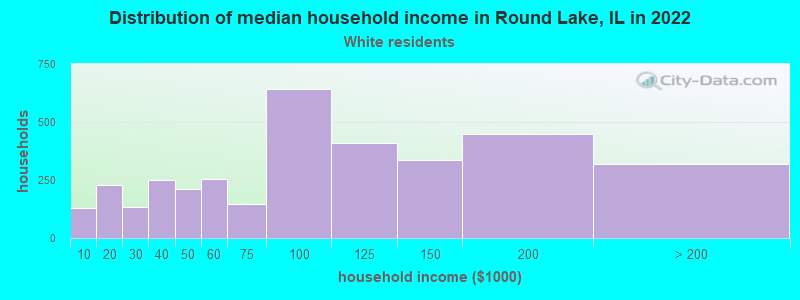
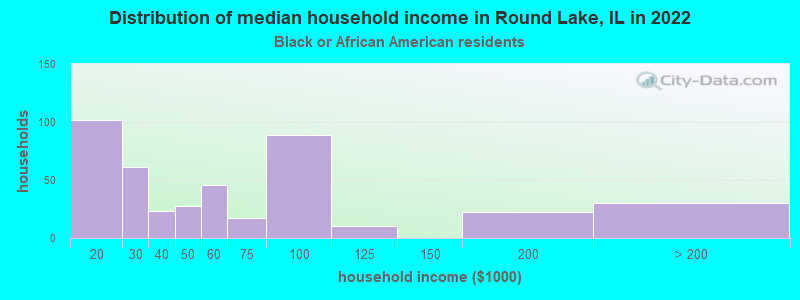
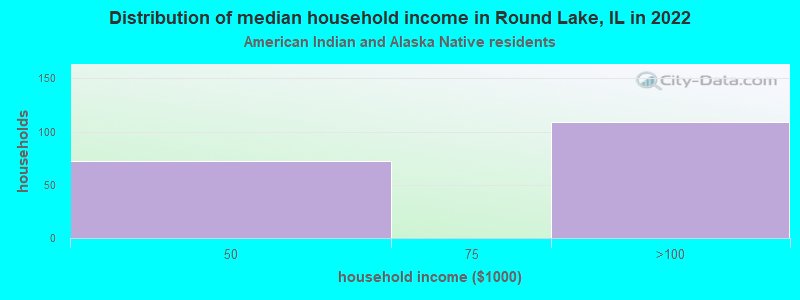
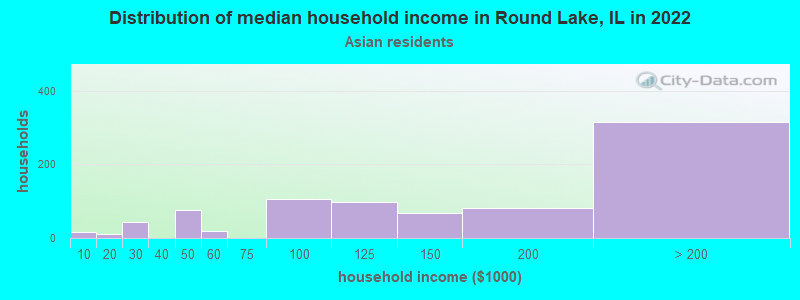
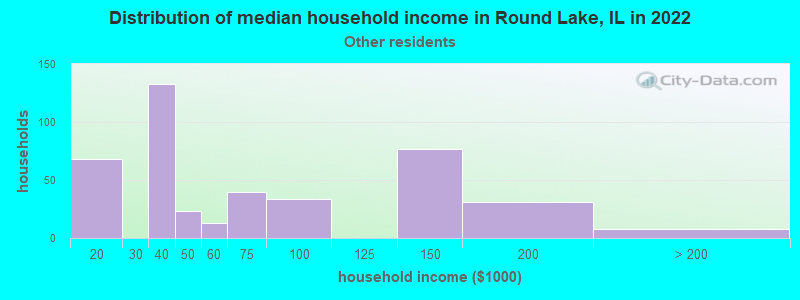
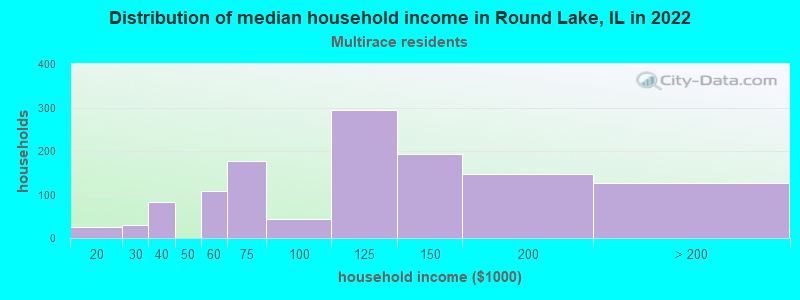
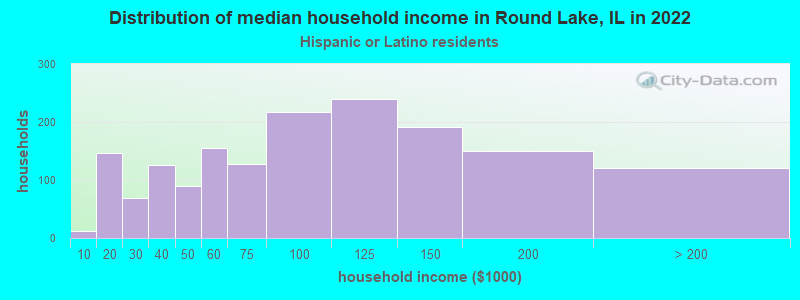
Income and house value in Round Lake Median household income in 2022 $91,143 White non-Hispanic householders$57,684 Black householders$141,899 Asian householders$82,408 Some other race householders$113,633 Two or more races householders$86,676 Hispanic or Latino race householdersMedian 2022 house value $283,861 White Non-Hispanic householders$306,780 Black or African American householders$84,538 American Indian or Alaska Native householders $387,937 Asian householders$227,878 Some other race householders$305,277 Two or more races householders$244,973 Hispanic or Latino householders
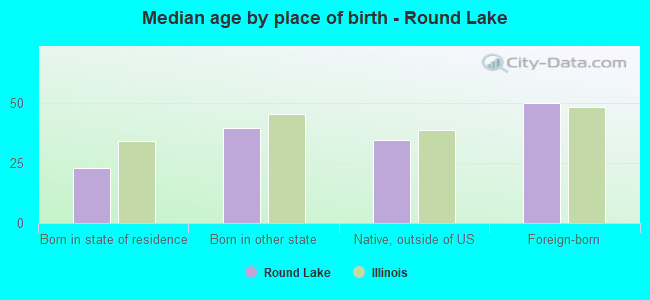
Median age by race in Round Lake
36.6 Median age for White residents35.0 38.4 33.0 Median age for Black or African American residents25.4 35.8 36.5 Median age for American Indian / Alaska Native residents-671,532,846.0 5.3 41.1 Median age for Asian residents42.4 38.2 -593,236,714.4 Median age for Native Hawaiian / Pacific Islander residents-658,536,584.7 -576,015,108.0 39.3 Median age for Other race residents35.7 44.7 27.2 Median age for Two or more races residents27.8 27.3 37.8 Median age for White alone residents35.5 40.5 29.1 Median age for Hispanic or Latino residents30.4 27.4
Owner/renter occupied households by race in Round Lake
House owners and renters - White residents 2,524 72.4% Owner occupied964 27.6% Renter occupiedHouse owners and renters - Black or African American residents 143 38.2% Owner occupied230 61.8% Renter occupiedHouse owners and renters - American Indian / Alaska Native residents 86 43.5% Owner occupied112 56.5% Renter occupiedHouse owners and renters - Asian residents 803 91.8% Owner occupied71 8.2% Renter occupiedHouse owners and renters - Other race residents 386 75.1% Owner occupied128 24.9% Renter occupiedHouse owners and renters - Two or more races residents 1,191 90.8% Owner occupied121 9.2% Renter occupiedHouse owners and renters - White alone residents 2,304 71.7% Owner occupied908 28.3% Renter occupiedHouse owners and renters - Hispanic or Latino residents 1,390 77.9% Owner occupied395 22.1% Renter occupied
Language usage in Round Lake
English speakers - Total 56.0% of residents of Round Lake speak English at home.
23.4% of residents speak Spanish at home 2,502 61.7% Speak English very well1,555 38.3% Speak English less than very well21.2% of residents speak other language at home 2,224 60.6% Speak English very well1,448 39.4% Speak English less than very well
English speakers - Born in the United States 95.8% of residents of Round Lake speak English at home.
4.1% of residents speak Spanish at home 63 85.1% Speak English very well11 14.9% Speak English less than very well
English speakers - Native, born elsewhere 34.0% of residents of Round Lake speak English at home.
57.6% of residents speak Spanish at home 53 27.5% Speak English very well140 72.5% Speak English less than very well2.7% of residents speak other language at home 9 100.0% Speak English less than very well
English speakers - Foreign-born 10.0% of residents of Round Lake speak English at home.
32.8% of residents speak Spanish at home 666 37.6% Speak English very well1,104 62.4% Speak English less than very well57.1% of residents speak other language at home 1,629 52.8% Speak English very well1,456 47.2% Speak English less than very well
White (Caucasian) - Speak only English Native:
92.9% (6,764)Foreign-born:
6.7% (72)
White (Caucasian) - Speak another language Native:
6.8% (495)Foreign-born:
86.1% (921)
Black or African American - Speak only English Native:
94.4% (741)Foreign-born:
46.0% (57)
Black or African American - Speak another language Native:
5.8% (46)Foreign-born:
53.9% (66)
Asian - Speak only English Native:
36.2% (252)Foreign-born:
11.9% (257)
Asian - Speak another language Native:
69.5% (483)Foreign-born:
87.8% (1,907)
Other race - Speak only English Native:
23.7% (235)Foreign-born:
14.8% (116)
Other race - Speak another language Native:
74.9% (743)Foreign-born:
86.6% (677)
Two or more races - Speak only English Native:
43.9% (1,107)Foreign-born:
0.9% (12)
Two or more races - Speak another language Native:
57.8% (1,456)Foreign-born:
100.0% (1,393)
White alone - Speak only English Native:
97.9% (6,383)Foreign-born:
6.0% (64)
White alone - Speak another language Native:
2.3% (147)Foreign-born:
92.7% (997)
Hispanic or Latino - Speak only English Native:
40.2% (1,359)Foreign-born:
4.7% (92)
Hispanic or Latino - Speak another language Native:
60.2% (2,035)Foreign-born:
94.2% (1,840)
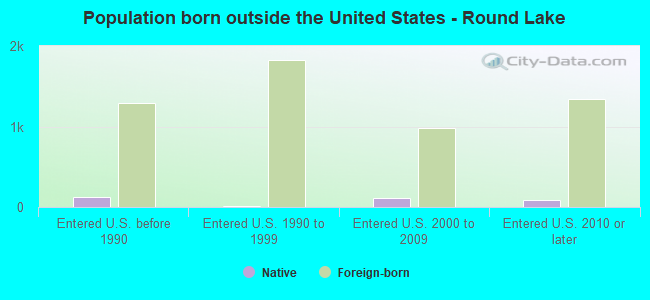
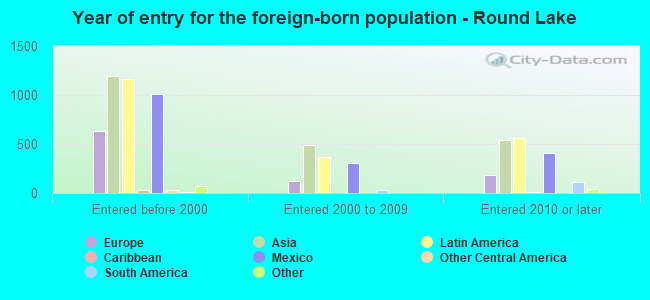
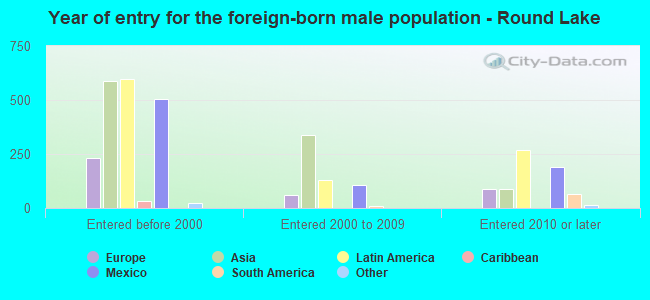
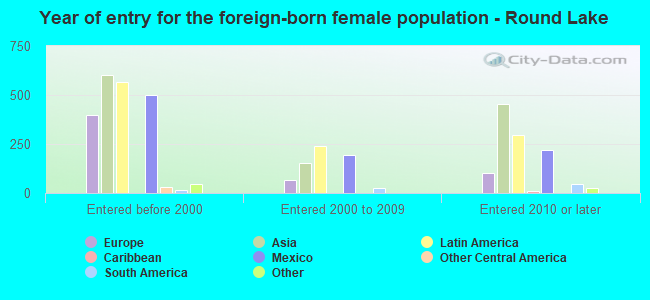
Foreign-born residents in Round Lake 5,178 residents are foreign born (12.3% Asia , 10.2% Latin America , 4.5% Europe ).
This city:
27.9%Illinois:
14.1%
Marital status for residents in Round Lake Marital status - White (Caucasian) population 15 years and over
Males 29.7% Never married56.7% Now married1.2% Separated1.5% Widowed10.9% DivorcedFemales 28.1% Never married47.8% Now married0.5% Separated5.4% Widowed18.2% DivorcedWomen who gave birth in the past 12 months Now married:
26.8% (40)Unmarried:
73.2% (109)
Women who did not give birth in the past 12 months Now married:
50.0% (1,050)Unmarried:
50.0% (1,052)
Marital status - Black or African American population 15 years and over
Males 37.9% Never married55.1% Now married0.0% Separated0.0% Widowed7.0% DivorcedFemales 47.0% Never married21.2% Now married0.0% Separated4.4% Widowed27.5% DivorcedWomen who did not give birth in the past 12 months Now married:
5.7% (12)Unmarried:
94.3% (195)
Marital status - American Indian / Alaska Native population 15 years and over
Males 100.0% Never married0.0% Now married0.0% Separated0.0% Widowed0.0% DivorcedFemales 0.0% Never married100.0% Now married0.0% Separated0.0% Widowed0.0% DivorcedWomen who did not give birth in the past 12 months Now married:
100.0% (93)Unmarried:
0.0% (0)
Marital status - Asian population 15 years and over
Males 15.7% Never married83.6% Now married0.0% Separated0.0% Widowed0.8% DivorcedFemales 13.0% Never married73.5% Now married0.0% Separated8.6% Widowed4.8% DivorcedWomen who did not give birth in the past 12 months Now married:
72.4% (512)Unmarried:
27.6% (195)
Marital status - Other race population 15 years and over
Males 39.7% Never married58.2% Now married0.0% Separated0.0% Widowed2.1% DivorcedFemales 12.7% Never married54.4% Now married9.4% Separated0.0% Widowed23.5% DivorcedWomen who gave birth in the past 12 months Now married:
76.2% (16)Unmarried:
23.8% (5)
Women who did not give birth in the past 12 months Now married:
57.1% (277)Unmarried:
42.9% (208)
Marital status - Two or more races population 15 years and over
Males 41.6% Never married56.3% Now married2.2% Separated0.0% Widowed0.0% DivorcedFemales 43.6% Never married53.0% Now married0.0% Separated0.0% Widowed3.4% DivorcedWomen who gave birth in the past 12 months Now married:
42.6% (29)Unmarried:
57.4% (40)
Women who did not give birth in the past 12 months Now married:
49.5% (537)Unmarried:
50.5% (548)
Marital status - White alone, not Hispanic / Latino population 15 years and over
Males 30.8% Never married55.9% Now married0.0% Separated1.7% Widowed11.6% DivorcedFemales 24.3% Never married49.2% Now married0.5% Separated6.2% Widowed19.8% DivorcedWomen who gave birth in the past 12 months Now married:
22.9% (30)Unmarried:
77.1% (102)
Women who did not give birth in the past 12 months Now married:
53.0% (979)Unmarried:
47.0% (868)
Marital status - Hispanic or Latino population 15 years and over
Males 36.2% Never married60.6% Now married2.0% Separated0.0% Widowed1.2% DivorcedFemales 37.8% Never married49.2% Now married2.7% Separated0.0% Widowed10.2% DivorcedWomen who gave birth in the past 12 months Now married:
51.0% (50)Unmarried:
49.0% (48)
Women who did not give birth in the past 12 months Now married:
47.7% (784)Unmarried:
52.3% (859)
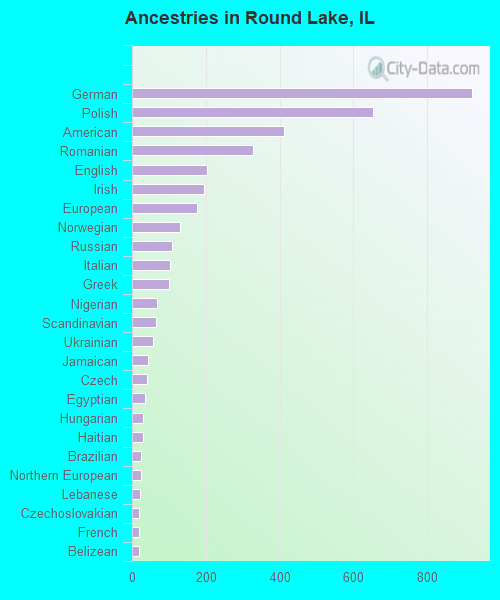
Ancestries in Round Lake
921 8.4% German652 5.9% Polish412 3.7% American328 3.0% Romanian202 1.8% English196 1.8% Irish177 1.6% European130 1.2% Norwegian107 1.0% Russian103 0.9% Italian101 0.9% Greek67 0.6% Nigerian65 0.6% Scandinavian57 0.5% Ukrainian44 0.4% Jamaican41 0.4% Czech36 0.3% Egyptian31 0.3% Hungarian30 0.3% Haitian24 0.2% Brazilian24 0.2% Northern European23 0.2% Lebanese20 0.2% Czechoslovakian20 0.2% French19 0.2% Belizean17 0.2% Scottish14 0.1% Serbian12 0.1% Danish10 0.09% Dutch9 0.08% Swedish8 0.07% Slovak
Geographical mobility in Round Lake Same house 1 year ago 8,160 90.8% White (Caucasian)519 58.3% Black or African American2,834 92.9% Asian1,536 85.7% Other race3,907 94.7% Two or more races7,294 90.2% White alone, not Hispanic / Latino5,126 90.4% Hispanic or LatinoMoved within same county 476 5.3% White / Caucasian297 33.3% Black or African American83 2.7% Asian80 4.5% Other race150 3.6% Two or more races473 5.8% White alone, not Hispanic / Latino194 3.4% Hispanic or LatinoMoved within same state 194 2.2% White / Caucasian86 2.8% Asian65 3.7% Other race9 0.2% Two or more races147 1.8% White alone, not Hispanic / Latino95 1.7% Hispanic or LatinoMoved from different state 112 1.2% White / Caucasian20 2.3% Black or African American328 98.4% American Indian / Alaska Native5 0.2% Asian73 4.1% Other race67 1.6% Two or more races123 1.5% White alone, not Hispanic / Latino303 5.4% Hispanic or LatinoMoved from abroad 26 1.5% Other race5 0.1% Hispanic or Latino
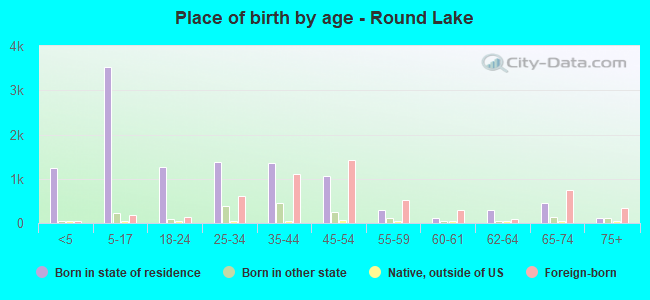
Children Nativity (place of birth) in Round Lake
Children under 6 years - Living with two parents Both parents native 663 100.0% NativeBoth parents foreign-born 276 100.0% NativeOne native, one foreign-born parent 179 100.0% NativeChildren under 6 years - Living with one parent Native parent 288 100.0% NativeForeign-born parent 148 100.0% NativeChildren 6 to 17 years - Living with two parents Both parents native 1,219 100.0% NativeBoth parents foreign-born 1,009 85.7% Native168 14.3% Foreign-bornOne native, one foreign-born parent 277 100.0% NativeChildren 6 to 17 years - Living with one parent Native parent 722 100.0% NativeForeign-born parent 45 51.8% Native41 48.2% Foreign-born
Grandparents responsible for own grandchildren in Round Lake
Grandparents (30 to 59 years) White / Caucasian 10 28.8% Responsible for grandchildren25 71.2% Not responsible for grandchildrenAsian 74 100.0% Responsible for grandchildrenOther race 23 64.7% Responsible for grandchildren13 35.3% Not responsible for grandchildrenTwo or more races 28 100.0% Not responsible for grandchildrenWhite alone, not Hispanic / Latino 13 33.0% Responsible for grandchildren26 67.0% Not responsible for grandchildrenHispanic or Latino 16 33.5% Responsible for grandchildren31 66.5% Not responsible for grandchildrenGrandparents (60 years and over) White / Caucasian 18 30.5% Responsible for grandchildren41 69.5% Not responsible for grandchildrenAsian 174 100.0% Not responsible for grandchildrenOther race 23 100.0% Not responsible for grandchildrenTwo or more races 14 100.0% Not responsible for grandchildrenWhite alone, not Hispanic / Latino 14 31.7% Responsible for grandchildren29 68.3% Not responsible for grandchildrenHispanic or Latino 3 4.8% Responsible for grandchildren66 95.2% Not responsible for grandchildren