Races in Sherwood Manor, Connecticut (CT) Detailed Stats
Data:
Races - White alone (%)
Races - White alone (% change since 2000)
Races - Black alone (%)
Races - Black alone (% change since 2000)
Races - American Indian alone (%)
Races - American Indian alone (% change since 2000)
Races - Asian alone (%)
Races - Asian alone (% change since 2000)
Races - Hispanic (%)
Races - Hispanic (% change since 2000)
Races - Native Hawaiian and Other Pacific Islander alone (%)
Races - Native Hawaiian and Other Pacific Islander alone (% change since 2000)
Races - Two or more races(%)
Races - Two or more races(% change since 2000)
Races - Other race alone (%)
Races - Other race alone (% change since 2000)
Racial diversity
Place of birth - Born in state of residence (%)
Place of birth - Born in state of residence (%) - White
Place of birth - Born in state of residence (%) - Black or African American
Place of birth - Born in state of residence (%) - Asian
Place of birth - Born in state of residence (%) - Hispanic or Latino
Place of birth - Born in state of residence (%) - American Indian and Alaska Native
Place of birth - Born in state of residence (%) - Multirace
Place of birth - Born in state of residence (%) - Other Race
Place of birth - Born in other state (%)
Place of birth - Born in other state (%) - White
Place of birth - Born in other state (%) - Black or African American
Place of birth - Born in other state (%) - Asian
Place of birth - Born in other state (%) - Hispanic or Latino
Place of birth - Born in other state (%) - American Indian and Alaska Native
Place of birth - Born in other state (%) - Multirace
Place of birth - Born in other state (%) - Other Race
Place of birth - Native, outside of US (%)
Place of birth - Native, outside of US (%) - White
Place of birth - Native, outside of US (%) - Black or African American
Place of birth - Native, outside of US (%) - Asian
Place of birth - Native, outside of US (%) - Hispanic or Latino
Place of birth - Native, outside of US (%) - American Indian and Alaska Native
Place of birth - Native, outside of US (%) - Multirace
Place of birth - Native, outside of US (%) - Other Race
Place of birth - Foreign born (%)
Place of birth - Foreign born (%) - White
Place of birth - Foreign born (%) - Black or African American
Place of birth - Foreign born (%) - Asian
Place of birth - Foreign born (%) - Hispanic or Latino
Place of birth - Foreign born (%) - American Indian and Alaska Native
Place of birth - Foreign born (%) - Multirace
Place of birth - Foreign born (%) - Other Race
Residents speaking English at home (%)
Residents speaking English at home - Born in the United States (%)
Residents speaking English at home - Native, born elsewhere (%)
Residents speaking English at home - Foreign born (%)
Residents speaking Spanish at home (%)
Residents speaking Spanish at home - Born in the United States (%)
Residents speaking Spanish at home - Native, born elsewhere (%)
Residents speaking Spanish at home - Foreign born (%)
Residents speaking other language at home (%)
Residents speaking other language at home - Born in the United States (%)
Residents speaking other language at home - Native, born elsewhere (%)
Residents speaking other language at home - Foreign born (%)
Marital status - Never married (%)
Marital status - Now married (%)
Marital status - Separated (%)
Marital status - Widowed (%)
Marital status - Divorced (%)
Ancestries Reported - Arab (%)
Ancestries Reported - Czech (%)
Ancestries Reported - Danish (%)
Ancestries Reported - Dutch (%)
Ancestries Reported - English (%)
Ancestries Reported - French (%)
Ancestries Reported - French Canadian (%)
Ancestries Reported - German (%)
Ancestries Reported - Greek (%)
Ancestries Reported - Hungarian (%)
Ancestries Reported - Irish (%)
Ancestries Reported - Italian (%)
Ancestries Reported - Lithuanian (%)
Ancestries Reported - Norwegian (%)
Ancestries Reported - Polish (%)
Ancestries Reported - Portuguese (%)
Ancestries Reported - Russian (%)
Ancestries Reported - Scotch-Irish (%)
Ancestries Reported - Scottish (%)
Ancestries Reported - Slovak (%)
Ancestries Reported - Subsaharan African (%)
Ancestries Reported - Swedish (%)
Ancestries Reported - Swiss (%)
Ancestries Reported - Ukrainian (%)
Ancestries Reported - United States (%)
Ancestries Reported - Welsh (%)
Ancestries Reported - West Indian (%)
Ancestries Reported - Other (%)
Geographical mobility - Same house 1 year ago (%)
Geographical mobility - Same house 1 year ago (%) - White
Geographical mobility - Same house 1 year ago (%) - Black or African American
Geographical mobility - Same house 1 year ago (%) - Asian
Geographical mobility - Same house 1 year ago (%) - Hispanic or Latino
Geographical mobility - Same house 1 year ago (%) - American Indian and Alaska Native
Geographical mobility - Same house 1 year ago (%) - Multirace
Geographical mobility - Same house 1 year ago (%) - Other Race
Geographical mobility - Moved within same county (%)
Geographical mobility - Moved within same county (%) - White
Geographical mobility - Moved within same county (%) - Black or African American
Geographical mobility - Moved within same county (%) - Asian
Geographical mobility - Moved within same county (%) - Hispanic or Latino
Geographical mobility - Moved within same county (%) - American Indian and Alaska Native
Geographical mobility - Moved within same county (%) - Multirace
Geographical mobility - Moved within same county (%) - Other Race
Geographical mobility - Moved from different county within same state (%)
Geographical mobility - Moved from different county within same state (%) - White
Geographical mobility - Moved from different county within same state (%) - Black or African American
Geographical mobility - Moved from different county within same state (%) - Asian
Geographical mobility - Moved from different county within same state (%) - Hispanic or Latino
Geographical mobility - Moved from different county within same state (%) - American Indian and Alaska Native
Geographical mobility - Moved from different county within same state (%) - Multirace
Geographical mobility - Moved from different county within same state (%) - Other Race
Geographical mobility - Moved from different state (%)
Geographical mobility - Moved from different state (%) - White
Geographical mobility - Moved from different state (%) - Black or African American
Geographical mobility - Moved from different state (%) - Asian
Geographical mobility - Moved from different state (%) - Hispanic or Latino
Geographical mobility - Moved from different state (%) - American Indian and Alaska Native
Geographical mobility - Moved from different state (%) - Multirace
Geographical mobility - Moved from different state (%) - Other Race
Geographical mobility - Moved from abroad (%)
Geographical mobility - Moved from abroad (%) - White
Geographical mobility - Moved from abroad (%) - Black or African American
Geographical mobility - Moved from abroad (%) - Asian
Geographical mobility - Moved from abroad (%) - Hispanic or Latino
Geographical mobility - Moved from abroad (%) - American Indian and Alaska Native
Geographical mobility - Moved from abroad (%) - Multirace
Geographical mobility - Moved from abroad (%) - Other Race
Place of birth for the foreign-born population - Ireland (%)
Place of birth for the foreign-born population - Denmark (%)
Place of birth for the foreign-born population - Norway (%)
Place of birth for the foreign-born population - Sweden (%)
Place of birth for the foreign-born population - United Kingdom (%)
Place of birth for the foreign-born population - England (%)
Place of birth for the foreign-born population - Scotland (%)
Place of birth for the foreign-born population - Other Northern Europe (%)
Place of birth for the foreign-born population - Austria (%)
Place of birth for the foreign-born population - Belgium (%)
Place of birth for the foreign-born population - France (%)
Place of birth for the foreign-born population - Germany (%)
Place of birth for the foreign-born population - Netherlands (%)
Place of birth for the foreign-born population - Switzerland (%)
Place of birth for the foreign-born population - Other Western Europe (%)
Place of birth for the foreign-born population - Greece (%)
Place of birth for the foreign-born population - Italy (%)
Place of birth for the foreign-born population - Portugal (%)
Place of birth for the foreign-born population - Spain (%)
Place of birth for the foreign-born population - Other Southern Europe (%)
Place of birth for the foreign-born population - Albania (%)
Place of birth for the foreign-born population - Belarus (%)
Place of birth for the foreign-born population - Bosnia and Herzegovina (%)
Place of birth for the foreign-born population - Bulgaria (%)
Place of birth for the foreign-born population - Croatia (%)
Place of birth for the foreign-born population - Czechoslovakia (%)
Place of birth for the foreign-born population - Hungary (%)
Place of birth for the foreign-born population - Latvia (%)
Place of birth for the foreign-born population - Lithuania (%)
Place of birth for the foreign-born population - North Macedonia (Macedonia) (%)
Place of birth for the foreign-born population - Moldova (%)
Place of birth for the foreign-born population - Poland (%)
Place of birth for the foreign-born population - Romania (%)
Place of birth for the foreign-born population - Russia (%)
Place of birth for the foreign-born population - Serbia (%)
Place of birth for the foreign-born population - Ukraine (%)
Place of birth for the foreign-born population - Other Eastern Europe (%)
Place of birth for the foreign-born population - China (%)
Place of birth for the foreign-born population - Hong Kong (%)
Place of birth for the foreign-born population - Taiwan (%)
Place of birth for the foreign-born population - Japan (%)
Place of birth for the foreign-born population - Korea (%)
Place of birth for the foreign-born population - Other Eastern Asia (%)
Place of birth for the foreign-born population - Afghanistan (%)
Place of birth for the foreign-born population - Bangladesh (%)
Place of birth for the foreign-born population - India (%)
Place of birth for the foreign-born population - Iran (%)
Place of birth for the foreign-born population - Kazakhstan (%)
Place of birth for the foreign-born population - Nepal (%)
Place of birth for the foreign-born population - Pakistan (%)
Place of birth for the foreign-born population - Sri Lanka (%)
Place of birth for the foreign-born population - Uzbekistan (%)
Place of birth for the foreign-born population - Other South Central Asia (%)
Place of birth for the foreign-born population - Burma (%)
Place of birth for the foreign-born population - Cambodia (%)
Place of birth for the foreign-born population - Indonesia (%)
Place of birth for the foreign-born population - Laos (%)
Place of birth for the foreign-born population - Malaysia (%)
Place of birth for the foreign-born population - Philippines (%)
Place of birth for the foreign-born population - Singapore (%)
Place of birth for the foreign-born population - Thailand (%)
Place of birth for the foreign-born population - Vietnam (%)
Place of birth for the foreign-born population - Other South Eastern Asia (%)
Place of birth for the foreign-born population - Armenia (%)
Place of birth for the foreign-born population - Iraq (%)
Place of birth for the foreign-born population - Israel (%)
Place of birth for the foreign-born population - Jordan (%)
Place of birth for the foreign-born population - Kuwait (%)
Place of birth for the foreign-born population - Lebanon (%)
Place of birth for the foreign-born population - Saudi Arabia (%)
Place of birth for the foreign-born population - Syria (%)
Place of birth for the foreign-born population - Turkey (%)
Place of birth for the foreign-born population - Yemen (%)
Place of birth for the foreign-born population - Other Western Asia (%)
Place of birth for the foreign-born population - Eritrea (%)
Place of birth for the foreign-born population - Ethiopia (%)
Place of birth for the foreign-born population - Kenya (%)
Place of birth for the foreign-born population - Somalia (%)
Place of birth for the foreign-born population - Uganda (%)
Place of birth for the foreign-born population - Zimbabwe (%)
Place of birth for the foreign-born population - Other Eastern Africa (%)
Place of birth for the foreign-born population - Cameroon (%)
Place of birth for the foreign-born population - Congo (%)
Place of birth for the foreign-born population - Democratic Republic of Congo (Zaire) (%)
Place of birth for the foreign-born population - Other Middle Africa (%)
Place of birth for the foreign-born population - Egypt (%)
Place of birth for the foreign-born population - Morocco (%)
Place of birth for the foreign-born population - Sudan (%)
Place of birth for the foreign-born population - Other Northern Africa (%)
Place of birth for the foreign-born population - South Africa (%)
Place of birth for the foreign-born population - Other Southern Africa (%)
Place of birth for the foreign-born population - Cabo Verde (%)
Place of birth for the foreign-born population - Ghana (%)
Place of birth for the foreign-born population - Liberia (%)
Place of birth for the foreign-born population - Nigeria (%)
Place of birth for the foreign-born population - Senegal (%)
Place of birth for the foreign-born population - Sierra Leone (%)
Place of birth for the foreign-born population - Other Western Africa (%)
Place of birth for the foreign-born population - Australia (%)
Place of birth for the foreign-born population - New Zealand (%)
Place of birth for the foreign-born population - Fiji (%)
Place of birth for the foreign-born population - Micronesia (%)
Place of birth for the foreign-born population - Bahamas (%)
Place of birth for the foreign-born population - Barbados (%)
Place of birth for the foreign-born population - Cuba (%)
Place of birth for the foreign-born population - Dominica (%)
Place of birth for the foreign-born population - Dominican Republic (%)
Place of birth for the foreign-born population - Grenada (%)
Place of birth for the foreign-born population - Haiti (%)
Place of birth for the foreign-born population - Jamaica (%)
Place of birth for the foreign-born population - St. Vincent and the Grenadines (%)
Place of birth for the foreign-born population - Trinidad and Tobago (%)
Place of birth for the foreign-born population - West Indies (%)
Place of birth for the foreign-born population - Other Caribbean (%)
Place of birth for the foreign-born population - Belize (%)
Place of birth for the foreign-born population - Costa Rica (%)
Place of birth for the foreign-born population - El Salvador (%)
Place of birth for the foreign-born population - Guatemala (%)
Place of birth for the foreign-born population - Honduras (%)
Place of birth for the foreign-born population - Mexico (%)
Place of birth for the foreign-born population - Nicaragua (%)
Place of birth for the foreign-born population - Panama (%)
Place of birth for the foreign-born population - Other Central America (%)
Place of birth for the foreign-born population - Argentina (%)
Place of birth for the foreign-born population - Bolivia (%)
Place of birth for the foreign-born population - Brazil (%)
Place of birth for the foreign-born population - Chile (%)
Place of birth for the foreign-born population - Colombia (%)
Place of birth for the foreign-born population - Ecuador (%)
Place of birth for the foreign-born population - Guyana (%)
Place of birth for the foreign-born population - Peru (%)
Place of birth for the foreign-born population - Uruguay (%)
Place of birth for the foreign-born population - Venezuela (%)
Place of birth for the foreign-born population - Other South America (%)
Place of birth for the foreign-born population - Canada (%)
Place of birth for the foreign-born population - Other Northern America (%)
Place of birth for the foreign-born population - Other (%)
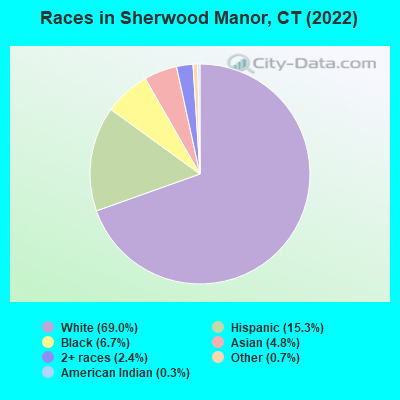
According to 2022 data, the most numerous races in Sherwood Manor, CT are White alone (3,969 residents), Hispanic (883 residents), and Black alone (383 residents). 88.0% of Sherwood Manor residents speak English at home. 6.7% of Sherwood Manor, CT residents are foreign-born (2.3% born in Asia, 1.9% born in Latin America, 1.7% born in Europe), which is 125.4% less than the foreign-born rate of 15.0% across the entire state of Connecticut.
Race distribution in Sherwood Manor
2000 2022
2,638,845 77.5% White alone 320,323 9.4% Hispanic 295,571 8.7% Black alone 81,564 2.4% Asian alone 52,896 1.6% Two or more races 8,141 0.2% Other race alone 7,267 0.2% American Indian alone 958 0.03% Native Hawaiian and Other
2,246,913 62.0% White alone 658,978 18.2% Hispanic 353,973 9.8% Black alone 172,929 4.8% Asian alone 159,631 4.4% Two or more races 29,761 0.8% Other race alone 3,428 0.09% American Indian alone 592 0.02% Native Hawaiian and Other
Income and house value in Sherwood Manor Median household income in 2022 $97,086 White non-Hispanic householders$73,355 Black householders$88,547 Hispanic or Latino race householdersMedian 2022 house value $247,296 White Non-Hispanic householders$229,976 Black or African American householders $240,561 Asian householders$216,505 Some other race householders$264,617 Two or more races householders$223,048 Hispanic or Latino householders
Median age by race in Sherwood Manor
50.3 Median age for White residents49.2 50.6 16.8 Median age for Black or African American residents16.2 38.0 14.9 Median age for American Indian / Alaska Native residents-701,030,927.1 -704,477,611.2 33.4 Median age for Asian residents33.0 22.6 -641,269,840.6 Median age for Native Hawaiian / Pacific Islander residents-414,239,481.8 -691,588,784.4 21.1 Median age for Other race residents34.3 21.3 25.6 Median age for Two or more races residents24.9 29.6 50.0 Median age for White alone residents49.3 50.7 24.3 Median age for Hispanic or Latino residents24.1 26.7
Owner/renter occupied households by race in Sherwood Manor
House owners and renters - White residents 1,573 81.7% Owner occupied353 18.3% Renter occupiedHouse owners and renters - Black or African American residents 36 62.5% Owner occupied21 37.5% Renter occupiedHouse owners and renters - Asian residents 46 100.0% Owner occupiedHouse owners and renters - Other race residents 21 72.3% Owner occupied8 27.7% Renter occupiedHouse owners and renters - Two or more races residents 96 70.5% Owner occupied40 29.5% Renter occupiedHouse owners and renters - White alone residents 1,569 82.7% Owner occupied327 17.3% Renter occupiedHouse owners and renters - Hispanic or Latino residents 88 49.7% Owner occupied89 50.3% Renter occupied
Language usage in Sherwood Manor
English speakers - Total 88.0% of residents of Sherwood Manor speak English at home.
3.7% of residents speak Spanish at home 184 92.0% Speak English very well16 8.0% Speak English less than very well7.7% of residents speak other language at home 283 67.1% Speak English very well139 32.9% Speak English less than very well
English speakers - Born in the United States 90.8% of residents of Sherwood Manor speak English at home.
1.4% of residents speak Spanish at home 26 100.0% Speak English very well6.4% of residents speak other language at home 84 68.9% Speak English very well38 31.1% Speak English less than very well
English speakers - Native, born elsewhere 35.7% of residents of Sherwood Manor speak English at home.
64.9% of residents speak Spanish at home 87 87.0% Speak English very well13 13.0% Speak English less than very well
English speakers - Foreign-born 44.0% of residents of Sherwood Manor speak English at home.
3.1% of residents speak Spanish at home 11 91.7% Speak English very well1 8.3% Speak English less than very well51.8% of residents speak other language at home 119 60.1% Speak English very well79 39.9% Speak English less than very well
White (Caucasian) - Speak only English Native:
97.9% (3,676)Foreign-born:
50.1% (58)
White (Caucasian) - Speak another language Native:
3.0% (113)Foreign-born:
53.3% (62)
Black or African American - Speak another language Native:
21.5% (72)Foreign-born:
83.6% (32)
Asian - Speak only English Native:
70.2% (106)Foreign-born:
25.0% (31)
Asian - Speak another language Native:
30.7% (46)Foreign-born:
74.4% (93)
Other race - Speak only English Native:
39.1% (57)Foreign-born:
85.0% (17)
Two or more races - Speak only English Native:
83.3% (543)Foreign-born:
63.9% (52)
Two or more races - Speak another language Native:
13.0% (84)Foreign-born:
2.1% (2)
White alone - Speak only English Native:
97.0% (3,587)Foreign-born:
47.8% (60)
White alone - Speak another language Native:
3.0% (110)Foreign-born:
52.7% (66)
Hispanic or Latino - Speak only English Native:
75.7% (502)Foreign-born:
68.2% (43)
Hispanic or Latino - Speak another language Native:
26.8% (177)Foreign-born:
18.9% (12)
Foreign-born residents in Sherwood Manor 383 residents are foreign born (2.3% Asia , 1.9% Latin America , 1.7% Europe ).
This city:
6.7%Connecticut:
15.0%
Marital status for residents in Sherwood Manor Marital status - White (Caucasian) population 15 years and over
Males 32.3% Never married51.9% Now married0.6% Separated3.4% Widowed11.8% DivorcedFemales 32.8% Never married46.1% Now married2.7% Separated10.7% Widowed7.7% DivorcedWomen who gave birth in the past 12 months Now married:
29.0% (17)Unmarried:
71.0% (40)
Women who did not give birth in the past 12 months Now married:
42.2% (374)Unmarried:
57.8% (512)
Marital status - Black or African American population 15 years and over
Males 72.9% Never married27.1% Now married0.0% Separated0.0% Widowed0.0% DivorcedFemales 34.1% Never married43.5% Now married0.0% Separated0.0% Widowed22.4% DivorcedWomen who did not give birth in the past 12 months Now married:
53.6% (36)Unmarried:
46.4% (31)
Marital status - Asian population 15 years and over
Males 71.9% Never married28.1% Now married0.0% Separated0.0% Widowed0.0% DivorcedFemales 12.7% Never married80.0% Now married7.3% Separated0.0% Widowed0.0% DivorcedWomen who did not give birth in the past 12 months Now married:
75.9% (22)Unmarried:
24.1% (7)
Marital status - Other race population 15 years and over
Males 13.0% Never married87.0% Now married0.0% Separated0.0% Widowed0.0% DivorcedFemales 60.4% Never married39.6% Now married0.0% Separated0.0% Widowed0.0% DivorcedWomen who did not give birth in the past 12 months Now married:
39.6% (26)Unmarried:
60.4% (39)
Marital status - Two or more races population 15 years and over
Males 87.1% Never married12.9% Now married0.0% Separated0.0% Widowed0.0% DivorcedFemales 34.1% Never married55.5% Now married0.0% Separated7.5% Widowed2.9% DivorcedWomen who did not give birth in the past 12 months Now married:
59.0% (130)Unmarried:
41.0% (90)
Marital status - White alone, not Hispanic / Latino population 15 years and over
Males 33.5% Never married50.7% Now married0.6% Separated3.0% Widowed12.3% DivorcedFemales 31.4% Never married47.6% Now married2.8% Separated10.6% Widowed7.6% DivorcedWomen who gave birth in the past 12 months Now married:
29.0% (17)Unmarried:
71.0% (43)
Women who did not give birth in the past 12 months Now married:
44.6% (384)Unmarried:
55.4% (477)
Marital status - Hispanic or Latino population 15 years and over
Males 61.3% Never married35.8% Now married0.0% Separated2.9% Widowed0.0% DivorcedFemales 53.9% Never married37.2% Now married0.0% Separated3.9% Widowed5.0% DivorcedWomen who did not give birth in the past 12 months Now married:
39.3% (100)Unmarried:
60.7% (154)
Ancestries in Sherwood Manor
239 10.3% French204 8.8% Irish186 8.0% Polish179 7.7% Italian152 6.5% English111 4.8% Haitian74 3.2% American73 3.1% Guyanese68 2.9% French Canadian55 2.4% European54 2.3% German36 1.5% Ukrainian31 1.3% Canadian24 1.0% Danish21 0.9% Greek19 0.8% Norwegian17 0.7% Portuguese16 0.7% Swedish12 0.5% Albanian12 0.5% Austrian12 0.5% British11 0.5% Pennsylvania German9 0.4% Turkish8 0.3% Eastern European7 0.3% Lithuanian7 0.3% Scottish6 0.3% Russian6 0.3% Scotch-Irish6 0.3% Swiss
Children Nativity (place of birth) in Sherwood Manor
Children under 6 years - Living with two parents Both parents native 153 100.0% NativeChildren under 6 years - Living with one parent Native parent 162 100.0% NativeForeign-born parent 13 100.0% NativeChildren 6 to 17 years - Living with two parents Both parents native 511 100.0% NativeBoth parents foreign-born 101 79.2% Native27 20.8% Foreign-bornOne native, one foreign-born parent 4 100.0% Foreign-bornChildren 6 to 17 years - Living with one parent Native parent 86 100.0% NativeForeign-born parent 36 50.8% Native35 49.2% Foreign-born
Grandparents responsible for own grandchildren in Sherwood Manor
Grandparents (30 to 59 years) White / Caucasian 5 21.0% Responsible for grandchildren19 79.0% Not responsible for grandchildrenOther race 41 100.0% Not responsible for grandchildrenWhite alone, not Hispanic / Latino 25 100.0% Not responsible for grandchildrenHispanic or Latino 7 18.9% Responsible for grandchildren29 81.1% Not responsible for grandchildrenGrandparents (60 years and over) White / Caucasian 5 13.7% Responsible for grandchildren31 86.3% Not responsible for grandchildrenWhite alone, not Hispanic / Latino 5 13.8% Responsible for grandchildren33 86.2% Not responsible for grandchildrenHispanic or Latino 31 100.0% Not responsible for grandchildren