Races in Shoreham, Vermont (VT) Detailed Stats
Ancestries, Foreign-born residents, place of birth

Recent posts about races in Shoreham, Vermont on our local forum with over 2,400,000 registered users:
 | Southern VT (11 replies) |
| From Spain to Vermont (2 replies) |
Latest news about races in Shoreham, VT collected exclusively by city-data.com from local newspapers, TV, and radio stations
2.5% of Shoreham, VT residents are foreign-born (1.3% born in Europe, 0.6% born in Asia, 0.6% born in North America), which is 62.9% less than the foreign-born rate of 4.0% across the entire state of Vermont.
Race distribution in Shoreham

- 1,19998.1%White alone
- 70.6%Black alone
- 60.5%Hispanic
- 40.3%Asian alone
- 30.2%Two or more races
- 30.2%American Indian alone

2000
2022
-
- 585,43196.2%White alone
- 6,8091.1%Two or more races
- 5,5040.9%Hispanic
- 5,1600.8%Asian alone
- 2,9210.5%Black alone
- 2,3250.4%American Indian alone
- 5570.09%Other race alone
- 1200.02%Native Hawaiian and Other
Pacific Islander alone

-
- 583,54690.2%White alone
- 27,3404.2%Two or more races
- 14,7702.3%Hispanic
- 11,5121.8%Asian alone
- 6,2641.0%Black alone
- 2,5210.4%Other race alone
- 1,0520.2%American Indian alone
- 590.01%Native Hawaiian and Other
Pacific Islander alone

Income and house value in Shoreham
- Median household income in 2022
- $69,635White non-Hispanic householders
- $187,877Black householders
- $40,861American Indian and Alaska Native householders
- $78,170Asian householders
- $113,377Two or more races householders
- Median 2022 house value
- $287,887White Non-Hispanic householders
- $486,801Black or African American householders
Household income for White non-Hispanic householders

Household income for Black householders

Household income for American Indian and Alaska Native householders

Household income for Asian householders

Household income for Two or more races householders

Foreign-born residents in Shoreham
30 residents are foreign born (1.3% Europe, 0.6% Asia, 0.6% North America).
| This city: | 2.5% |
| Vermont: | 3.8% |
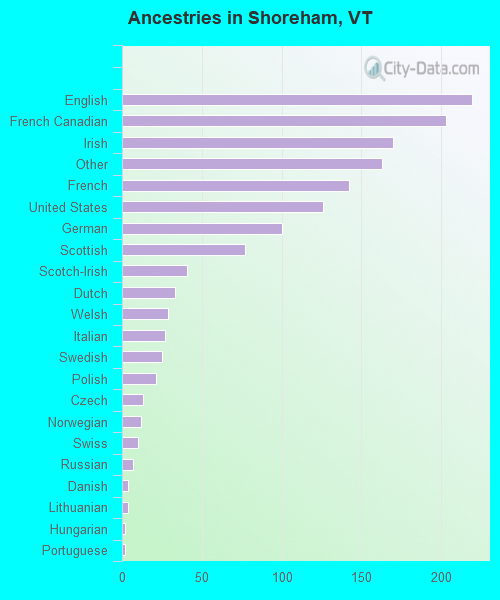
Ancestries in Shoreham

- 21915.3%English
- 20314.2%French Canadian
- 17011.9%Irish
- 16311.4%Other
- 1429.9%French
- 1268.8%United States
- 1007.0%German
- 775.4%Scottish
- 412.9%Scotch-Irish
- 332.3%Dutch
- 292.0%Welsh
- 271.9%Italian
- 251.7%Swedish
- 211.5%Polish
- 130.9%Czech
- 120.8%Norwegian
- 100.7%Swiss
- 70.5%Russian
- 40.3%Danish
- 40.3%Lithuanian
- 20.1%Hungarian
- 20.1%Portuguese
Zip codes: 05770.