Races in Shorewood, Illinois (IL) Detailed Stats
Data:
Races - White alone (%)
Races - White alone (% change since 2000)
Races - Black alone (%)
Races - Black alone (% change since 2000)
Races - American Indian alone (%)
Races - American Indian alone (% change since 2000)
Races - Asian alone (%)
Races - Asian alone (% change since 2000)
Races - Hispanic (%)
Races - Hispanic (% change since 2000)
Races - Native Hawaiian and Other Pacific Islander alone (%)
Races - Native Hawaiian and Other Pacific Islander alone (% change since 2000)
Races - Two or more races(%)
Races - Two or more races(% change since 2000)
Races - Other race alone (%)
Races - Other race alone (% change since 2000)
Racial diversity
Place of birth - Born in state of residence (%)
Place of birth - Born in state of residence (%) - White
Place of birth - Born in state of residence (%) - Black or African American
Place of birth - Born in state of residence (%) - Asian
Place of birth - Born in state of residence (%) - Hispanic or Latino
Place of birth - Born in state of residence (%) - American Indian and Alaska Native
Place of birth - Born in state of residence (%) - Multirace
Place of birth - Born in state of residence (%) - Other Race
Place of birth - Born in other state (%)
Place of birth - Born in other state (%) - White
Place of birth - Born in other state (%) - Black or African American
Place of birth - Born in other state (%) - Asian
Place of birth - Born in other state (%) - Hispanic or Latino
Place of birth - Born in other state (%) - American Indian and Alaska Native
Place of birth - Born in other state (%) - Multirace
Place of birth - Born in other state (%) - Other Race
Place of birth - Native, outside of US (%)
Place of birth - Native, outside of US (%) - White
Place of birth - Native, outside of US (%) - Black or African American
Place of birth - Native, outside of US (%) - Asian
Place of birth - Native, outside of US (%) - Hispanic or Latino
Place of birth - Native, outside of US (%) - American Indian and Alaska Native
Place of birth - Native, outside of US (%) - Multirace
Place of birth - Native, outside of US (%) - Other Race
Place of birth - Foreign born (%)
Place of birth - Foreign born (%) - White
Place of birth - Foreign born (%) - Black or African American
Place of birth - Foreign born (%) - Asian
Place of birth - Foreign born (%) - Hispanic or Latino
Place of birth - Foreign born (%) - American Indian and Alaska Native
Place of birth - Foreign born (%) - Multirace
Place of birth - Foreign born (%) - Other Race
Residents speaking English at home (%)
Residents speaking English at home - Born in the United States (%)
Residents speaking English at home - Native, born elsewhere (%)
Residents speaking English at home - Foreign born (%)
Residents speaking Spanish at home (%)
Residents speaking Spanish at home - Born in the United States (%)
Residents speaking Spanish at home - Native, born elsewhere (%)
Residents speaking Spanish at home - Foreign born (%)
Residents speaking other language at home (%)
Residents speaking other language at home - Born in the United States (%)
Residents speaking other language at home - Native, born elsewhere (%)
Residents speaking other language at home - Foreign born (%)
Marital status - Never married (%)
Marital status - Now married (%)
Marital status - Separated (%)
Marital status - Widowed (%)
Marital status - Divorced (%)
Ancestries Reported - Arab (%)
Ancestries Reported - Czech (%)
Ancestries Reported - Danish (%)
Ancestries Reported - Dutch (%)
Ancestries Reported - English (%)
Ancestries Reported - French (%)
Ancestries Reported - French Canadian (%)
Ancestries Reported - German (%)
Ancestries Reported - Greek (%)
Ancestries Reported - Hungarian (%)
Ancestries Reported - Irish (%)
Ancestries Reported - Italian (%)
Ancestries Reported - Lithuanian (%)
Ancestries Reported - Norwegian (%)
Ancestries Reported - Polish (%)
Ancestries Reported - Portuguese (%)
Ancestries Reported - Russian (%)
Ancestries Reported - Scotch-Irish (%)
Ancestries Reported - Scottish (%)
Ancestries Reported - Slovak (%)
Ancestries Reported - Subsaharan African (%)
Ancestries Reported - Swedish (%)
Ancestries Reported - Swiss (%)
Ancestries Reported - Ukrainian (%)
Ancestries Reported - United States (%)
Ancestries Reported - Welsh (%)
Ancestries Reported - West Indian (%)
Ancestries Reported - Other (%)
Geographical mobility - Same house 1 year ago (%)
Geographical mobility - Same house 1 year ago (%) - White
Geographical mobility - Same house 1 year ago (%) - Black or African American
Geographical mobility - Same house 1 year ago (%) - Asian
Geographical mobility - Same house 1 year ago (%) - Hispanic or Latino
Geographical mobility - Same house 1 year ago (%) - American Indian and Alaska Native
Geographical mobility - Same house 1 year ago (%) - Multirace
Geographical mobility - Same house 1 year ago (%) - Other Race
Geographical mobility - Moved within same county (%)
Geographical mobility - Moved within same county (%) - White
Geographical mobility - Moved within same county (%) - Black or African American
Geographical mobility - Moved within same county (%) - Asian
Geographical mobility - Moved within same county (%) - Hispanic or Latino
Geographical mobility - Moved within same county (%) - American Indian and Alaska Native
Geographical mobility - Moved within same county (%) - Multirace
Geographical mobility - Moved within same county (%) - Other Race
Geographical mobility - Moved from different county within same state (%)
Geographical mobility - Moved from different county within same state (%) - White
Geographical mobility - Moved from different county within same state (%) - Black or African American
Geographical mobility - Moved from different county within same state (%) - Asian
Geographical mobility - Moved from different county within same state (%) - Hispanic or Latino
Geographical mobility - Moved from different county within same state (%) - American Indian and Alaska Native
Geographical mobility - Moved from different county within same state (%) - Multirace
Geographical mobility - Moved from different county within same state (%) - Other Race
Geographical mobility - Moved from different state (%)
Geographical mobility - Moved from different state (%) - White
Geographical mobility - Moved from different state (%) - Black or African American
Geographical mobility - Moved from different state (%) - Asian
Geographical mobility - Moved from different state (%) - Hispanic or Latino
Geographical mobility - Moved from different state (%) - American Indian and Alaska Native
Geographical mobility - Moved from different state (%) - Multirace
Geographical mobility - Moved from different state (%) - Other Race
Geographical mobility - Moved from abroad (%)
Geographical mobility - Moved from abroad (%) - White
Geographical mobility - Moved from abroad (%) - Black or African American
Geographical mobility - Moved from abroad (%) - Asian
Geographical mobility - Moved from abroad (%) - Hispanic or Latino
Geographical mobility - Moved from abroad (%) - American Indian and Alaska Native
Geographical mobility - Moved from abroad (%) - Multirace
Geographical mobility - Moved from abroad (%) - Other Race
Place of birth for the foreign-born population - Ireland (%)
Place of birth for the foreign-born population - Denmark (%)
Place of birth for the foreign-born population - Norway (%)
Place of birth for the foreign-born population - Sweden (%)
Place of birth for the foreign-born population - United Kingdom (%)
Place of birth for the foreign-born population - England (%)
Place of birth for the foreign-born population - Scotland (%)
Place of birth for the foreign-born population - Other Northern Europe (%)
Place of birth for the foreign-born population - Austria (%)
Place of birth for the foreign-born population - Belgium (%)
Place of birth for the foreign-born population - France (%)
Place of birth for the foreign-born population - Germany (%)
Place of birth for the foreign-born population - Netherlands (%)
Place of birth for the foreign-born population - Switzerland (%)
Place of birth for the foreign-born population - Other Western Europe (%)
Place of birth for the foreign-born population - Greece (%)
Place of birth for the foreign-born population - Italy (%)
Place of birth for the foreign-born population - Portugal (%)
Place of birth for the foreign-born population - Spain (%)
Place of birth for the foreign-born population - Other Southern Europe (%)
Place of birth for the foreign-born population - Albania (%)
Place of birth for the foreign-born population - Belarus (%)
Place of birth for the foreign-born population - Bosnia and Herzegovina (%)
Place of birth for the foreign-born population - Bulgaria (%)
Place of birth for the foreign-born population - Croatia (%)
Place of birth for the foreign-born population - Czechoslovakia (%)
Place of birth for the foreign-born population - Hungary (%)
Place of birth for the foreign-born population - Latvia (%)
Place of birth for the foreign-born population - Lithuania (%)
Place of birth for the foreign-born population - North Macedonia (Macedonia) (%)
Place of birth for the foreign-born population - Moldova (%)
Place of birth for the foreign-born population - Poland (%)
Place of birth for the foreign-born population - Romania (%)
Place of birth for the foreign-born population - Russia (%)
Place of birth for the foreign-born population - Serbia (%)
Place of birth for the foreign-born population - Ukraine (%)
Place of birth for the foreign-born population - Other Eastern Europe (%)
Place of birth for the foreign-born population - China (%)
Place of birth for the foreign-born population - Hong Kong (%)
Place of birth for the foreign-born population - Taiwan (%)
Place of birth for the foreign-born population - Japan (%)
Place of birth for the foreign-born population - Korea (%)
Place of birth for the foreign-born population - Other Eastern Asia (%)
Place of birth for the foreign-born population - Afghanistan (%)
Place of birth for the foreign-born population - Bangladesh (%)
Place of birth for the foreign-born population - India (%)
Place of birth for the foreign-born population - Iran (%)
Place of birth for the foreign-born population - Kazakhstan (%)
Place of birth for the foreign-born population - Nepal (%)
Place of birth for the foreign-born population - Pakistan (%)
Place of birth for the foreign-born population - Sri Lanka (%)
Place of birth for the foreign-born population - Uzbekistan (%)
Place of birth for the foreign-born population - Other South Central Asia (%)
Place of birth for the foreign-born population - Burma (%)
Place of birth for the foreign-born population - Cambodia (%)
Place of birth for the foreign-born population - Indonesia (%)
Place of birth for the foreign-born population - Laos (%)
Place of birth for the foreign-born population - Malaysia (%)
Place of birth for the foreign-born population - Philippines (%)
Place of birth for the foreign-born population - Singapore (%)
Place of birth for the foreign-born population - Thailand (%)
Place of birth for the foreign-born population - Vietnam (%)
Place of birth for the foreign-born population - Other South Eastern Asia (%)
Place of birth for the foreign-born population - Armenia (%)
Place of birth for the foreign-born population - Iraq (%)
Place of birth for the foreign-born population - Israel (%)
Place of birth for the foreign-born population - Jordan (%)
Place of birth for the foreign-born population - Kuwait (%)
Place of birth for the foreign-born population - Lebanon (%)
Place of birth for the foreign-born population - Saudi Arabia (%)
Place of birth for the foreign-born population - Syria (%)
Place of birth for the foreign-born population - Turkey (%)
Place of birth for the foreign-born population - Yemen (%)
Place of birth for the foreign-born population - Other Western Asia (%)
Place of birth for the foreign-born population - Eritrea (%)
Place of birth for the foreign-born population - Ethiopia (%)
Place of birth for the foreign-born population - Kenya (%)
Place of birth for the foreign-born population - Somalia (%)
Place of birth for the foreign-born population - Uganda (%)
Place of birth for the foreign-born population - Zimbabwe (%)
Place of birth for the foreign-born population - Other Eastern Africa (%)
Place of birth for the foreign-born population - Cameroon (%)
Place of birth for the foreign-born population - Congo (%)
Place of birth for the foreign-born population - Democratic Republic of Congo (Zaire) (%)
Place of birth for the foreign-born population - Other Middle Africa (%)
Place of birth for the foreign-born population - Egypt (%)
Place of birth for the foreign-born population - Morocco (%)
Place of birth for the foreign-born population - Sudan (%)
Place of birth for the foreign-born population - Other Northern Africa (%)
Place of birth for the foreign-born population - South Africa (%)
Place of birth for the foreign-born population - Other Southern Africa (%)
Place of birth for the foreign-born population - Cabo Verde (%)
Place of birth for the foreign-born population - Ghana (%)
Place of birth for the foreign-born population - Liberia (%)
Place of birth for the foreign-born population - Nigeria (%)
Place of birth for the foreign-born population - Senegal (%)
Place of birth for the foreign-born population - Sierra Leone (%)
Place of birth for the foreign-born population - Other Western Africa (%)
Place of birth for the foreign-born population - Australia (%)
Place of birth for the foreign-born population - New Zealand (%)
Place of birth for the foreign-born population - Fiji (%)
Place of birth for the foreign-born population - Micronesia (%)
Place of birth for the foreign-born population - Bahamas (%)
Place of birth for the foreign-born population - Barbados (%)
Place of birth for the foreign-born population - Cuba (%)
Place of birth for the foreign-born population - Dominica (%)
Place of birth for the foreign-born population - Dominican Republic (%)
Place of birth for the foreign-born population - Grenada (%)
Place of birth for the foreign-born population - Haiti (%)
Place of birth for the foreign-born population - Jamaica (%)
Place of birth for the foreign-born population - St. Vincent and the Grenadines (%)
Place of birth for the foreign-born population - Trinidad and Tobago (%)
Place of birth for the foreign-born population - West Indies (%)
Place of birth for the foreign-born population - Other Caribbean (%)
Place of birth for the foreign-born population - Belize (%)
Place of birth for the foreign-born population - Costa Rica (%)
Place of birth for the foreign-born population - El Salvador (%)
Place of birth for the foreign-born population - Guatemala (%)
Place of birth for the foreign-born population - Honduras (%)
Place of birth for the foreign-born population - Mexico (%)
Place of birth for the foreign-born population - Nicaragua (%)
Place of birth for the foreign-born population - Panama (%)
Place of birth for the foreign-born population - Other Central America (%)
Place of birth for the foreign-born population - Argentina (%)
Place of birth for the foreign-born population - Bolivia (%)
Place of birth for the foreign-born population - Brazil (%)
Place of birth for the foreign-born population - Chile (%)
Place of birth for the foreign-born population - Colombia (%)
Place of birth for the foreign-born population - Ecuador (%)
Place of birth for the foreign-born population - Guyana (%)
Place of birth for the foreign-born population - Peru (%)
Place of birth for the foreign-born population - Uruguay (%)
Place of birth for the foreign-born population - Venezuela (%)
Place of birth for the foreign-born population - Other South America (%)
Place of birth for the foreign-born population - Canada (%)
Place of birth for the foreign-born population - Other Northern America (%)
Place of birth for the foreign-born population - Other (%)
Latest news about races in Shorewood, IL collected exclusively by city-data.com from local newspapers, TV, and radio stations
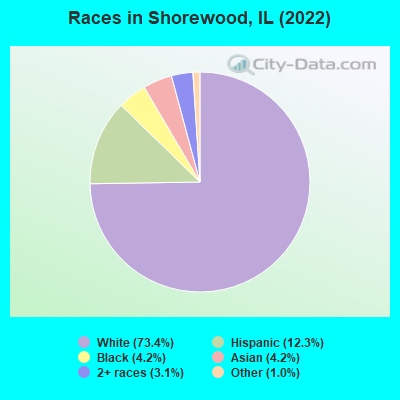
According to 2022 data, the most numerous races in Shorewood, IL are White alone (13,294 residents), Hispanic (2,219 residents), and Black alone (761 residents). 86.6% of Shorewood residents speak English at home. 7.0% of Shorewood, IL residents are foreign-born (3.3% born in Asia, 2.7% born in Latin America), which is 99.8% less than the foreign-born rate of 14.0% across the entire state of Illinois.
Race distribution in Shorewood
2000 2022
8,424,140 67.8% White alone 1,856,152 14.9% Black alone 1,530,262 12.3% Hispanic 419,916 3.4% Asian alone 153,996 1.2% Two or more races 13,479 0.1% Other race alone 18,232 0.1% American Indian alone 3,116 0.03% Native Hawaiian and Other
7,356,301 58.5% White alone 2,299,726 18.3% Hispanic 1,660,423 13.2% Black alone 747,296 5.9% Asian alone 458,599 3.6% Two or more races 45,386 0.4% Other race alone 10,405 0.08% American Indian alone 3,896 0.03% Native Hawaiian and Other
Income and house value in Shorewood Median household income in 2022 $120,254 White non-Hispanic householders$118,509 Black householders$81,275 Asian householders$74,903 Some other race householders$93,570 Two or more races householders$81,242 Hispanic or Latino race householdersMedian 2022 house value $328,242 White Non-Hispanic householders$451,562 Black or African American householders $370,773 Asian householders$414,322 Some other race householders$347,574 Hispanic or Latino householders
Median age by race in Shorewood
47.4 Median age for White residents43.8 49.6 31.4 Median age for Black or African American residents28.8 32.5 -801,714,897.4 Median age for American Indian / Alaska Native residents-764,890,281.4 -844,733,984.0 43.7 Median age for Asian residents37.4 46.7 -593,236,714.4 Median age for Native Hawaiian / Pacific Islander residents-658,536,584.7 -576,015,108.0 27.1 Median age for Other race residents31.5 19.8 22.4 Median age for Two or more races residents23.9 18.4 47.2 Median age for White alone residents44.1 50.1 26.6 Median age for Hispanic or Latino residents26.5 22.6
Owner/renter occupied households by race in Shorewood
House owners and renters - White residents 5,075 95.8% Owner occupied224 4.2% Renter occupiedHouse owners and renters - Black or African American residents 326 99.0% Owner occupied3 1.0% Renter occupiedHouse owners and renters - Asian residents 285 98.8% Owner occupied3 1.2% Renter occupiedHouse owners and renters - Other race residents 212 100.0% Owner occupiedHouse owners and renters - Two or more races residents 199 90.6% Owner occupied21 9.4% Renter occupiedHouse owners and renters - White alone residents 4,936 95.6% Owner occupied226 4.4% Renter occupiedHouse owners and renters - Hispanic or Latino residents 577 96.8% Owner occupied19 3.2% Renter occupied
Language usage in Shorewood
English speakers - Total 86.6% of residents of Shorewood speak English at home.
7.4% of residents speak Spanish at home 923 71.6% Speak English very well366 28.4% Speak English less than very well4.7% of residents speak other language at home 533 65.4% Speak English very well282 34.6% Speak English less than very well
English speakers - Born in the United States 97.4% of residents of Shorewood speak English at home.
1.2% of residents speak Spanish at home 31 100.0% Speak English very well0.1% of residents speak other language at home 2 100.0% Speak English less than very well
English speakers - Native, born elsewhere 42.2% of residents of Shorewood speak English at home.
33.3% of residents speak Spanish at home 29 64.4% Speak English very well16 35.6% Speak English less than very well15.6% of residents speak other language at home 21 100.0% Speak English less than very well
English speakers - Foreign-born 10.9% of residents of Shorewood speak English at home.
35.0% of residents speak Spanish at home 268 54.9% Speak English very well220 45.1% Speak English less than very well55.7% of residents speak other language at home 510 65.7% Speak English very well266 34.3% Speak English less than very well
White (Caucasian) - Speak only English Native:
100.0% (12,807)Foreign-born:
27.6% (76)
White (Caucasian) - Speak another language Native:
1.3% (168)Foreign-born:
73.8% (203)
Black or African American - Speak another language Native:
3.9% (24)Foreign-born:
100.0% (99)
Asian - Speak only English Native:
58.4% (65)Foreign-born:
5.3% (32)
Asian - Speak another language Native:
37.8% (42)Foreign-born:
97.0% (585)
Other race - Speak only English Native:
59.9% (488)Foreign-born:
10.0% (26)
Other race - Speak another language Native:
42.5% (346)Foreign-born:
90.4% (238)
Two or more races - Speak only English Native:
66.8% (771)Foreign-born:
17.0% (25)
Two or more races - Speak another language Native:
34.1% (393)Foreign-born:
83.2% (120)
White alone - Speak only English Native:
99.5% (12,502)Foreign-born:
48.6% (86)
White alone - Speak another language Native:
0.4% (50)Foreign-born:
50.2% (88)
Hispanic or Latino - Speak only English Native:
53.3% (846)Foreign-born:
7.5% (37)
Hispanic or Latino - Speak another language Native:
47.1% (747)Foreign-born:
92.5% (456)
Foreign-born residents in Shorewood 1,269 residents are foreign born (3.3% Asia , 2.7% Latin America ).
This city:
7.0%Illinois:
14.1%
Marital status for residents in Shorewood Marital status - White (Caucasian) population 15 years and over
Males 29.7% Never married58.9% Now married3.4% Separated1.9% Widowed6.2% DivorcedFemales 17.9% Never married62.1% Now married0.3% Separated9.2% Widowed10.5% DivorcedWomen who gave birth in the past 12 months Now married:
100.0% (61)Unmarried:
0.0% (0)
Women who did not give birth in the past 12 months Now married:
56.1% (1,351)Unmarried:
43.9% (1,058)
Marital status - Black or African American population 15 years and over
Males 50.4% Never married42.4% Now married0.0% Separated0.0% Widowed7.3% DivorcedFemales 52.1% Never married14.9% Now married5.5% Separated18.5% Widowed9.1% DivorcedWomen who did not give birth in the past 12 months Now married:
15.5% (39)Unmarried:
84.5% (212)
Marital status - Asian population 15 years and over
Males 9.1% Never married84.0% Now married0.0% Separated0.0% Widowed7.0% DivorcedFemales 4.4% Never married66.0% Now married0.0% Separated7.5% Widowed22.1% DivorcedWomen who gave birth in the past 12 months Now married:
66.7% (11)Unmarried:
33.3% (5)
Women who did not give birth in the past 12 months Now married:
69.9% (123)Unmarried:
30.1% (53)
Marital status - Other race population 15 years and over
Males 32.0% Never married68.0% Now married0.0% Separated0.0% Widowed0.0% DivorcedFemales 48.7% Never married42.2% Now married0.0% Separated0.0% Widowed9.1% DivorcedWomen who did not give birth in the past 12 months Now married:
41.1% (177)Unmarried:
58.9% (253)
Marital status - Two or more races population 15 years and over
Males 59.4% Never married34.2% Now married0.0% Separated0.0% Widowed6.4% DivorcedFemales 40.5% Never married37.0% Now married0.0% Separated7.8% Widowed14.7% DivorcedWomen who did not give birth in the past 12 months Now married:
27.7% (103)Unmarried:
72.3% (271)
Marital status - White alone, not Hispanic / Latino population 15 years and over
Males 28.6% Never married61.7% Now married1.0% Separated2.0% Widowed6.6% DivorcedFemales 17.6% Never married62.0% Now married0.1% Separated9.5% Widowed11.0% DivorcedWomen who gave birth in the past 12 months Now married:
100.0% (65)Unmarried:
0.0% (0)
Women who did not give birth in the past 12 months Now married:
54.8% (1,291)Unmarried:
45.2% (1,064)
Marital status - Hispanic or Latino population 15 years and over
Males 40.1% Never married39.1% Now married18.3% Separated0.0% Widowed2.5% DivorcedFemales 29.4% Never married58.3% Now married2.4% Separated1.5% Widowed8.4% DivorcedWomen who did not give birth in the past 12 months Now married:
59.4% (366)Unmarried:
40.6% (250)
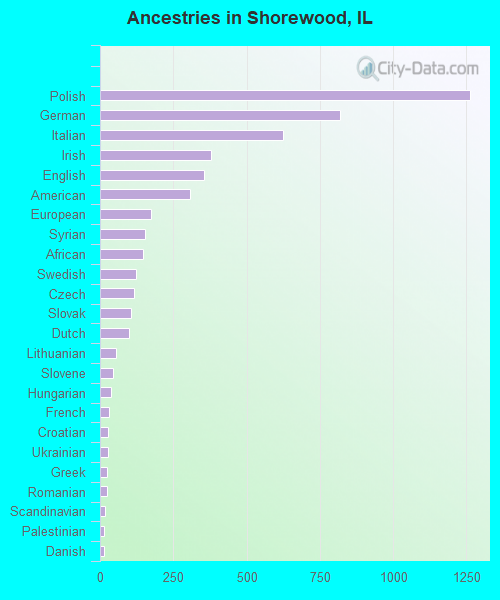
Ancestries in Shorewood
1,264 17.4% Polish818 11.3% German624 8.6% Italian378 5.2% Irish355 4.9% English306 4.2% American175 2.4% European153 2.1% Syrian147 2.0% African124 1.7% Swedish117 1.6% Czech106 1.5% Slovak99 1.4% Dutch54 0.7% Lithuanian44 0.6% Slovene36 0.5% Hungarian31 0.4% French27 0.4% Croatian26 0.4% Ukrainian25 0.3% Greek23 0.3% Romanian16 0.2% Scandinavian14 0.2% Palestinian12 0.2% Danish10 0.1% Arab10 0.1% Czechoslovakian10 0.1% Norwegian8 0.1% Eastern European4 0.06% Scotch-Irish
Children Nativity (place of birth) in Shorewood
Children under 6 years - Living with two parents Both parents native 493 100.0% NativeBoth parents foreign-born 138 100.0% NativeOne native, one foreign-born parent 21 100.0% NativeChildren under 6 years - Living with one parent Native parent 195 100.0% NativeForeign-born parent 31 100.0% NativeChildren 6 to 17 years - Living with two parents Both parents native 2,006 100.0% NativeBoth parents foreign-born 223 79.1% Native59 20.9% Foreign-bornOne native, one foreign-born parent 218 100.0% NativeChildren 6 to 17 years - Living with one parent Native parent 322 97.0% Native10 3.0% Foreign-bornForeign-born parent 11 100.0% Native
Grandparents responsible for own grandchildren in Shorewood
Grandparents (30 to 59 years) White / Caucasian 41 67.8% Responsible for grandchildren20 32.2% Not responsible for grandchildrenBlack or African American 60 100.0% Responsible for grandchildrenAsian 22 100.0% Responsible for grandchildrenTwo or more races 111 100.0% Responsible for grandchildrenWhite alone, not Hispanic / Latino 56 84.5% Responsible for grandchildren10 15.5% Not responsible for grandchildrenHispanic or Latino 13 100.0% Not responsible for grandchildrenGrandparents (60 years and over) White / Caucasian 27 13.5% Responsible for grandchildren173 86.5% Not responsible for grandchildrenBlack or African American 2 100.0% Not responsible for grandchildrenAsian 92 100.0% Not responsible for grandchildrenWhite alone, not Hispanic / Latino 29 14.1% Responsible for grandchildren179 85.9% Not responsible for grandchildren