Races in Spartanburg, South Carolina (SC) Detailed Stats
Data:
Races - White alone (%)
Races - White alone (% change since 2000)
Races - Black alone (%)
Races - Black alone (% change since 2000)
Races - American Indian alone (%)
Races - American Indian alone (% change since 2000)
Races - Asian alone (%)
Races - Asian alone (% change since 2000)
Races - Hispanic (%)
Races - Hispanic (% change since 2000)
Races - Native Hawaiian and Other Pacific Islander alone (%)
Races - Native Hawaiian and Other Pacific Islander alone (% change since 2000)
Races - Two or more races(%)
Races - Two or more races(% change since 2000)
Races - Other race alone (%)
Races - Other race alone (% change since 2000)
Racial diversity
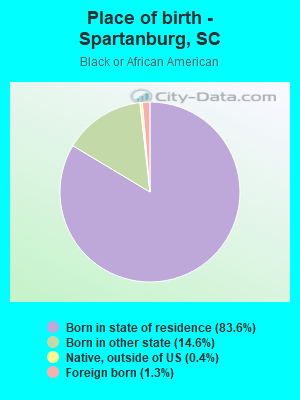
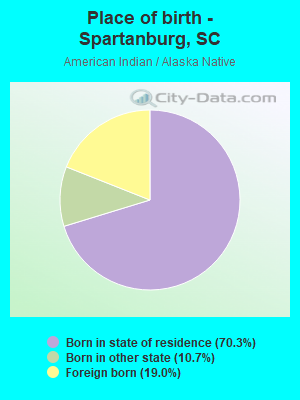
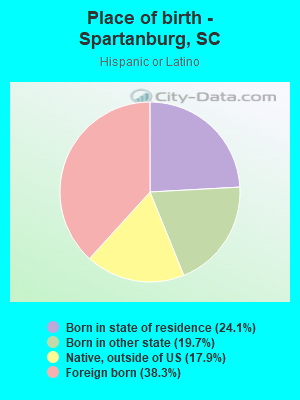
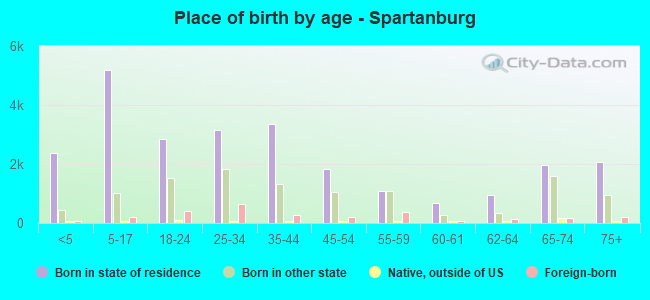
Place of birth - Born in state of residence (%)
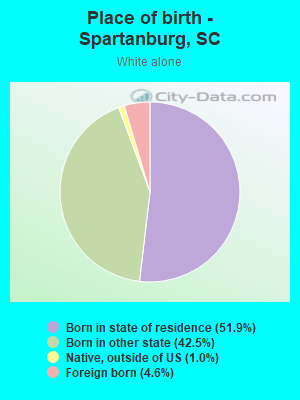
Place of birth - Born in state of residence (%) - White
Place of birth - Born in state of residence (%) - Black or African American
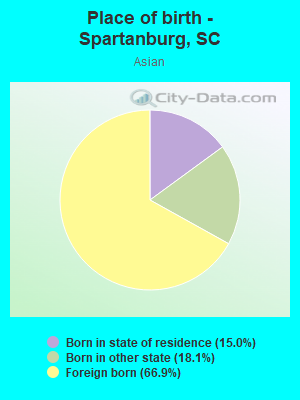
Place of birth - Born in state of residence (%) - Asian
Place of birth - Born in state of residence (%) - Hispanic or Latino
Place of birth - Born in state of residence (%) - American Indian and Alaska Native
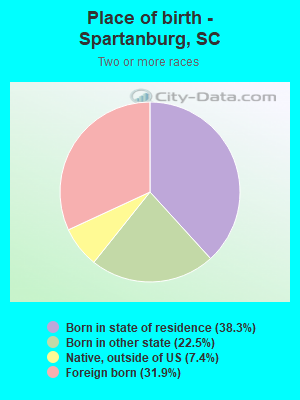
Place of birth - Born in state of residence (%) - Multirace
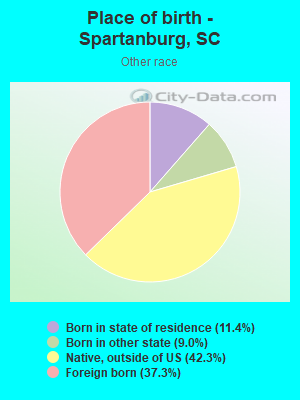
Place of birth - Born in state of residence (%) - Other Race
Place of birth - Born in other state (%)
Place of birth - Born in other state (%) - White
Place of birth - Born in other state (%) - Black or African American
Place of birth - Born in other state (%) - Asian
Place of birth - Born in other state (%) - Hispanic or Latino
Place of birth - Born in other state (%) - American Indian and Alaska Native
Place of birth - Born in other state (%) - Multirace
Place of birth - Born in other state (%) - Other Race
Place of birth - Native, outside of US (%)
Place of birth - Native, outside of US (%) - White
Place of birth - Native, outside of US (%) - Black or African American
Place of birth - Native, outside of US (%) - Asian
Place of birth - Native, outside of US (%) - Hispanic or Latino
Place of birth - Native, outside of US (%) - American Indian and Alaska Native
Place of birth - Native, outside of US (%) - Multirace
Place of birth - Native, outside of US (%) - Other Race
Place of birth - Foreign born (%)
Place of birth - Foreign born (%) - White
Place of birth - Foreign born (%) - Black or African American
Place of birth - Foreign born (%) - Asian
Place of birth - Foreign born (%) - Hispanic or Latino
Place of birth - Foreign born (%) - American Indian and Alaska Native
Place of birth - Foreign born (%) - Multirace
Place of birth - Foreign born (%) - Other Race
Residents speaking English at home (%)
Residents speaking English at home - Born in the United States (%)
Residents speaking English at home - Native, born elsewhere (%)
Residents speaking English at home - Foreign born (%)
Residents speaking Spanish at home (%)
Residents speaking Spanish at home - Born in the United States (%)
Residents speaking Spanish at home - Native, born elsewhere (%)
Residents speaking Spanish at home - Foreign born (%)
Residents speaking other language at home (%)
Residents speaking other language at home - Born in the United States (%)
Residents speaking other language at home - Native, born elsewhere (%)
Residents speaking other language at home - Foreign born (%)
Marital status - Never married (%)
Marital status - Now married (%)
Marital status - Separated (%)
Marital status - Widowed (%)
Marital status - Divorced (%)
Ancestries Reported - Arab (%)
Ancestries Reported - Czech (%)
Ancestries Reported - Danish (%)
Ancestries Reported - Dutch (%)
Ancestries Reported - English (%)
Ancestries Reported - French (%)
Ancestries Reported - French Canadian (%)
Ancestries Reported - German (%)
Ancestries Reported - Greek (%)
Ancestries Reported - Hungarian (%)
Ancestries Reported - Irish (%)
Ancestries Reported - Italian (%)
Ancestries Reported - Lithuanian (%)
Ancestries Reported - Norwegian (%)
Ancestries Reported - Polish (%)
Ancestries Reported - Portuguese (%)
Ancestries Reported - Russian (%)
Ancestries Reported - Scotch-Irish (%)
Ancestries Reported - Scottish (%)
Ancestries Reported - Slovak (%)
Ancestries Reported - Subsaharan African (%)
Ancestries Reported - Swedish (%)
Ancestries Reported - Swiss (%)
Ancestries Reported - Ukrainian (%)
Ancestries Reported - United States (%)
Ancestries Reported - Welsh (%)
Ancestries Reported - West Indian (%)
Ancestries Reported - Other (%)
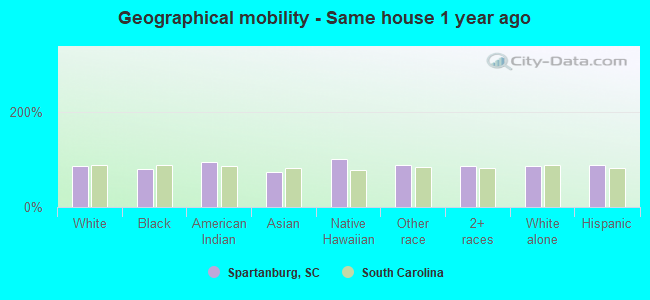
Geographical mobility - Same house 1 year ago (%)
Geographical mobility - Same house 1 year ago (%) - White
Geographical mobility - Same house 1 year ago (%) - Black or African American
Geographical mobility - Same house 1 year ago (%) - Asian
Geographical mobility - Same house 1 year ago (%) - Hispanic or Latino
Geographical mobility - Same house 1 year ago (%) - American Indian and Alaska Native
Geographical mobility - Same house 1 year ago (%) - Multirace
Geographical mobility - Same house 1 year ago (%) - Other Race
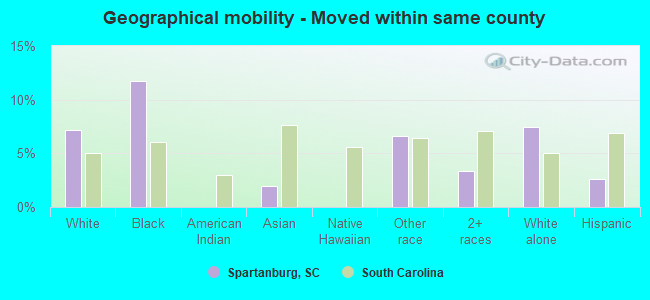
Geographical mobility - Moved within same county (%)
Geographical mobility - Moved within same county (%) - White
Geographical mobility - Moved within same county (%) - Black or African American
Geographical mobility - Moved within same county (%) - Asian
Geographical mobility - Moved within same county (%) - Hispanic or Latino
Geographical mobility - Moved within same county (%) - American Indian and Alaska Native
Geographical mobility - Moved within same county (%) - Multirace
Geographical mobility - Moved within same county (%) - Other Race
Geographical mobility - Moved from different county within same state (%)
Geographical mobility - Moved from different county within same state (%) - White
Geographical mobility - Moved from different county within same state (%) - Black or African American
Geographical mobility - Moved from different county within same state (%) - Asian
Geographical mobility - Moved from different county within same state (%) - Hispanic or Latino
Geographical mobility - Moved from different county within same state (%) - American Indian and Alaska Native
Geographical mobility - Moved from different county within same state (%) - Multirace
Geographical mobility - Moved from different county within same state (%) - Other Race
Geographical mobility - Moved from different state (%)
Geographical mobility - Moved from different state (%) - White
Geographical mobility - Moved from different state (%) - Black or African American
Geographical mobility - Moved from different state (%) - Asian
Geographical mobility - Moved from different state (%) - Hispanic or Latino
Geographical mobility - Moved from different state (%) - American Indian and Alaska Native
Geographical mobility - Moved from different state (%) - Multirace
Geographical mobility - Moved from different state (%) - Other Race
Geographical mobility - Moved from abroad (%)
Geographical mobility - Moved from abroad (%) - White
Geographical mobility - Moved from abroad (%) - Black or African American
Geographical mobility - Moved from abroad (%) - Asian
Geographical mobility - Moved from abroad (%) - Hispanic or Latino
Geographical mobility - Moved from abroad (%) - American Indian and Alaska Native
Geographical mobility - Moved from abroad (%) - Multirace
Geographical mobility - Moved from abroad (%) - Other Race
Place of birth for the foreign-born population - Ireland (%)
Place of birth for the foreign-born population - Denmark (%)
Place of birth for the foreign-born population - Norway (%)
Place of birth for the foreign-born population - Sweden (%)
Place of birth for the foreign-born population - United Kingdom (%)
Place of birth for the foreign-born population - England (%)
Place of birth for the foreign-born population - Scotland (%)
Place of birth for the foreign-born population - Other Northern Europe (%)
Place of birth for the foreign-born population - Austria (%)
Place of birth for the foreign-born population - Belgium (%)
Place of birth for the foreign-born population - France (%)
Place of birth for the foreign-born population - Germany (%)
Place of birth for the foreign-born population - Netherlands (%)
Place of birth for the foreign-born population - Switzerland (%)
Place of birth for the foreign-born population - Other Western Europe (%)
Place of birth for the foreign-born population - Greece (%)
Place of birth for the foreign-born population - Italy (%)
Place of birth for the foreign-born population - Portugal (%)
Place of birth for the foreign-born population - Spain (%)
Place of birth for the foreign-born population - Other Southern Europe (%)
Place of birth for the foreign-born population - Albania (%)
Place of birth for the foreign-born population - Belarus (%)
Place of birth for the foreign-born population - Bosnia and Herzegovina (%)
Place of birth for the foreign-born population - Bulgaria (%)
Place of birth for the foreign-born population - Croatia (%)
Place of birth for the foreign-born population - Czechoslovakia (%)
Place of birth for the foreign-born population - Hungary (%)
Place of birth for the foreign-born population - Latvia (%)
Place of birth for the foreign-born population - Lithuania (%)
Place of birth for the foreign-born population - North Macedonia (Macedonia) (%)
Place of birth for the foreign-born population - Moldova (%)
Place of birth for the foreign-born population - Poland (%)
Place of birth for the foreign-born population - Romania (%)
Place of birth for the foreign-born population - Russia (%)
Place of birth for the foreign-born population - Serbia (%)
Place of birth for the foreign-born population - Ukraine (%)
Place of birth for the foreign-born population - Other Eastern Europe (%)
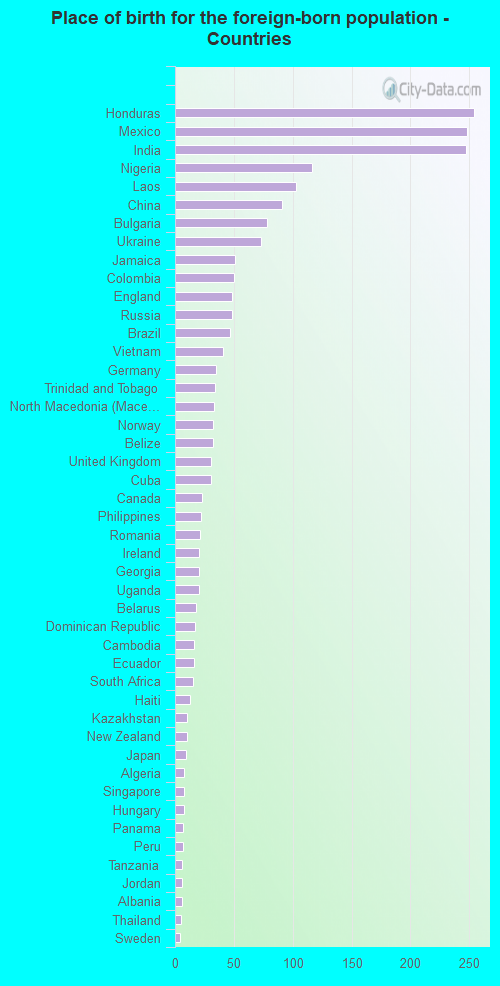
Place of birth for the foreign-born population - China (%)
Place of birth for the foreign-born population - Hong Kong (%)
Place of birth for the foreign-born population - Taiwan (%)
Place of birth for the foreign-born population - Japan (%)
Place of birth for the foreign-born population - Korea (%)
Place of birth for the foreign-born population - Other Eastern Asia (%)
Place of birth for the foreign-born population - Afghanistan (%)
Place of birth for the foreign-born population - Bangladesh (%)
Place of birth for the foreign-born population - India (%)
Place of birth for the foreign-born population - Iran (%)
Place of birth for the foreign-born population - Kazakhstan (%)
Place of birth for the foreign-born population - Nepal (%)
Place of birth for the foreign-born population - Pakistan (%)
Place of birth for the foreign-born population - Sri Lanka (%)
Place of birth for the foreign-born population - Uzbekistan (%)
Place of birth for the foreign-born population - Other South Central Asia (%)
Place of birth for the foreign-born population - Burma (%)
Place of birth for the foreign-born population - Cambodia (%)
Place of birth for the foreign-born population - Indonesia (%)
Place of birth for the foreign-born population - Laos (%)
Place of birth for the foreign-born population - Malaysia (%)
Place of birth for the foreign-born population - Philippines (%)
Place of birth for the foreign-born population - Singapore (%)
Place of birth for the foreign-born population - Thailand (%)
Place of birth for the foreign-born population - Vietnam (%)
Place of birth for the foreign-born population - Other South Eastern Asia (%)
Place of birth for the foreign-born population - Armenia (%)
Place of birth for the foreign-born population - Iraq (%)
Place of birth for the foreign-born population - Israel (%)
Place of birth for the foreign-born population - Jordan (%)
Place of birth for the foreign-born population - Kuwait (%)
Place of birth for the foreign-born population - Lebanon (%)
Place of birth for the foreign-born population - Saudi Arabia (%)
Place of birth for the foreign-born population - Syria (%)
Place of birth for the foreign-born population - Turkey (%)
Place of birth for the foreign-born population - Yemen (%)
Place of birth for the foreign-born population - Other Western Asia (%)
Place of birth for the foreign-born population - Eritrea (%)
Place of birth for the foreign-born population - Ethiopia (%)
Place of birth for the foreign-born population - Kenya (%)
Place of birth for the foreign-born population - Somalia (%)
Place of birth for the foreign-born population - Uganda (%)
Place of birth for the foreign-born population - Zimbabwe (%)
Place of birth for the foreign-born population - Other Eastern Africa (%)
Place of birth for the foreign-born population - Cameroon (%)
Place of birth for the foreign-born population - Congo (%)
Place of birth for the foreign-born population - Democratic Republic of Congo (Zaire) (%)
Place of birth for the foreign-born population - Other Middle Africa (%)
Place of birth for the foreign-born population - Egypt (%)
Place of birth for the foreign-born population - Morocco (%)
Place of birth for the foreign-born population - Sudan (%)
Place of birth for the foreign-born population - Other Northern Africa (%)
Place of birth for the foreign-born population - South Africa (%)
Place of birth for the foreign-born population - Other Southern Africa (%)
Place of birth for the foreign-born population - Cabo Verde (%)
Place of birth for the foreign-born population - Ghana (%)
Place of birth for the foreign-born population - Liberia (%)
Place of birth for the foreign-born population - Nigeria (%)
Place of birth for the foreign-born population - Senegal (%)
Place of birth for the foreign-born population - Sierra Leone (%)
Place of birth for the foreign-born population - Other Western Africa (%)
Place of birth for the foreign-born population - Australia (%)
Place of birth for the foreign-born population - New Zealand (%)
Place of birth for the foreign-born population - Fiji (%)
Place of birth for the foreign-born population - Micronesia (%)
Place of birth for the foreign-born population - Bahamas (%)
Place of birth for the foreign-born population - Barbados (%)
Place of birth for the foreign-born population - Cuba (%)
Place of birth for the foreign-born population - Dominica (%)
Place of birth for the foreign-born population - Dominican Republic (%)
Place of birth for the foreign-born population - Grenada (%)
Place of birth for the foreign-born population - Haiti (%)
Place of birth for the foreign-born population - Jamaica (%)
Place of birth for the foreign-born population - St. Vincent and the Grenadines (%)
Place of birth for the foreign-born population - Trinidad and Tobago (%)
Place of birth for the foreign-born population - West Indies (%)
Place of birth for the foreign-born population - Other Caribbean (%)
Place of birth for the foreign-born population - Belize (%)
Place of birth for the foreign-born population - Costa Rica (%)
Place of birth for the foreign-born population - El Salvador (%)
Place of birth for the foreign-born population - Guatemala (%)
Place of birth for the foreign-born population - Honduras (%)
Place of birth for the foreign-born population - Mexico (%)
Place of birth for the foreign-born population - Nicaragua (%)
Place of birth for the foreign-born population - Panama (%)
Place of birth for the foreign-born population - Other Central America (%)
Place of birth for the foreign-born population - Argentina (%)
Place of birth for the foreign-born population - Bolivia (%)
Place of birth for the foreign-born population - Brazil (%)
Place of birth for the foreign-born population - Chile (%)
Place of birth for the foreign-born population - Colombia (%)
Place of birth for the foreign-born population - Ecuador (%)
Place of birth for the foreign-born population - Guyana (%)
Place of birth for the foreign-born population - Peru (%)
Place of birth for the foreign-born population - Uruguay (%)
Place of birth for the foreign-born population - Venezuela (%)
Place of birth for the foreign-born population - Other South America (%)
Place of birth for the foreign-born population - Canada (%)
Place of birth for the foreign-born population - Other Northern America (%)
Place of birth for the foreign-born population - Other (%)
Latest news about races in Spartanburg, SC collected exclusively by city-data.com from local newspapers, TV, and radio stations
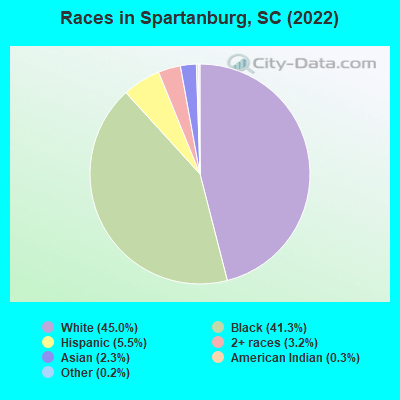
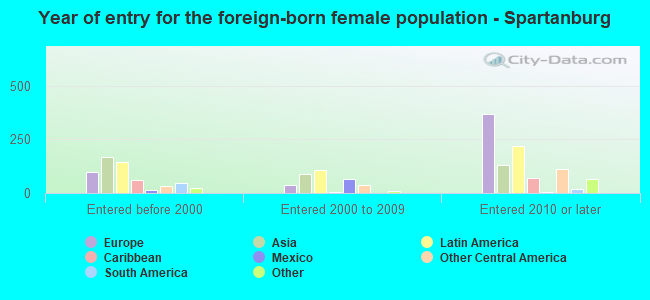
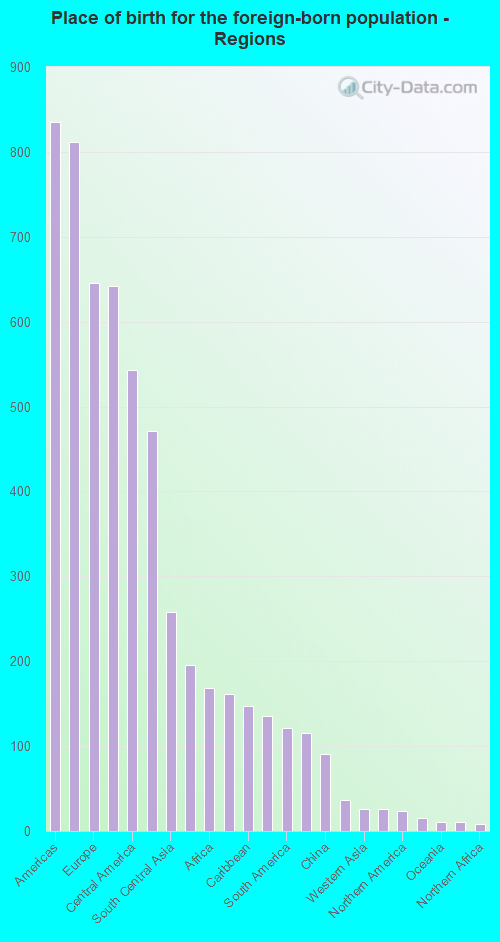
According to 2022 data, the most numerous races in Spartanburg, SC are White alone (18,040 residents), Black alone (16,558 residents), and Hispanic (2,199 residents). 92.1% of Spartanburg residents speak English at home. 5.7% of Spartanburg, SC residents are foreign-born (2.1% born in Latin America, 1.7% born in Europe, 1.7% born in Asia), which is 13.0% greater than the foreign-born rate of 5.0% across the entire state of South Carolina.
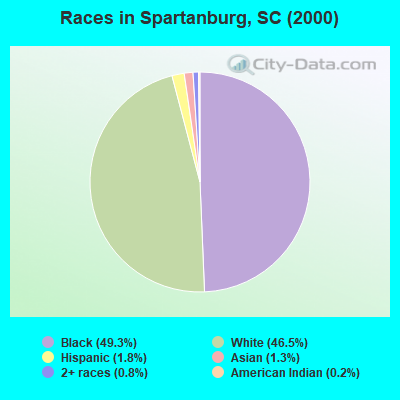
Race distribution in Spartanburg
2000 2022
2,652,291 66.1% White alone 1,178,486 29.4% Black alone 95,076 2.4% Hispanic 35,568 0.9% Asian alone 33,290 0.8% Two or more races 12,765 0.3% American Indian alone 3,266 0.08% Other race alone 1,270 0.03% Native Hawaiian and Other
3,301,739 62.5% White alone 1,313,290 24.9% Black alone 343,783 6.5% Hispanic 190,508 3.6% Two or more races 89,888 1.7% Asian alone 29,390 0.6% Other race alone 12,112 0.2% American Indian alone 1,924 0.04% Native Hawaiian and Other
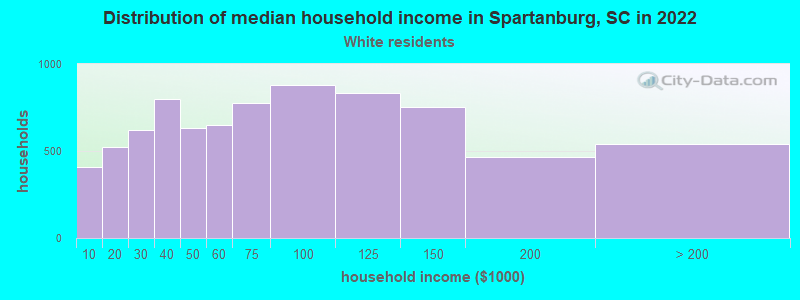
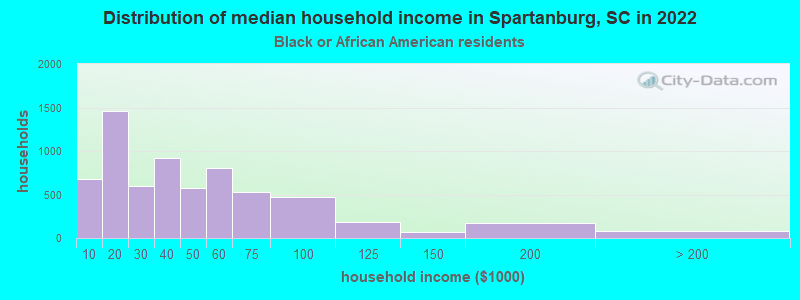
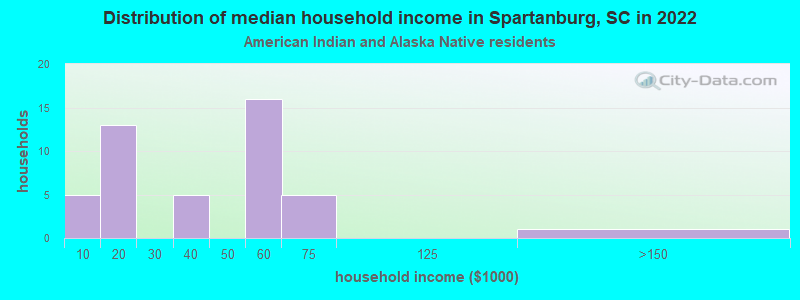
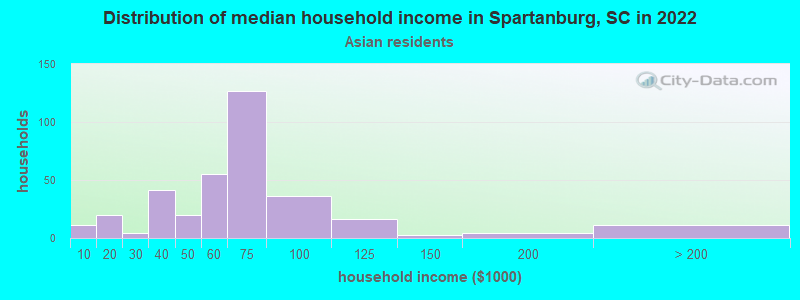
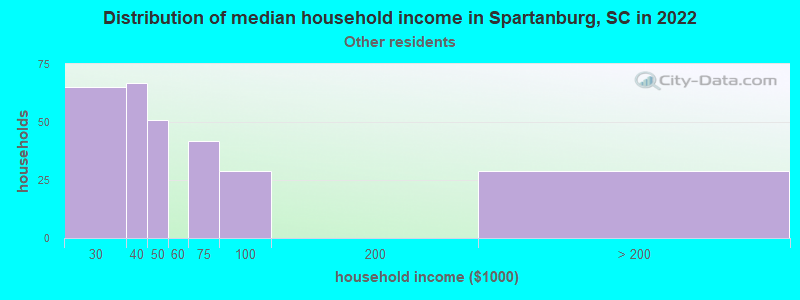
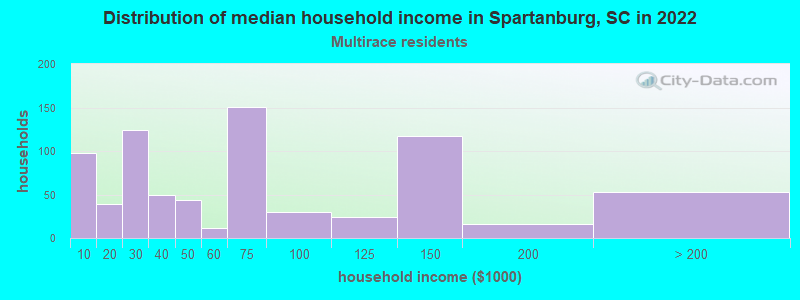
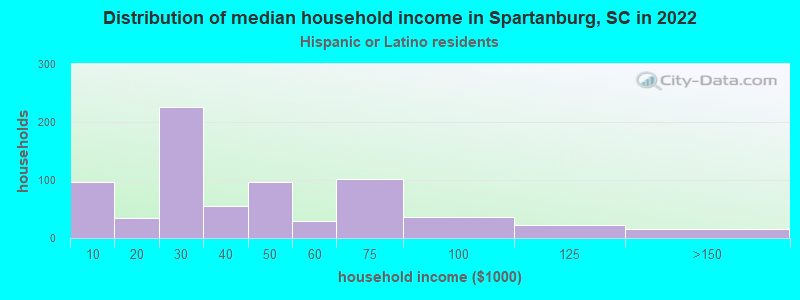
Income and house value in Spartanburg Median household income in 2022 $64,246 White non-Hispanic householders$34,174 Black householders$51,023 Asian householders$47,589 Some other race householders$26,956 Two or more races householders$34,260 Hispanic or Latino race householdersMedian 2022 house value $241,269 White Non-Hispanic householders$139,291 Black or African American householders$171,507 American Indian or Alaska Native householders $182,863 Asian householders$127,471 Some other race householders$166,176 Two or more races householders$251,003 Hispanic or Latino householders
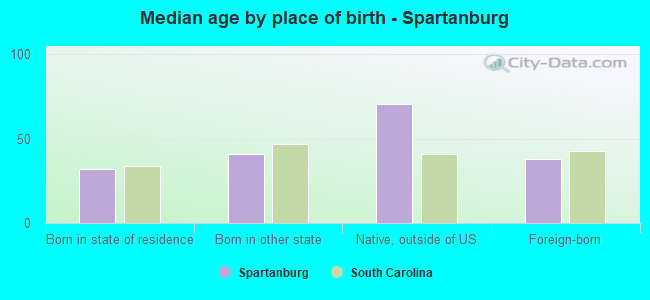
Median age by race in Spartanburg
37.3 Median age for White residents36.3 38.1 33.8 Median age for Black or African American residents30.3 37.5 21.9 Median age for American Indian / Alaska Native residents43.7 28.3 35.7 Median age for Asian residents32.3 37.8 -698,412,697.7 Median age for Native Hawaiian / Pacific Islander residents-551,574,375.1 -1,016,109,044.8 63.7 Median age for Other race residents63.1 60.5 25.7 Median age for Two or more races residents23.1 26.3 37.4 Median age for White alone residents36.4 37.7 25.9 Median age for Hispanic or Latino residents22.5 28.5
Owner/renter occupied households by race in Spartanburg
House owners and renters - White residents 5,485 69.7% Owner occupied2,385 30.3% Renter occupiedHouse owners and renters - Black or African American residents 2,312 34.5% Owner occupied4,381 65.5% Renter occupiedHouse owners and renters - American Indian / Alaska Native residents 15 43.4% Owner occupied20 56.6% Renter occupiedHouse owners and renters - Asian residents 196 63.1% Owner occupied114 36.9% Renter occupiedHouse owners and renters - Other race residents 126 43.7% Owner occupied162 56.3% Renter occupiedHouse owners and renters - Two or more races residents 394 32.1% Owner occupied834 67.9% Renter occupiedHouse owners and renters - White alone residents 5,492 70.0% Owner occupied2,357 30.0% Renter occupiedHouse owners and renters - Hispanic or Latino residents 313 33.8% Owner occupied614 66.2% Renter occupied
Language usage in Spartanburg
English speakers - Total 92.1% of residents of Spartanburg speak English at home.
3.2% of residents speak Spanish at home 610 51.7% Speak English very well570 48.3% Speak English less than very well4.4% of residents speak other language at home 1,045 64.5% Speak English very well574 35.5% Speak English less than very well
English speakers - Born in the United States 97.0% of residents of Spartanburg speak English at home.
1.7% of residents speak Spanish at home 128 69.9% Speak English very well55 30.1% Speak English less than very well1.6% of residents speak other language at home 129 72.9% Speak English very well48 27.1% Speak English less than very well
English speakers - Native, born elsewhere 66.9% of residents of Spartanburg speak English at home.
38.5% of residents speak Spanish at home 39 24.8% Speak English very well118 75.2% Speak English less than very well9.8% of residents speak other language at home 40 100.0% Speak English very well
English speakers - Foreign-born 21.2% of residents of Spartanburg speak English at home.
27.3% of residents speak Spanish at home 293 41.4% Speak English very well415 58.6% Speak English less than very well47.8% of residents speak other language at home 740 59.5% Speak English very well503 40.5% Speak English less than very well
White (Caucasian) - Speak only English Native:
99.2% (16,156)Foreign-born:
38.5% (276)
White (Caucasian) - Speak another language Native:
1.1% (183)Foreign-born:
63.2% (452)
Black or African American - Speak only English Native:
99.1% (15,595)Foreign-born:
39.3% (108)
Black or African American - Speak another language Native:
0.8% (120)Foreign-born:
61.2% (169)
American Indian / Alaska Native - Speak another language Native:
4.2% (4)Foreign-born:
100.0% (51)
Asian - Speak only English Native:
22.3% (59)Foreign-born:
5.3% (32)
Asian - Speak another language Native:
81.0% (213)Foreign-born:
95.9% (587)
Other race - Speak another language Native:
40.9% (93)Foreign-born:
95.9% (168)
Two or more races - Speak another language Native:
17.7% (274)Foreign-born:
99.0% (769)
White alone - Speak only English Native:
98.8% (15,711)Foreign-born:
29.8% (247)
White alone - Speak another language Native:
1.2% (190)Foreign-born:
69.6% (576)
Hispanic or Latino - Speak only English Native:
69.4% (758)Foreign-born:
7.9% (60)
Hispanic or Latino - Speak another language Native:
31.9% (348)Foreign-born:
92.1% (703)
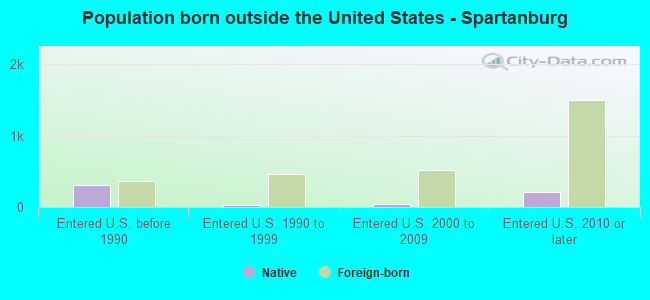
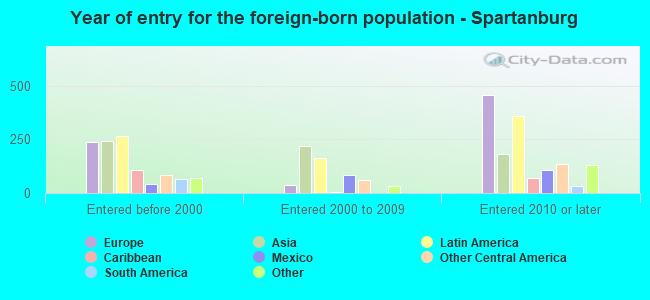
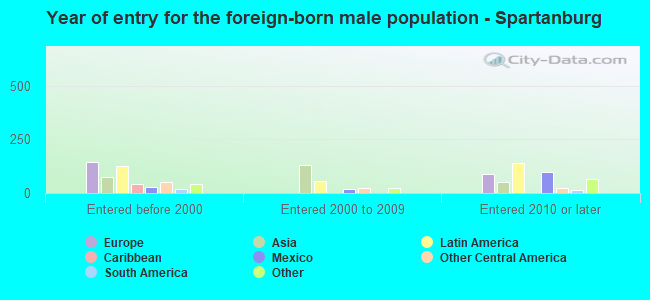
Foreign-born residents in Spartanburg 2,305 residents are foreign born (2.1% Latin America , 1.7% Europe , 1.7% Asia ).
This city:
5.7%South Carolina:
5.3%
Marital status for residents in Spartanburg Marital status - White (Caucasian) population 15 years and over
Males 33.3% Never married52.8% Now married1.7% Separated2.3% Widowed10.0% DivorcedFemales 27.1% Never married45.2% Now married2.1% Separated12.2% Widowed13.4% DivorcedWomen who gave birth in the past 12 months Now married:
88.4% (107)Unmarried:
11.6% (14)
Women who did not give birth in the past 12 months Now married:
47.7% (2,048)Unmarried:
52.3% (2,247)
Marital status - Black or African American population 15 years and over
Males 57.8% Never married25.1% Now married2.0% Separated4.6% Widowed10.5% DivorcedFemales 56.5% Never married16.9% Now married5.5% Separated8.4% Widowed12.8% DivorcedWomen who gave birth in the past 12 months Now married:
6.6% (19)Unmarried:
93.4% (277)
Women who did not give birth in the past 12 months Now married:
16.0% (634)Unmarried:
84.0% (3,338)
Marital status - American Indian / Alaska Native population 15 years and over
Males 6.7% Never married60.0% Now married0.0% Separated0.0% Widowed33.3% DivorcedFemales 59.1% Never married2.3% Now married0.0% Separated15.9% Widowed22.7% DivorcedWomen who did not give birth in the past 12 months Now married:
4.8% (3)Unmarried:
95.2% (55)
Marital status - Asian population 15 years and over
Males 51.5% Never married42.5% Now married0.0% Separated0.0% Widowed6.0% DivorcedFemales 27.8% Never married41.0% Now married4.1% Separated16.8% Widowed10.3% DivorcedWomen who gave birth in the past 12 months Now married:
100.0% (42)Unmarried:
0.0% (0)
Women who did not give birth in the past 12 months Now married:
26.3% (52)Unmarried:
73.7% (146)
Marital status - Other race population 15 years and over
Males 34.8% Never married50.0% Now married10.9% Separated0.0% Widowed4.3% DivorcedFemales 3.1% Never married48.1% Now married0.0% Separated28.8% Widowed20.0% DivorcedWomen who did not give birth in the past 12 months Now married:
86.5% (43)Unmarried:
13.5% (7)
Marital status - Two or more races population 15 years and over
Males 38.8% Never married23.0% Now married34.0% Separated0.5% Widowed3.7% DivorcedFemales 42.4% Never married37.1% Now married0.9% Separated10.8% Widowed8.8% DivorcedWomen who gave birth in the past 12 months Now married:
78.8% (103)Unmarried:
21.2% (28)
Women who did not give birth in the past 12 months Now married:
17.9% (83)Unmarried:
82.1% (383)
Marital status - White alone, not Hispanic / Latino population 15 years and over
Males 31.8% Never married54.3% Now married1.8% Separated2.2% Widowed9.9% DivorcedFemales 26.5% Never married45.9% Now married2.2% Separated12.4% Widowed13.1% DivorcedWomen who gave birth in the past 12 months Now married:
88.4% (110)Unmarried:
11.6% (14)
Women who did not give birth in the past 12 months Now married:
49.0% (2,088)Unmarried:
51.0% (2,174)
Marital status - Hispanic or Latino population 15 years and over
Males 36.0% Never married28.3% Now married27.3% Separated1.0% Widowed7.4% DivorcedFemales 34.2% Never married35.6% Now married0.0% Separated15.1% Widowed15.1% DivorcedWomen who gave birth in the past 12 months Now married:
100.0% (41)Unmarried:
0.0% (0)
Women who did not give birth in the past 12 months Now married:
27.6% (96)Unmarried:
72.4% (251)
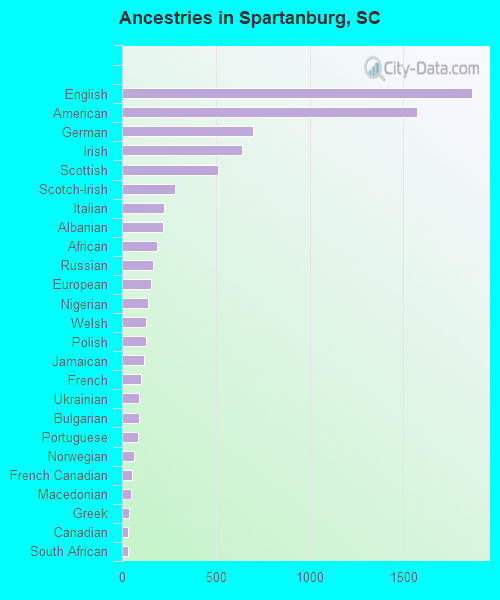
Ancestries in Spartanburg
1,863 7.7% English1,574 6.5% American696 2.9% German638 2.6% Irish512 2.1% Scottish280 1.2% Scotch-Irish223 0.9% Italian221 0.9% Albanian185 0.8% African163 0.7% Russian155 0.6% European139 0.6% Nigerian130 0.5% Welsh127 0.5% Polish116 0.5% Jamaican101 0.4% French88 0.4% Ukrainian88 0.4% Bulgarian83 0.3% Portuguese64 0.3% Norwegian53 0.2% French Canadian46 0.2% Macedonian37 0.2% Greek32 0.1% Canadian31 0.1% South African31 0.1% Swedish27 0.1% British26 0.1% Eastern European21 0.09% Celtic18 0.07% Danish17 0.07% Icelander16 0.07% Northern European16 0.07% Dutch14 0.06% Czech8 0.03% Croatian7 0.03% Hungarian7 0.03% West Indian6 0.02% Lithuanian6 0.02% Haitian5 0.02% Austrian4 0.02% Israeli
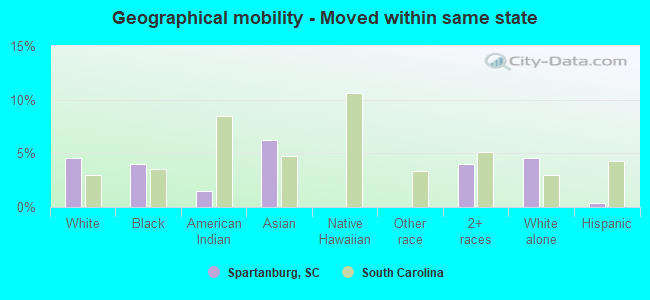
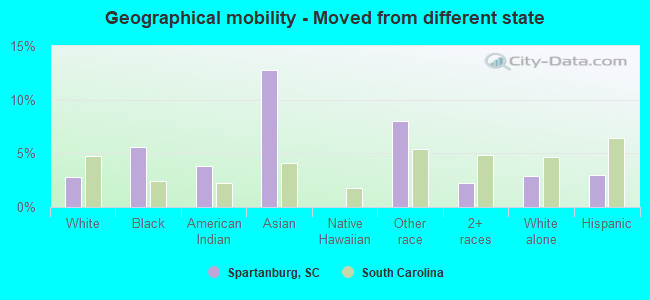
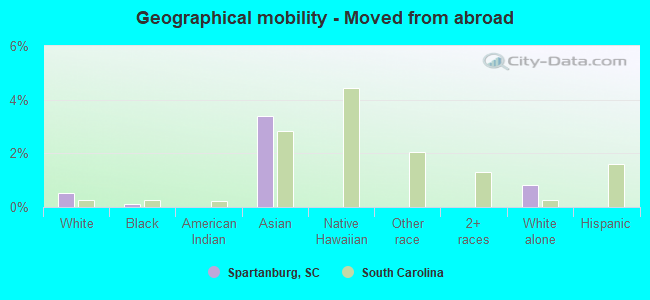
Geographical mobility in Spartanburg Same house 1 year ago 15,495 85.1% White (Caucasian)12,970 78.8% Black or African American144 94.5% American Indian / Alaska Native614 72.8% Asian5 100.0% Native Hawaiian / Pacific Islander428 86.9% Other race2,329 84.9% Two or more races15,172 84.6% White alone, not Hispanic / Latino1,946 88.9% Hispanic or LatinoMoved within same county 1,308 7.2% White / Caucasian1,937 11.8% Black or African American17 2.0% Asian32 6.6% Other race92 3.4% Two or more races1,334 7.4% White alone, not Hispanic / Latino58 2.7% Hispanic or LatinoMoved within same state 828 4.5% White / Caucasian652 4.0% Black or African American2 1.5% American Indian / Alaska Native52 6.2% Asian109 4.0% Two or more races827 4.6% White alone, not Hispanic / Latino8 0.4% Hispanic or LatinoMoved from different state 504 2.8% White / Caucasian923 5.6% Black or African American6 3.8% American Indian / Alaska Native107 12.7% Asian40 8.1% Other race62 2.2% Two or more races515 2.9% White alone, not Hispanic / Latino65 3.0% Hispanic or LatinoMoved from abroad 92 0.5% White21 0.1% Black or African American29 3.4% Asian149 0.8% White alone, not Hispanic / Latino
Children Nativity (place of birth) in Spartanburg
Children under 6 years - Living with two parents Both parents native 1,474 100.0% NativeBoth parents foreign-born 94 65.7% Native49 34.3% Foreign-bornOne native, one foreign-born parent 38 100.0% NativeChildren under 6 years - Living with one parent Native parent 1,630 100.0% NativeForeign-born parent 35 64.6% Native19 35.4% Foreign-bornChildren 6 to 17 years - Living with two parents Both parents native 1,322 100.0% NativeBoth parents foreign-born 78 91.6% Native7 8.4% Foreign-bornOne native, one foreign-born parent 82 100.0% NativeChildren 6 to 17 years - Living with one parent Native parent 3,592 100.0% NativeForeign-born parent 130 71.5% Native52 28.5% Foreign-born
Grandparents responsible for own grandchildren in Spartanburg
Grandparents (30 to 59 years) White / Caucasian 59 100.0% Responsible for grandchildrenBlack or African American 235 72.6% Responsible for grandchildren89 27.4% Not responsible for grandchildrenTwo or more races 6 100.0% Not responsible for grandchildrenWhite alone, not Hispanic / Latino 59 100.0% Responsible for grandchildrenGrandparents (60 years and over) White / Caucasian 36 30.8% Responsible for grandchildren81 69.2% Not responsible for grandchildrenBlack or African American 54 21.7% Responsible for grandchildren196 78.3% Not responsible for grandchildrenTwo or more races 18 100.0% Responsible for grandchildrenWhite alone, not Hispanic / Latino 36 30.3% Responsible for grandchildren82 69.7% Not responsible for grandchildren