Races in Springfield, Ohio (OH) Detailed Stats
Data:
Races - White alone (%)
Races - White alone (% change since 2000)
Races - Black alone (%)
Races - Black alone (% change since 2000)
Races - American Indian alone (%)
Races - American Indian alone (% change since 2000)
Races - Asian alone (%)
Races - Asian alone (% change since 2000)
Races - Hispanic (%)
Races - Hispanic (% change since 2000)
Races - Native Hawaiian and Other Pacific Islander alone (%)
Races - Native Hawaiian and Other Pacific Islander alone (% change since 2000)
Races - Two or more races(%)
Races - Two or more races(% change since 2000)
Races - Other race alone (%)
Races - Other race alone (% change since 2000)
Racial diversity
Place of birth - Born in state of residence (%)
Place of birth - Born in state of residence (%) - White
Place of birth - Born in state of residence (%) - Black or African American
Place of birth - Born in state of residence (%) - Asian
Place of birth - Born in state of residence (%) - Hispanic or Latino
Place of birth - Born in state of residence (%) - American Indian and Alaska Native
Place of birth - Born in state of residence (%) - Multirace
Place of birth - Born in state of residence (%) - Other Race
Place of birth - Born in other state (%)
Place of birth - Born in other state (%) - White
Place of birth - Born in other state (%) - Black or African American
Place of birth - Born in other state (%) - Asian
Place of birth - Born in other state (%) - Hispanic or Latino
Place of birth - Born in other state (%) - American Indian and Alaska Native
Place of birth - Born in other state (%) - Multirace
Place of birth - Born in other state (%) - Other Race
Place of birth - Native, outside of US (%)
Place of birth - Native, outside of US (%) - White
Place of birth - Native, outside of US (%) - Black or African American
Place of birth - Native, outside of US (%) - Asian
Place of birth - Native, outside of US (%) - Hispanic or Latino
Place of birth - Native, outside of US (%) - American Indian and Alaska Native
Place of birth - Native, outside of US (%) - Multirace
Place of birth - Native, outside of US (%) - Other Race
Place of birth - Foreign born (%)
Place of birth - Foreign born (%) - White
Place of birth - Foreign born (%) - Black or African American
Place of birth - Foreign born (%) - Asian
Place of birth - Foreign born (%) - Hispanic or Latino
Place of birth - Foreign born (%) - American Indian and Alaska Native
Place of birth - Foreign born (%) - Multirace
Place of birth - Foreign born (%) - Other Race
Residents speaking English at home (%)
Residents speaking English at home - Born in the United States (%)
Residents speaking English at home - Native, born elsewhere (%)
Residents speaking English at home - Foreign born (%)
Residents speaking Spanish at home (%)
Residents speaking Spanish at home - Born in the United States (%)
Residents speaking Spanish at home - Native, born elsewhere (%)
Residents speaking Spanish at home - Foreign born (%)
Residents speaking other language at home (%)
Residents speaking other language at home - Born in the United States (%)
Residents speaking other language at home - Native, born elsewhere (%)
Residents speaking other language at home - Foreign born (%)
Marital status - Never married (%)
Marital status - Now married (%)
Marital status - Separated (%)
Marital status - Widowed (%)
Marital status - Divorced (%)
Ancestries Reported - Arab (%)
Ancestries Reported - Czech (%)
Ancestries Reported - Danish (%)
Ancestries Reported - Dutch (%)
Ancestries Reported - English (%)
Ancestries Reported - French (%)
Ancestries Reported - French Canadian (%)
Ancestries Reported - German (%)
Ancestries Reported - Greek (%)
Ancestries Reported - Hungarian (%)
Ancestries Reported - Irish (%)
Ancestries Reported - Italian (%)
Ancestries Reported - Lithuanian (%)
Ancestries Reported - Norwegian (%)
Ancestries Reported - Polish (%)
Ancestries Reported - Portuguese (%)
Ancestries Reported - Russian (%)
Ancestries Reported - Scotch-Irish (%)
Ancestries Reported - Scottish (%)
Ancestries Reported - Slovak (%)
Ancestries Reported - Subsaharan African (%)
Ancestries Reported - Swedish (%)
Ancestries Reported - Swiss (%)
Ancestries Reported - Ukrainian (%)
Ancestries Reported - United States (%)
Ancestries Reported - Welsh (%)
Ancestries Reported - West Indian (%)
Ancestries Reported - Other (%)
Geographical mobility - Same house 1 year ago (%)
Geographical mobility - Same house 1 year ago (%) - White
Geographical mobility - Same house 1 year ago (%) - Black or African American
Geographical mobility - Same house 1 year ago (%) - Asian
Geographical mobility - Same house 1 year ago (%) - Hispanic or Latino
Geographical mobility - Same house 1 year ago (%) - American Indian and Alaska Native
Geographical mobility - Same house 1 year ago (%) - Multirace
Geographical mobility - Same house 1 year ago (%) - Other Race
Geographical mobility - Moved within same county (%)
Geographical mobility - Moved within same county (%) - White
Geographical mobility - Moved within same county (%) - Black or African American
Geographical mobility - Moved within same county (%) - Asian
Geographical mobility - Moved within same county (%) - Hispanic or Latino
Geographical mobility - Moved within same county (%) - American Indian and Alaska Native
Geographical mobility - Moved within same county (%) - Multirace
Geographical mobility - Moved within same county (%) - Other Race
Geographical mobility - Moved from different county within same state (%)
Geographical mobility - Moved from different county within same state (%) - White
Geographical mobility - Moved from different county within same state (%) - Black or African American
Geographical mobility - Moved from different county within same state (%) - Asian
Geographical mobility - Moved from different county within same state (%) - Hispanic or Latino
Geographical mobility - Moved from different county within same state (%) - American Indian and Alaska Native
Geographical mobility - Moved from different county within same state (%) - Multirace
Geographical mobility - Moved from different county within same state (%) - Other Race
Geographical mobility - Moved from different state (%)
Geographical mobility - Moved from different state (%) - White
Geographical mobility - Moved from different state (%) - Black or African American
Geographical mobility - Moved from different state (%) - Asian
Geographical mobility - Moved from different state (%) - Hispanic or Latino
Geographical mobility - Moved from different state (%) - American Indian and Alaska Native
Geographical mobility - Moved from different state (%) - Multirace
Geographical mobility - Moved from different state (%) - Other Race
Geographical mobility - Moved from abroad (%)
Geographical mobility - Moved from abroad (%) - White
Geographical mobility - Moved from abroad (%) - Black or African American
Geographical mobility - Moved from abroad (%) - Asian
Geographical mobility - Moved from abroad (%) - Hispanic or Latino
Geographical mobility - Moved from abroad (%) - American Indian and Alaska Native
Geographical mobility - Moved from abroad (%) - Multirace
Geographical mobility - Moved from abroad (%) - Other Race
Place of birth for the foreign-born population - Ireland (%)
Place of birth for the foreign-born population - Denmark (%)
Place of birth for the foreign-born population - Norway (%)
Place of birth for the foreign-born population - Sweden (%)
Place of birth for the foreign-born population - United Kingdom (%)
Place of birth for the foreign-born population - England (%)
Place of birth for the foreign-born population - Scotland (%)
Place of birth for the foreign-born population - Other Northern Europe (%)
Place of birth for the foreign-born population - Austria (%)
Place of birth for the foreign-born population - Belgium (%)
Place of birth for the foreign-born population - France (%)
Place of birth for the foreign-born population - Germany (%)
Place of birth for the foreign-born population - Netherlands (%)
Place of birth for the foreign-born population - Switzerland (%)
Place of birth for the foreign-born population - Other Western Europe (%)
Place of birth for the foreign-born population - Greece (%)
Place of birth for the foreign-born population - Italy (%)
Place of birth for the foreign-born population - Portugal (%)
Place of birth for the foreign-born population - Spain (%)
Place of birth for the foreign-born population - Other Southern Europe (%)
Place of birth for the foreign-born population - Albania (%)
Place of birth for the foreign-born population - Belarus (%)
Place of birth for the foreign-born population - Bosnia and Herzegovina (%)
Place of birth for the foreign-born population - Bulgaria (%)
Place of birth for the foreign-born population - Croatia (%)
Place of birth for the foreign-born population - Czechoslovakia (%)
Place of birth for the foreign-born population - Hungary (%)
Place of birth for the foreign-born population - Latvia (%)
Place of birth for the foreign-born population - Lithuania (%)
Place of birth for the foreign-born population - North Macedonia (Macedonia) (%)
Place of birth for the foreign-born population - Moldova (%)
Place of birth for the foreign-born population - Poland (%)
Place of birth for the foreign-born population - Romania (%)
Place of birth for the foreign-born population - Russia (%)
Place of birth for the foreign-born population - Serbia (%)
Place of birth for the foreign-born population - Ukraine (%)
Place of birth for the foreign-born population - Other Eastern Europe (%)
Place of birth for the foreign-born population - China (%)
Place of birth for the foreign-born population - Hong Kong (%)
Place of birth for the foreign-born population - Taiwan (%)
Place of birth for the foreign-born population - Japan (%)
Place of birth for the foreign-born population - Korea (%)
Place of birth for the foreign-born population - Other Eastern Asia (%)
Place of birth for the foreign-born population - Afghanistan (%)
Place of birth for the foreign-born population - Bangladesh (%)
Place of birth for the foreign-born population - India (%)
Place of birth for the foreign-born population - Iran (%)
Place of birth for the foreign-born population - Kazakhstan (%)
Place of birth for the foreign-born population - Nepal (%)
Place of birth for the foreign-born population - Pakistan (%)
Place of birth for the foreign-born population - Sri Lanka (%)
Place of birth for the foreign-born population - Uzbekistan (%)
Place of birth for the foreign-born population - Other South Central Asia (%)
Place of birth for the foreign-born population - Burma (%)
Place of birth for the foreign-born population - Cambodia (%)
Place of birth for the foreign-born population - Indonesia (%)
Place of birth for the foreign-born population - Laos (%)
Place of birth for the foreign-born population - Malaysia (%)
Place of birth for the foreign-born population - Philippines (%)
Place of birth for the foreign-born population - Singapore (%)
Place of birth for the foreign-born population - Thailand (%)
Place of birth for the foreign-born population - Vietnam (%)
Place of birth for the foreign-born population - Other South Eastern Asia (%)
Place of birth for the foreign-born population - Armenia (%)
Place of birth for the foreign-born population - Iraq (%)
Place of birth for the foreign-born population - Israel (%)
Place of birth for the foreign-born population - Jordan (%)
Place of birth for the foreign-born population - Kuwait (%)
Place of birth for the foreign-born population - Lebanon (%)
Place of birth for the foreign-born population - Saudi Arabia (%)
Place of birth for the foreign-born population - Syria (%)
Place of birth for the foreign-born population - Turkey (%)
Place of birth for the foreign-born population - Yemen (%)
Place of birth for the foreign-born population - Other Western Asia (%)
Place of birth for the foreign-born population - Eritrea (%)
Place of birth for the foreign-born population - Ethiopia (%)
Place of birth for the foreign-born population - Kenya (%)
Place of birth for the foreign-born population - Somalia (%)
Place of birth for the foreign-born population - Uganda (%)
Place of birth for the foreign-born population - Zimbabwe (%)
Place of birth for the foreign-born population - Other Eastern Africa (%)
Place of birth for the foreign-born population - Cameroon (%)
Place of birth for the foreign-born population - Congo (%)
Place of birth for the foreign-born population - Democratic Republic of Congo (Zaire) (%)
Place of birth for the foreign-born population - Other Middle Africa (%)
Place of birth for the foreign-born population - Egypt (%)
Place of birth for the foreign-born population - Morocco (%)
Place of birth for the foreign-born population - Sudan (%)
Place of birth for the foreign-born population - Other Northern Africa (%)
Place of birth for the foreign-born population - South Africa (%)
Place of birth for the foreign-born population - Other Southern Africa (%)
Place of birth for the foreign-born population - Cabo Verde (%)
Place of birth for the foreign-born population - Ghana (%)
Place of birth for the foreign-born population - Liberia (%)
Place of birth for the foreign-born population - Nigeria (%)
Place of birth for the foreign-born population - Senegal (%)
Place of birth for the foreign-born population - Sierra Leone (%)
Place of birth for the foreign-born population - Other Western Africa (%)
Place of birth for the foreign-born population - Australia (%)
Place of birth for the foreign-born population - New Zealand (%)
Place of birth for the foreign-born population - Fiji (%)
Place of birth for the foreign-born population - Micronesia (%)
Place of birth for the foreign-born population - Bahamas (%)
Place of birth for the foreign-born population - Barbados (%)
Place of birth for the foreign-born population - Cuba (%)
Place of birth for the foreign-born population - Dominica (%)
Place of birth for the foreign-born population - Dominican Republic (%)
Place of birth for the foreign-born population - Grenada (%)
Place of birth for the foreign-born population - Haiti (%)
Place of birth for the foreign-born population - Jamaica (%)
Place of birth for the foreign-born population - St. Vincent and the Grenadines (%)
Place of birth for the foreign-born population - Trinidad and Tobago (%)
Place of birth for the foreign-born population - West Indies (%)
Place of birth for the foreign-born population - Other Caribbean (%)
Place of birth for the foreign-born population - Belize (%)
Place of birth for the foreign-born population - Costa Rica (%)
Place of birth for the foreign-born population - El Salvador (%)
Place of birth for the foreign-born population - Guatemala (%)
Place of birth for the foreign-born population - Honduras (%)
Place of birth for the foreign-born population - Mexico (%)
Place of birth for the foreign-born population - Nicaragua (%)
Place of birth for the foreign-born population - Panama (%)
Place of birth for the foreign-born population - Other Central America (%)
Place of birth for the foreign-born population - Argentina (%)
Place of birth for the foreign-born population - Bolivia (%)
Place of birth for the foreign-born population - Brazil (%)
Place of birth for the foreign-born population - Chile (%)
Place of birth for the foreign-born population - Colombia (%)
Place of birth for the foreign-born population - Ecuador (%)
Place of birth for the foreign-born population - Guyana (%)
Place of birth for the foreign-born population - Peru (%)
Place of birth for the foreign-born population - Uruguay (%)
Place of birth for the foreign-born population - Venezuela (%)
Place of birth for the foreign-born population - Other South America (%)
Place of birth for the foreign-born population - Canada (%)
Place of birth for the foreign-born population - Other Northern America (%)
Place of birth for the foreign-born population - Other (%)
Latest news about races in Springfield, OH collected exclusively by city-data.com from local newspapers, TV, and radio stations
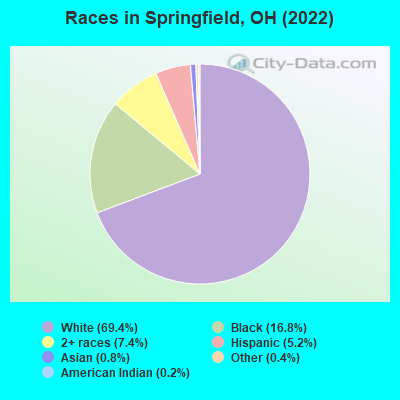
According to 2022 data, the most numerous races in Springfield, OH are White alone (40,371 residents), Black alone (9,750 residents), and Two or more races (4,320 residents). 95.2% of Springfield residents speak English at home. 3.2% of Springfield, OH residents are foreign-born (2.0% born in Latin America, 0.5% born in Asia), which is 26.7% less than the foreign-born rate of 4.0% across the entire state of Ohio.
Race distribution in Springfield
2000 2022
9,538,111 84.0% White alone 1,290,662 11.4% Black alone 217,123 1.9% Hispanic 137,770 1.2% Two or more races 131,670 1.2% Asian alone 21,985 0.2% American Indian alone 13,483 0.1% Other race alone 2,336 0.02% Native Hawaiian and Other
8,948,793 76.1% White alone 1,401,403 11.9% Black alone 529,291 4.5% Two or more races 517,232 4.4% Hispanic 293,387 2.5% Asian alone 52,805 0.4% Other race alone 9,785 0.08% American Indian alone 3,362 0.03% Native Hawaiian and Other
Income and house value in Springfield Median household income in 2022 $43,031 White non-Hispanic householders$30,203 Black householders$10,083 American Indian and Alaska Native householders$76,668 Asian householders$39,999 Some other race householders$52,737 Two or more races householders$65,730 Hispanic or Latino race householdersMedian 2022 house value $119,274 White Non-Hispanic householders$103,393 Black or African American householders$296,448 American Indian or Alaska Native householders $267,664 Asian householders$111,664 Some other race householders$104,220 Two or more races householders$117,123 Hispanic or Latino householders
Median age by race in Springfield
40.7 Median age for White residents40.7 40.9 38.9 Median age for Black or African American residents35.0 41.4 72.8 Median age for American Indian / Alaska Native residents-685,185,184.5 63.5 21.5 Median age for Asian residents24.3 35.7 49.3 Median age for Native Hawaiian / Pacific Islander residents-666,666,666.0 29.7 14.2 Median age for Other race residents33.9 10.8 16.9 Median age for Two or more races residents15.5 18.2 41.0 Median age for White alone residents41.5 40.9 18.1 Median age for Hispanic or Latino residents16.8 19.7
Owner/renter occupied households by race in Springfield
House owners and renters - White residents 10,183 54.3% Owner occupied8,558 45.7% Renter occupiedHouse owners and renters - Black or African American residents 1,599 39.9% Owner occupied2,410 60.1% Renter occupiedHouse owners and renters - American Indian / Alaska Native residents 3 7.3% Owner occupied42 92.7% Renter occupiedHouse owners and renters - Asian residents 48 32.9% Owner occupied98 67.1% Renter occupiedHouse owners and renters - Native Hawaiian / Pacific Islander residents 6 100.0% Owner occupiedHouse owners and renters - Other race residents 13 8.8% Owner occupied137 91.2% Renter occupiedHouse owners and renters - Two or more races residents 690 50.0% Owner occupied690 50.0% Renter occupiedHouse owners and renters - White alone residents 10,135 54.8% Owner occupied8,349 45.2% Renter occupiedHouse owners and renters - Hispanic or Latino residents 190 28.7% Owner occupied472 71.3% Renter occupied
Language usage in Springfield
English speakers - Total 95.2% of residents of Springfield speak English at home.
2.8% of residents speak Spanish at home 889 58.8% Speak English very well623 41.2% Speak English less than very well1.8% of residents speak other language at home 336 33.5% Speak English very well667 66.5% Speak English less than very well
English speakers - Born in the United States 97.5% of residents of Springfield speak English at home.
2.3% of residents speak Spanish at home 158 74.5% Speak English very well54 25.5% Speak English less than very well0.1% of residents speak other language at home 11 100.0% Speak English very well
English speakers - Native, born elsewhere 60.0% of residents of Springfield speak English at home.
22.6% of residents speak Spanish at home 66 66.7% Speak English very well33 33.3% Speak English less than very well19.4% of residents speak other language at home 15 17.6% Speak English very well70 82.4% Speak English less than very well
English speakers - Foreign-born 14.9% of residents of Springfield speak English at home.
43.8% of residents speak Spanish at home 316 39.3% Speak English very well489 60.7% Speak English less than very well41.9% of residents speak other language at home 204 26.5% Speak English very well566 73.5% Speak English less than very well
White (Caucasian) - Speak only English Native:
99.1% (38,339)Foreign-born:
15.7% (83)
White (Caucasian) - Speak another language Native:
1.0% (386)Foreign-born:
81.9% (432)
Black or African American - Speak only English Native:
98.6% (8,667)Foreign-born:
31.3% (147)
Black or African American - Speak another language Native:
1.3% (117)Foreign-born:
69.1% (325)
Asian - Speak only English Native:
90.9% (122)Foreign-born:
13.6% (40)
Asian - Speak another language Native:
11.3% (15)Foreign-born:
86.4% (256)
Other race - Speak another language Native:
20.8% (159)Foreign-born:
100.0% (171)
Two or more races - Speak only English Native:
92.9% (4,191)Foreign-born:
4.1% (18)
Two or more races - Speak another language Native:
6.7% (300)Foreign-born:
98.4% (432)
White alone - Speak only English Native:
99.4% (37,825)Foreign-born:
75.4% (85)
White alone - Speak another language Native:
0.6% (218)Foreign-born:
25.6% (29)
Hispanic or Latino - Speak another language Native:
28.4% (543)Foreign-born:
100.0% (806)
Foreign-born residents in Springfield 1,837 residents are foreign born (2.0% Latin America , 0.5% Asia ).
Marital status for residents in Springfield Marital status - White (Caucasian) population 15 years and over
Males 38.4% Never married38.8% Now married2.9% Separated4.3% Widowed15.6% DivorcedFemales 31.6% Never married33.9% Now married2.8% Separated13.7% Widowed18.1% DivorcedWomen who gave birth in the past 12 months Now married:
52.5% (342)Unmarried:
47.5% (309)
Women who did not give birth in the past 12 months Now married:
34.3% (3,286)Unmarried:
65.7% (6,293)
Marital status - Black or African American population 15 years and over
Males 55.8% Never married26.8% Now married2.2% Separated4.3% Widowed10.8% DivorcedFemales 48.9% Never married23.9% Now married4.6% Separated9.6% Widowed13.1% DivorcedWomen who gave birth in the past 12 months Now married:
0.0% (0)Unmarried:
100.0% (209)
Women who did not give birth in the past 12 months Now married:
26.7% (511)Unmarried:
73.3% (1,406)
Marital status - American Indian / Alaska Native population 15 years and over
Males 100.0% Never married0.0% Now married0.0% Separated0.0% Widowed0.0% DivorcedFemales 0.0% Never married7.9% Now married0.0% Separated78.9% Widowed13.2% DivorcedWomen who did not give birth in the past 12 months Now married:
0.0% (0)Unmarried:
100.0% (6)
Marital status - Asian population 15 years and over
Males 74.4% Never married25.6% Now married0.0% Separated0.0% Widowed0.0% DivorcedFemales 37.5% Never married35.2% Now married0.0% Separated0.0% Widowed27.3% DivorcedWomen who did not give birth in the past 12 months Now married:
33.7% (34)Unmarried:
66.3% (67)
Marital status - Native Hawaiian / Pacific Islander population 15 years and over
Males 0.0% Never married100.0% Now married0.0% Separated0.0% Widowed0.0% DivorcedFemales 76.0% Never married0.0% Now married0.0% Separated24.0% Widowed0.0% DivorcedWomen who did not give birth in the past 12 months Now married:
0.0% (0)Unmarried:
100.0% (20)
Marital status - Other race population 15 years and over
Males 43.5% Never married16.5% Now married0.0% Separated0.0% Widowed40.0% DivorcedFemales 78.9% Never married14.3% Now married0.0% Separated0.0% Widowed6.8% DivorcedWomen who did not give birth in the past 12 months Now married:
14.3% (30)Unmarried:
85.7% (182)
Marital status - Two or more races population 15 years and over
Males 57.5% Never married35.1% Now married0.3% Separated1.1% Widowed6.1% DivorcedFemales 60.8% Never married15.6% Now married1.2% Separated13.1% Widowed9.3% DivorcedWomen who gave birth in the past 12 months Now married:
30.0% (20)Unmarried:
70.0% (47)
Women who did not give birth in the past 12 months Now married:
16.3% (216)Unmarried:
83.7% (1,110)
Marital status - White alone, not Hispanic / Latino population 15 years and over
Males 38.1% Never married38.6% Now married2.9% Separated4.5% Widowed15.9% DivorcedFemales 31.1% Never married34.3% Now married2.7% Separated13.5% Widowed18.4% DivorcedWomen who gave birth in the past 12 months Now married:
54.7% (343)Unmarried:
45.3% (284)
Women who did not give birth in the past 12 months Now married:
34.4% (3,192)Unmarried:
65.6% (6,077)
Marital status - Hispanic or Latino population 15 years and over
Males 47.6% Never married39.2% Now married0.0% Separated0.2% Widowed13.0% DivorcedFemales 60.1% Never married18.2% Now married3.9% Separated11.0% Widowed6.8% DivorcedWomen who gave birth in the past 12 months Now married:
0.0% (0)Unmarried:
100.0% (45)
Women who did not give birth in the past 12 months Now married:
24.9% (179)Unmarried:
75.1% (541)
Ancestries in Springfield
3,333 12.7% German2,892 11.0% American2,323 8.9% English1,650 6.3% Irish847 3.2% Haitian819 3.1% Italian441 1.7% European177 0.7% Scotch-Irish170 0.6% African155 0.6% Scottish152 0.6% Eastern European147 0.6% Polish101 0.4% French81 0.3% Greek75 0.3% Swiss68 0.3% Dutch67 0.3% Welsh65 0.2% Nigerian63 0.2% Ethiopian60 0.2% Canadian56 0.2% French Canadian44 0.2% Norwegian42 0.2% Czech30 0.1% Slovak25 0.10% British18 0.07% Slavic16 0.06% Danish16 0.06% Pennsylvania German15 0.06% Portuguese14 0.05% Czechoslovakian14 0.05% Lithuanian13 0.05% Hungarian11 0.04% Scandinavian11 0.04% Palestinian10 0.04% Macedonian9 0.03% Russian8 0.03% Swedish7 0.03% Slovene5 0.02% Iranian5 0.02% Celtic5 0.02% Sierra Leonean3 0.01% Romanian3 0.01% West Indian
Geographical mobility in Springfield Same house 1 year ago 33,968 83.2% White (Caucasian)7,807 81.9% Black or African American50 91.8% American Indian / Alaska Native312 72.7% Asian42 100.0% Native Hawaiian / Pacific Islander866 86.4% Other race4,394 76.4% Two or more races33,540 84.5% White alone, not Hispanic / Latino1,712 58.8% Hispanic or LatinoMoved within same county 2,455 6.0% White / Caucasian1,157 12.1% Black or African American4 7.9% American Indian / Alaska Native17 3.9% Asian109 10.9% Other race823 14.3% Two or more races2,326 5.9% White alone, not Hispanic / Latino833 28.6% Hispanic or LatinoMoved within same state 1,714 4.2% White / Caucasian341 3.6% Black or African American118 27.4% Asian283 4.9% Two or more races1,585 4.0% White alone, not Hispanic / LatinoMoved from different state 1,586 3.9% White / Caucasian304 3.2% Black or African American89 1.5% Two or more races1,499 3.8% White alone, not Hispanic / Latino198 6.8% Hispanic or LatinoMoved from abroad 40 0.1% White159 1.7% Black or African American40 0.7% Two or more races40 0.1% White alone, not Hispanic / Latino
Children Nativity (place of birth) in Springfield
Children under 6 years - Living with two parents Both parents native 1,360 100.0% NativeBoth parents foreign-born 147 100.0% NativeOne native, one foreign-born parent 44 100.0% NativeChildren under 6 years - Living with one parent Native parent 2,936 100.0% NativeForeign-born parent 69 100.0% NativeChildren 6 to 17 years - Living with two parents Both parents native 2,734 100.0% NativeBoth parents foreign-born 175 63.7% Native100 36.3% Foreign-bornOne native, one foreign-born parent 142 100.0% NativeChildren 6 to 17 years - Living with one parent Native parent 4,485 100.0% NativeForeign-born parent 123 50.4% Native121 49.6% Foreign-born
Grandparents responsible for own grandchildren in Springfield
Grandparents (30 to 59 years) White / Caucasian 517 66.6% Responsible for grandchildren259 33.4% Not responsible for grandchildrenBlack or African American 7 14.7% Responsible for grandchildren38 85.3% Not responsible for grandchildrenOther race 7 32.2% Responsible for grandchildren15 67.8% Not responsible for grandchildrenTwo or more races 70 80.0% Responsible for grandchildren18 20.0% Not responsible for grandchildrenWhite alone, not Hispanic / Latino 525 66.5% Responsible for grandchildren264 33.5% Not responsible for grandchildrenHispanic or Latino 10 100.0% Not responsible for grandchildrenGrandparents (60 years and over) White / Caucasian 196 59.3% Responsible for grandchildren134 40.7% Not responsible for grandchildrenBlack or African American 46 58.9% Responsible for grandchildren32 41.1% Not responsible for grandchildrenTwo or more races 25 85.9% Responsible for grandchildren4 14.1% Not responsible for grandchildrenWhite alone, not Hispanic / Latino 196 59.3% Responsible for grandchildren134 40.7% Not responsible for grandchildren