Races in Swanville, Maine (ME) Detailed Stats
Ancestries, Foreign-born residents, place of birth

Recent posts about races in Swanville, Maine on our local forum with over 2,400,000 registered users:
 | SoCal to Maine Move (10 replies) |
| Need to find apt/house rental in Belfast area - can't find much online - help! (9 replies) |
| Maine rivers to Innertube down? (8 replies) |
| I'm Here (85 replies) |
| Looking for a small piece of land (0 replies) |
| Feedback on Harmony, ME (14 replies) |
0.7% of Swanville, ME residents are foreign-born , which is 352.3% less than the foreign-born rate of 3.0% across the entire state of Maine.
Race distribution in Swanville

- 1,30095.8%White alone
- 392.9%Two or more races
- 151.1%Hispanic
- 20.1%Black alone
- 10.07%Asian alone

2000
2022
-
- 1,230,29796.5%White alone
- 11,7310.9%Two or more races
- 9,3600.7%Hispanic
- 9,0140.7%Asian alone
- 6,4400.5%Black alone
- 6,9110.5%American Indian alone
- 8360.07%Other race alone
- 3340.03%Native Hawaiian and Other
Pacific Islander alone

-
- 1,249,23390.2%White alone
- 58,3574.2%Two or more races
- 28,7172.1%Hispanic
- 21,5831.6%Black alone
- 16,1511.2%Asian alone
- 5,8730.4%Other race alone
- 5,2050.4%American Indian alone
- 2210.02%Native Hawaiian and Other
Pacific Islander alone

Income and house value in Swanville
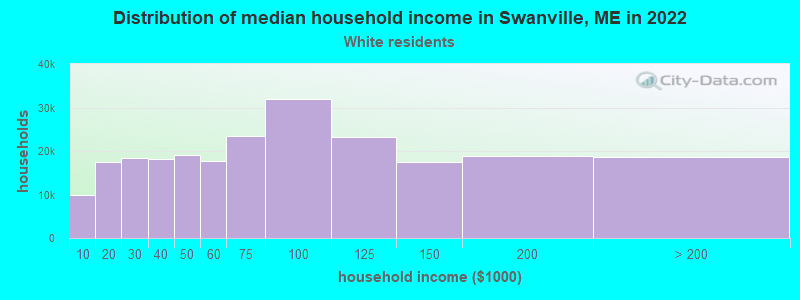
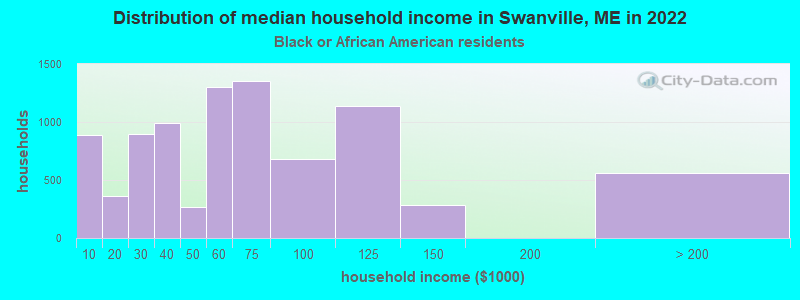
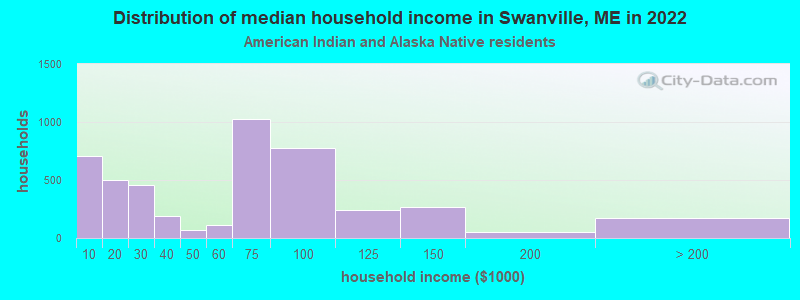
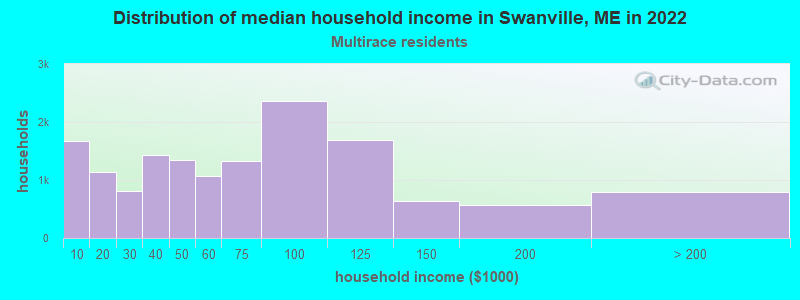
- Median household income in 2022
- $58,601White non-Hispanic householders
- $53,243Black householders
- $79,529American Indian and Alaska Native householders
- $65,998Two or more races householders
- Median 2022 house value
- $260,515White Non-Hispanic householders
- $328,565Black or African American householders
- $284,756Two or more races householders
Household income for White non-Hispanic householders
Household income for Black householders
Household income for American Indian and Alaska Native householders
Household income for Two or more races householders
Foreign-born residents in Swanville
9 residents are foreign born
| This city: | 0.7% |
| Maine: | 2.9% |
Ancestries in Swanville

- 30824.7%English
- 21116.9%Irish
- 13310.7%Other
- 1179.4%French
- 786.2%United States
- 705.6%German
- 655.2%Scotch-Irish
- 604.8%Scottish
- 564.5%Italian
- 544.3%French Canadian
- 312.5%Swedish
- 231.8%Norwegian
- 121.0%Polish
- 90.7%Dutch
- 70.6%Lithuanian
- 70.6%Russian
- 30.2%Swiss
- 20.2%Czech
- 20.2%West Indian

Zip codes: 04915.