Races in Toledo, Ohio (OH) Detailed Stats
Data:
Races - White alone (%)
Races - White alone (% change since 2000)
Races - Black alone (%)
Races - Black alone (% change since 2000)
Races - American Indian alone (%)
Races - American Indian alone (% change since 2000)
Races - Asian alone (%)
Races - Asian alone (% change since 2000)
Races - Hispanic (%)
Races - Hispanic (% change since 2000)
Races - Native Hawaiian and Other Pacific Islander alone (%)
Races - Native Hawaiian and Other Pacific Islander alone (% change since 2000)
Races - Two or more races(%)
Races - Two or more races(% change since 2000)
Races - Other race alone (%)
Races - Other race alone (% change since 2000)
Racial diversity
Place of birth - Born in state of residence (%)
Place of birth - Born in state of residence (%) - White
Place of birth - Born in state of residence (%) - Black or African American
Place of birth - Born in state of residence (%) - Asian
Place of birth - Born in state of residence (%) - Hispanic or Latino
Place of birth - Born in state of residence (%) - American Indian and Alaska Native
Place of birth - Born in state of residence (%) - Multirace
Place of birth - Born in state of residence (%) - Other Race
Place of birth - Born in other state (%)
Place of birth - Born in other state (%) - White
Place of birth - Born in other state (%) - Black or African American
Place of birth - Born in other state (%) - Asian
Place of birth - Born in other state (%) - Hispanic or Latino
Place of birth - Born in other state (%) - American Indian and Alaska Native
Place of birth - Born in other state (%) - Multirace
Place of birth - Born in other state (%) - Other Race
Place of birth - Native, outside of US (%)
Place of birth - Native, outside of US (%) - White
Place of birth - Native, outside of US (%) - Black or African American
Place of birth - Native, outside of US (%) - Asian
Place of birth - Native, outside of US (%) - Hispanic or Latino
Place of birth - Native, outside of US (%) - American Indian and Alaska Native
Place of birth - Native, outside of US (%) - Multirace
Place of birth - Native, outside of US (%) - Other Race
Place of birth - Foreign born (%)
Place of birth - Foreign born (%) - White
Place of birth - Foreign born (%) - Black or African American
Place of birth - Foreign born (%) - Asian
Place of birth - Foreign born (%) - Hispanic or Latino
Place of birth - Foreign born (%) - American Indian and Alaska Native
Place of birth - Foreign born (%) - Multirace
Place of birth - Foreign born (%) - Other Race
Residents speaking English at home (%)
Residents speaking English at home - Born in the United States (%)
Residents speaking English at home - Native, born elsewhere (%)
Residents speaking English at home - Foreign born (%)
Residents speaking Spanish at home (%)
Residents speaking Spanish at home - Born in the United States (%)
Residents speaking Spanish at home - Native, born elsewhere (%)
Residents speaking Spanish at home - Foreign born (%)
Residents speaking other language at home (%)
Residents speaking other language at home - Born in the United States (%)
Residents speaking other language at home - Native, born elsewhere (%)
Residents speaking other language at home - Foreign born (%)
Marital status - Never married (%)
Marital status - Now married (%)
Marital status - Separated (%)
Marital status - Widowed (%)
Marital status - Divorced (%)
Ancestries Reported - Arab (%)
Ancestries Reported - Czech (%)
Ancestries Reported - Danish (%)
Ancestries Reported - Dutch (%)
Ancestries Reported - English (%)
Ancestries Reported - French (%)
Ancestries Reported - French Canadian (%)
Ancestries Reported - German (%)
Ancestries Reported - Greek (%)
Ancestries Reported - Hungarian (%)
Ancestries Reported - Irish (%)
Ancestries Reported - Italian (%)
Ancestries Reported - Lithuanian (%)
Ancestries Reported - Norwegian (%)
Ancestries Reported - Polish (%)
Ancestries Reported - Portuguese (%)
Ancestries Reported - Russian (%)
Ancestries Reported - Scotch-Irish (%)
Ancestries Reported - Scottish (%)
Ancestries Reported - Slovak (%)
Ancestries Reported - Subsaharan African (%)
Ancestries Reported - Swedish (%)
Ancestries Reported - Swiss (%)
Ancestries Reported - Ukrainian (%)
Ancestries Reported - United States (%)
Ancestries Reported - Welsh (%)
Ancestries Reported - West Indian (%)
Ancestries Reported - Other (%)
Geographical mobility - Same house 1 year ago (%)
Geographical mobility - Same house 1 year ago (%) - White
Geographical mobility - Same house 1 year ago (%) - Black or African American
Geographical mobility - Same house 1 year ago (%) - Asian
Geographical mobility - Same house 1 year ago (%) - Hispanic or Latino
Geographical mobility - Same house 1 year ago (%) - American Indian and Alaska Native
Geographical mobility - Same house 1 year ago (%) - Multirace
Geographical mobility - Same house 1 year ago (%) - Other Race
Geographical mobility - Moved within same county (%)
Geographical mobility - Moved within same county (%) - White
Geographical mobility - Moved within same county (%) - Black or African American
Geographical mobility - Moved within same county (%) - Asian
Geographical mobility - Moved within same county (%) - Hispanic or Latino
Geographical mobility - Moved within same county (%) - American Indian and Alaska Native
Geographical mobility - Moved within same county (%) - Multirace
Geographical mobility - Moved within same county (%) - Other Race
Geographical mobility - Moved from different county within same state (%)
Geographical mobility - Moved from different county within same state (%) - White
Geographical mobility - Moved from different county within same state (%) - Black or African American
Geographical mobility - Moved from different county within same state (%) - Asian
Geographical mobility - Moved from different county within same state (%) - Hispanic or Latino
Geographical mobility - Moved from different county within same state (%) - American Indian and Alaska Native
Geographical mobility - Moved from different county within same state (%) - Multirace
Geographical mobility - Moved from different county within same state (%) - Other Race
Geographical mobility - Moved from different state (%)
Geographical mobility - Moved from different state (%) - White
Geographical mobility - Moved from different state (%) - Black or African American
Geographical mobility - Moved from different state (%) - Asian
Geographical mobility - Moved from different state (%) - Hispanic or Latino
Geographical mobility - Moved from different state (%) - American Indian and Alaska Native
Geographical mobility - Moved from different state (%) - Multirace
Geographical mobility - Moved from different state (%) - Other Race
Geographical mobility - Moved from abroad (%)
Geographical mobility - Moved from abroad (%) - White
Geographical mobility - Moved from abroad (%) - Black or African American
Geographical mobility - Moved from abroad (%) - Asian
Geographical mobility - Moved from abroad (%) - Hispanic or Latino
Geographical mobility - Moved from abroad (%) - American Indian and Alaska Native
Geographical mobility - Moved from abroad (%) - Multirace
Geographical mobility - Moved from abroad (%) - Other Race
Place of birth for the foreign-born population - Ireland (%)
Place of birth for the foreign-born population - Denmark (%)
Place of birth for the foreign-born population - Norway (%)
Place of birth for the foreign-born population - Sweden (%)
Place of birth for the foreign-born population - United Kingdom (%)
Place of birth for the foreign-born population - England (%)
Place of birth for the foreign-born population - Scotland (%)
Place of birth for the foreign-born population - Other Northern Europe (%)
Place of birth for the foreign-born population - Austria (%)
Place of birth for the foreign-born population - Belgium (%)
Place of birth for the foreign-born population - France (%)
Place of birth for the foreign-born population - Germany (%)
Place of birth for the foreign-born population - Netherlands (%)
Place of birth for the foreign-born population - Switzerland (%)
Place of birth for the foreign-born population - Other Western Europe (%)
Place of birth for the foreign-born population - Greece (%)
Place of birth for the foreign-born population - Italy (%)
Place of birth for the foreign-born population - Portugal (%)
Place of birth for the foreign-born population - Spain (%)
Place of birth for the foreign-born population - Other Southern Europe (%)
Place of birth for the foreign-born population - Albania (%)
Place of birth for the foreign-born population - Belarus (%)
Place of birth for the foreign-born population - Bosnia and Herzegovina (%)
Place of birth for the foreign-born population - Bulgaria (%)
Place of birth for the foreign-born population - Croatia (%)
Place of birth for the foreign-born population - Czechoslovakia (%)
Place of birth for the foreign-born population - Hungary (%)
Place of birth for the foreign-born population - Latvia (%)
Place of birth for the foreign-born population - Lithuania (%)
Place of birth for the foreign-born population - North Macedonia (Macedonia) (%)
Place of birth for the foreign-born population - Moldova (%)
Place of birth for the foreign-born population - Poland (%)
Place of birth for the foreign-born population - Romania (%)
Place of birth for the foreign-born population - Russia (%)
Place of birth for the foreign-born population - Serbia (%)
Place of birth for the foreign-born population - Ukraine (%)
Place of birth for the foreign-born population - Other Eastern Europe (%)
Place of birth for the foreign-born population - China (%)
Place of birth for the foreign-born population - Hong Kong (%)
Place of birth for the foreign-born population - Taiwan (%)
Place of birth for the foreign-born population - Japan (%)
Place of birth for the foreign-born population - Korea (%)
Place of birth for the foreign-born population - Other Eastern Asia (%)
Place of birth for the foreign-born population - Afghanistan (%)
Place of birth for the foreign-born population - Bangladesh (%)
Place of birth for the foreign-born population - India (%)
Place of birth for the foreign-born population - Iran (%)
Place of birth for the foreign-born population - Kazakhstan (%)
Place of birth for the foreign-born population - Nepal (%)
Place of birth for the foreign-born population - Pakistan (%)
Place of birth for the foreign-born population - Sri Lanka (%)
Place of birth for the foreign-born population - Uzbekistan (%)
Place of birth for the foreign-born population - Other South Central Asia (%)
Place of birth for the foreign-born population - Burma (%)
Place of birth for the foreign-born population - Cambodia (%)
Place of birth for the foreign-born population - Indonesia (%)
Place of birth for the foreign-born population - Laos (%)
Place of birth for the foreign-born population - Malaysia (%)
Place of birth for the foreign-born population - Philippines (%)
Place of birth for the foreign-born population - Singapore (%)
Place of birth for the foreign-born population - Thailand (%)
Place of birth for the foreign-born population - Vietnam (%)
Place of birth for the foreign-born population - Other South Eastern Asia (%)
Place of birth for the foreign-born population - Armenia (%)
Place of birth for the foreign-born population - Iraq (%)
Place of birth for the foreign-born population - Israel (%)
Place of birth for the foreign-born population - Jordan (%)
Place of birth for the foreign-born population - Kuwait (%)
Place of birth for the foreign-born population - Lebanon (%)
Place of birth for the foreign-born population - Saudi Arabia (%)
Place of birth for the foreign-born population - Syria (%)
Place of birth for the foreign-born population - Turkey (%)
Place of birth for the foreign-born population - Yemen (%)
Place of birth for the foreign-born population - Other Western Asia (%)
Place of birth for the foreign-born population - Eritrea (%)
Place of birth for the foreign-born population - Ethiopia (%)
Place of birth for the foreign-born population - Kenya (%)
Place of birth for the foreign-born population - Somalia (%)
Place of birth for the foreign-born population - Uganda (%)
Place of birth for the foreign-born population - Zimbabwe (%)
Place of birth for the foreign-born population - Other Eastern Africa (%)
Place of birth for the foreign-born population - Cameroon (%)
Place of birth for the foreign-born population - Congo (%)
Place of birth for the foreign-born population - Democratic Republic of Congo (Zaire) (%)
Place of birth for the foreign-born population - Other Middle Africa (%)
Place of birth for the foreign-born population - Egypt (%)
Place of birth for the foreign-born population - Morocco (%)
Place of birth for the foreign-born population - Sudan (%)
Place of birth for the foreign-born population - Other Northern Africa (%)
Place of birth for the foreign-born population - South Africa (%)
Place of birth for the foreign-born population - Other Southern Africa (%)
Place of birth for the foreign-born population - Cabo Verde (%)
Place of birth for the foreign-born population - Ghana (%)
Place of birth for the foreign-born population - Liberia (%)
Place of birth for the foreign-born population - Nigeria (%)
Place of birth for the foreign-born population - Senegal (%)
Place of birth for the foreign-born population - Sierra Leone (%)
Place of birth for the foreign-born population - Other Western Africa (%)
Place of birth for the foreign-born population - Australia (%)
Place of birth for the foreign-born population - New Zealand (%)
Place of birth for the foreign-born population - Fiji (%)
Place of birth for the foreign-born population - Micronesia (%)
Place of birth for the foreign-born population - Bahamas (%)
Place of birth for the foreign-born population - Barbados (%)
Place of birth for the foreign-born population - Cuba (%)
Place of birth for the foreign-born population - Dominica (%)
Place of birth for the foreign-born population - Dominican Republic (%)
Place of birth for the foreign-born population - Grenada (%)
Place of birth for the foreign-born population - Haiti (%)
Place of birth for the foreign-born population - Jamaica (%)
Place of birth for the foreign-born population - St. Vincent and the Grenadines (%)
Place of birth for the foreign-born population - Trinidad and Tobago (%)
Place of birth for the foreign-born population - West Indies (%)
Place of birth for the foreign-born population - Other Caribbean (%)
Place of birth for the foreign-born population - Belize (%)
Place of birth for the foreign-born population - Costa Rica (%)
Place of birth for the foreign-born population - El Salvador (%)
Place of birth for the foreign-born population - Guatemala (%)
Place of birth for the foreign-born population - Honduras (%)
Place of birth for the foreign-born population - Mexico (%)
Place of birth for the foreign-born population - Nicaragua (%)
Place of birth for the foreign-born population - Panama (%)
Place of birth for the foreign-born population - Other Central America (%)
Place of birth for the foreign-born population - Argentina (%)
Place of birth for the foreign-born population - Bolivia (%)
Place of birth for the foreign-born population - Brazil (%)
Place of birth for the foreign-born population - Chile (%)
Place of birth for the foreign-born population - Colombia (%)
Place of birth for the foreign-born population - Ecuador (%)
Place of birth for the foreign-born population - Guyana (%)
Place of birth for the foreign-born population - Peru (%)
Place of birth for the foreign-born population - Uruguay (%)
Place of birth for the foreign-born population - Venezuela (%)
Place of birth for the foreign-born population - Other South America (%)
Place of birth for the foreign-born population - Canada (%)
Place of birth for the foreign-born population - Other Northern America (%)
Place of birth for the foreign-born population - Other (%)
Latest news about races in Toledo, OH collected exclusively by city-data.com from local newspapers, TV, and radio stations
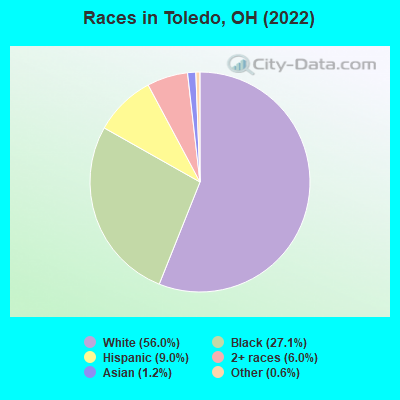
According to 2022 data, the most numerous races in Toledo, OH are White alone (149,195 residents), Black alone (72,202 residents), and Two or more races (15,970 residents). 93.7% of Toledo residents speak English at home. 3.4% of Toledo, OH residents are foreign-born (1.4% born in Asia, 0.9% born in Latin America, 0.5% born in Africa, 0.4% born in Europe), which is 18.4% less than the foreign-born rate of 4.0% across the entire state of Ohio.
Race distribution in Toledo
2000 2022
212,658 67.8% White alone 73,134 23.3% Black alone 17,141 5.5% Hispanic 6,113 1.9% Two or more races 3,197 1.0% Asian alone 554 0.2% Other race alone 761 0.2% American Indian alone 61 0.02% Native Hawaiian and Other
149,195 56.0% White alone 72,202 27.1% Black alone 23,973 9.0% Hispanic 15,970 6.0% Two or more races 3,137 1.2% Asian alone 1,673 0.6% Other race alone 103 0.04% American Indian alone 36 0.01% Native Hawaiian and Other
2000 2022
9,538,111 84.0% White alone 1,290,662 11.4% Black alone 217,123 1.9% Hispanic 137,770 1.2% Two or more races 131,670 1.2% Asian alone 21,985 0.2% American Indian alone 13,483 0.1% Other race alone 2,336 0.02% Native Hawaiian and Other
8,948,793 76.1% White alone 1,401,403 11.9% Black alone 529,291 4.5% Two or more races 517,232 4.4% Hispanic 293,387 2.5% Asian alone 52,805 0.4% Other race alone 9,785 0.08% American Indian alone 3,362 0.03% Native Hawaiian and Other
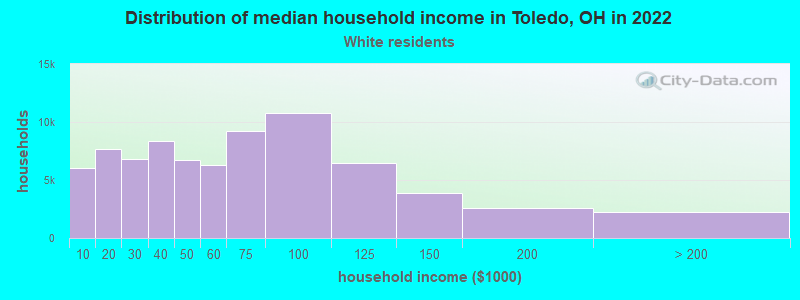
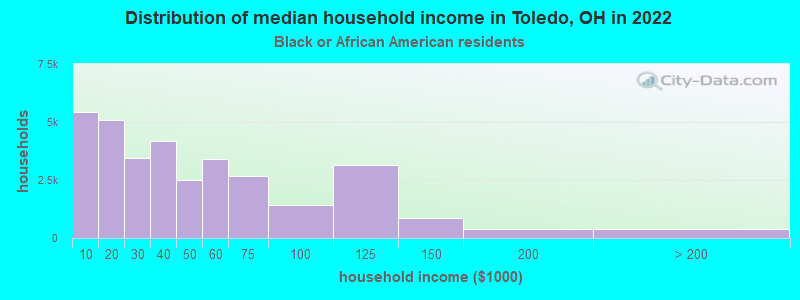
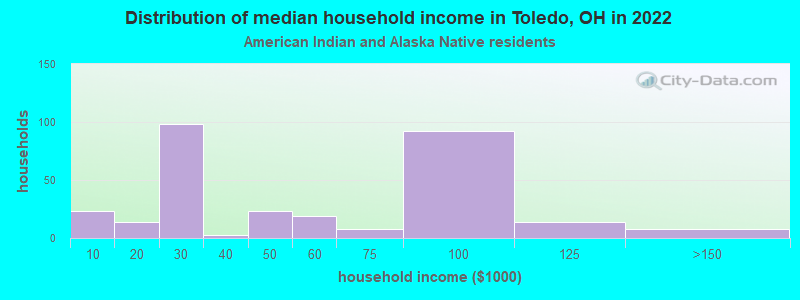
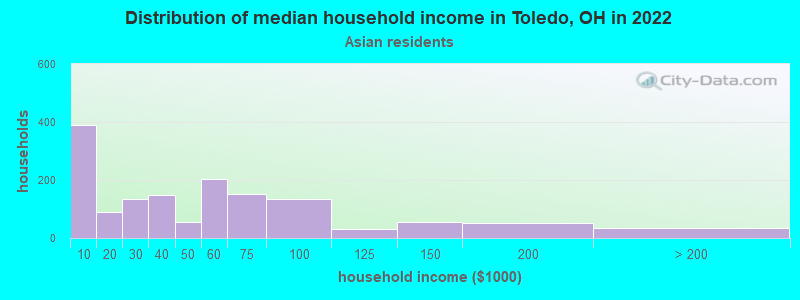
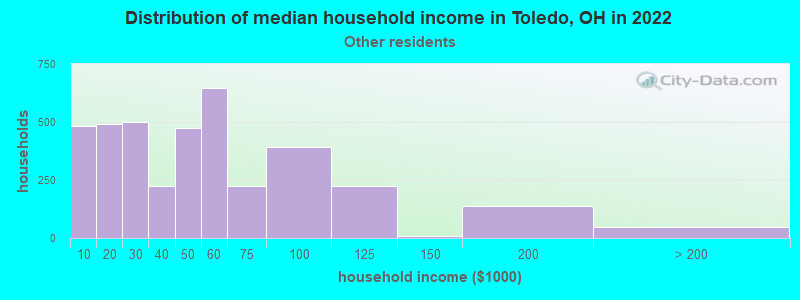
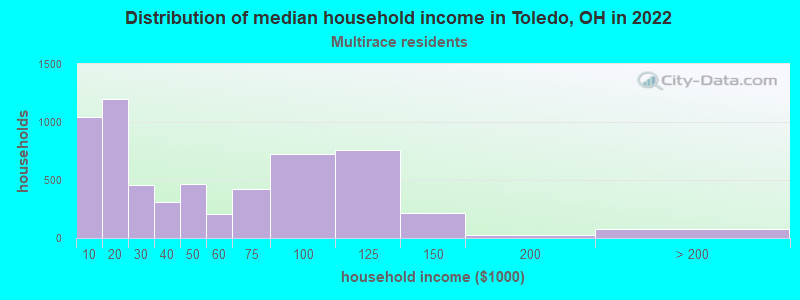
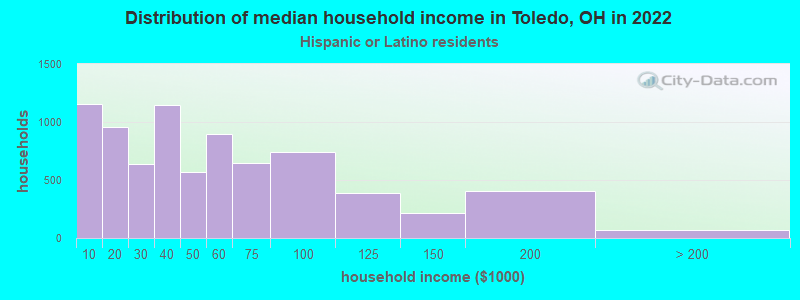
Income and house value in Toledo Median household income in 2022 $55,078 White non-Hispanic householders$37,146 Black householders$31,518 Asian householders$44,817 Some other race householders$38,272 Two or more races householders$40,237 Hispanic or Latino race householdersMedian 2022 house value $115,062 White Non-Hispanic householders$75,216 Black or African American householders$88,209 American Indian or Alaska Native householders $141,770 Asian householders$82,145 Some other race householders$92,251 Two or more races householders$79,402 Hispanic or Latino householders
Median age by race in Toledo
42.0 Median age for White residents40.4 43.8 32.3 Median age for Black or African American residents30.9 32.8 33.3 Median age for American Indian / Alaska Native residents33.9 -666,666,666.0 33.2 Median age for Asian residents29.5 34.7 -666,666,666.0 Median age for Native Hawaiian / Pacific Islander residents-666,666,666.0 -666,666,666.0 33.6 Median age for Other race residents34.7 30.5 18.3 Median age for Two or more races residents16.5 19.6 42.4 Median age for White alone residents40.5 44.3 28.1 Median age for Hispanic or Latino residents29.1 27.7
Owner/renter occupied households by race in Toledo
House owners and renters - White residents 49,315 63.9% Owner occupied27,846 36.1% Renter occupiedHouse owners and renters - Black or African American residents 13,103 39.8% Owner occupied19,816 60.2% Renter occupiedHouse owners and renters - American Indian / Alaska Native residents 55 13.5% Owner occupied354 86.5% Renter occupiedHouse owners and renters - Asian residents 386 26.6% Owner occupied1,066 73.4% Renter occupiedHouse owners and renters - Native Hawaiian / Pacific Islander residents 30 34.5% Owner occupied58 65.5% Renter occupiedHouse owners and renters - Other race residents 2,446 66.3% Owner occupied1,242 33.7% Renter occupiedHouse owners and renters - Two or more races residents 2,724 46.1% Owner occupied3,186 53.9% Renter occupiedHouse owners and renters - White alone residents 47,844 64.0% Owner occupied26,911 36.0% Renter occupiedHouse owners and renters - Hispanic or Latino residents 4,628 59.1% Owner occupied3,201 40.9% Renter occupied
Language usage in Toledo
English speakers - Total 93.7% of residents of Toledo speak English at home.
2.9% of residents speak Spanish at home 5,209 70.9% Speak English very well2,136 29.1% Speak English less than very well3.4% of residents speak other language at home 5,284 62.2% Speak English very well3,216 37.8% Speak English less than very well
English speakers - Born in the United States 95.4% of residents of Toledo speak English at home.
3.1% of residents speak Spanish at home 1,481 95.2% Speak English very well74 4.8% Speak English less than very well1.5% of residents speak other language at home 494 66.5% Speak English very well249 33.5% Speak English less than very well
English speakers - Native, born elsewhere 77.6% of residents of Toledo speak English at home.
10.7% of residents speak Spanish at home 126 75.9% Speak English very well40 24.1% Speak English less than very well11.8% of residents speak other language at home 183 100.0% Speak English very well
English speakers - Foreign-born 24.5% of residents of Toledo speak English at home.
18.2% of residents speak Spanish at home 510 29.5% Speak English very well1,216 70.5% Speak English less than very well57.3% of residents speak other language at home 2,841 52.5% Speak English very well2,575 47.5% Speak English less than very well
White (Caucasian) - Speak only English Native:
97.1% (140,393)Foreign-born:
23.8% (779)
White (Caucasian) - Speak another language Native:
2.9% (4,249)Foreign-born:
76.2% (2,488)
Black or African American - Speak only English Native:
98.8% (65,328)Foreign-born:
40.9% (782)
Black or African American - Speak another language Native:
1.2% (815)Foreign-born:
59.1% (1,131)
American Indian / Alaska Native - Speak only English Native:
69.9% (519)Foreign-born:
5.6% (2)
American Indian / Alaska Native - Speak another language Native:
30.1% (223)Foreign-born:
92.0% (28)
Asian - Speak only English Native:
55.6% (577)Foreign-born:
17.4% (361)
Asian - Speak another language Native:
44.4% (461)Foreign-born:
82.6% (1,711)
Native Hawaiian / Pacific Islander - Speak only English Native:
96.2% (159)Foreign-born:
96.3% (12)
Other race - Speak only English Native:
81.0% (6,765)Foreign-born:
18.8% (293)
Other race - Speak another language Native:
19.0% (1,588)Foreign-born:
81.2% (1,266)
Two or more races - Speak only English Native:
92.6% (18,656)Foreign-born:
15.9% (103)
Two or more races - Speak another language Native:
7.4% (1,481)Foreign-born:
84.1% (546)
White alone - Speak only English Native:
97.7% (136,727)Foreign-born:
25.0% (745)
White alone - Speak another language Native:
2.3% (3,226)Foreign-born:
75.0% (2,232)
Hispanic or Latino - Speak only English Native:
80.6% (15,954)Foreign-born:
15.9% (327)
Hispanic or Latino - Speak another language Native:
19.4% (3,846)Foreign-born:
84.1% (1,726)
Foreign-born residents in Toledo 9,050 residents are foreign born (1.4% Asia , 0.9% Latin America , 0.5% Africa , 0.4% Europe ).
Marital status for residents in Toledo Marital status - White (Caucasian) population 15 years and over
Males 40.1% Never married43.1% Now married1.9% Separated3.4% Widowed11.5% DivorcedFemales 31.0% Never married39.9% Now married1.2% Separated9.4% Widowed18.5% DivorcedWomen who gave birth in the past 12 months Now married:
71.0% (955)Unmarried:
29.0% (391)
Women who did not give birth in the past 12 months Now married:
37.5% (12,943)Unmarried:
62.5% (21,554)
Marital status - Black or African American population 15 years and over
Males 56.4% Never married28.4% Now married4.1% Separated1.6% Widowed9.5% DivorcedFemales 55.2% Never married19.0% Now married2.8% Separated8.6% Widowed14.4% DivorcedWomen who gave birth in the past 12 months Now married:
31.4% (567)Unmarried:
68.6% (1,236)
Women who did not give birth in the past 12 months Now married:
14.4% (2,468)Unmarried:
85.6% (14,633)
Marital status - American Indian / Alaska Native population 15 years and over
Males 60.9% Never married27.2% Now married1.7% Separated0.0% Widowed10.3% DivorcedFemales 42.0% Never married39.9% Now married2.7% Separated3.7% Widowed11.7% DivorcedWomen who did not give birth in the past 12 months Now married:
35.2% (61)Unmarried:
64.8% (112)
Marital status - Asian population 15 years and over
Males 54.4% Never married44.2% Now married0.0% Separated0.0% Widowed1.4% DivorcedFemales 31.1% Never married55.6% Now married0.9% Separated8.2% Widowed4.3% DivorcedWomen who gave birth in the past 12 months Now married:
100.0% (9)Unmarried:
0.0% (0)
Women who did not give birth in the past 12 months Now married:
50.9% (440)Unmarried:
49.1% (426)
Marital status - Native Hawaiian / Pacific Islander population 15 years and over
Males 83.7% Never married6.1% Now married0.0% Separated0.0% Widowed10.2% DivorcedFemales 91.3% Never married8.7% Now married0.0% Separated0.0% Widowed0.0% DivorcedWomen who did not give birth in the past 12 months Now married:
0.0% (0)Unmarried:
100.0% (66)
Marital status - Other race population 15 years and over
Males 51.7% Never married32.0% Now married1.4% Separated0.0% Widowed14.8% DivorcedFemales 42.2% Never married45.8% Now married0.0% Separated0.0% Widowed12.0% DivorcedWomen who gave birth in the past 12 months Now married:
45.3% (53)Unmarried:
54.7% (63)
Women who did not give birth in the past 12 months Now married:
26.6% (813)Unmarried:
73.4% (2,237)
Marital status - Two or more races population 15 years and over
Males 63.2% Never married27.1% Now married0.2% Separated1.8% Widowed7.6% DivorcedFemales 61.4% Never married18.8% Now married1.2% Separated2.7% Widowed15.9% DivorcedWomen who gave birth in the past 12 months Now married:
5.7% (16)Unmarried:
94.3% (270)
Women who did not give birth in the past 12 months Now married:
27.0% (1,382)Unmarried:
73.0% (3,732)
Marital status - White alone, not Hispanic / Latino population 15 years and over
Males 40.2% Never married43.6% Now married1.9% Separated2.9% Widowed11.4% DivorcedFemales 30.8% Never married39.8% Now married1.3% Separated9.0% Widowed19.1% DivorcedWomen who gave birth in the past 12 months Now married:
71.0% (955)Unmarried:
29.0% (391)
Women who did not give birth in the past 12 months Now married:
37.0% (12,098)Unmarried:
63.0% (20,626)
Marital status - Hispanic or Latino population 15 years and over
Males 55.3% Never married27.1% Now married0.7% Separated4.3% Widowed12.6% DivorcedFemales 47.0% Never married36.3% Now married0.0% Separated6.2% Widowed10.5% DivorcedWomen who gave birth in the past 12 months Now married:
16.2% (94)Unmarried:
83.8% (488)
Women who did not give birth in the past 12 months Now married:
35.6% (2,035)Unmarried:
64.4% (3,686)
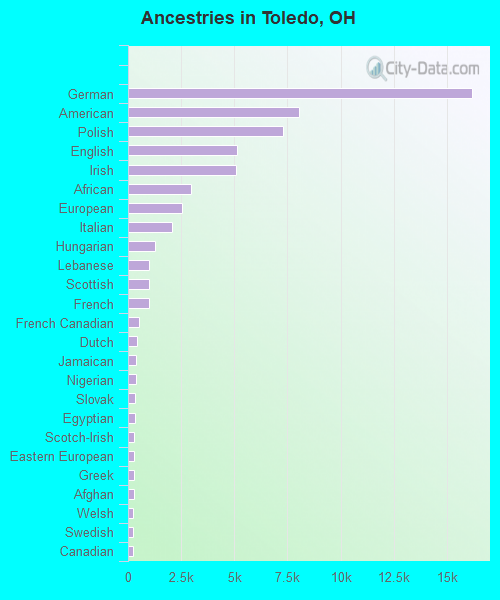
Ancestries in Toledo
16,173 12.3% German8,031 6.1% American7,276 5.6% Polish5,117 3.9% English5,079 3.9% Irish2,983 2.3% African2,537 1.9% European2,087 1.6% Italian1,250 1.0% Hungarian1,011 0.8% Lebanese996 0.8% Scottish980 0.7% French500 0.4% French Canadian413 0.3% Dutch389 0.3% Jamaican368 0.3% Nigerian329 0.3% Slovak320 0.2% Egyptian300 0.2% Scotch-Irish287 0.2% Eastern European282 0.2% Greek262 0.2% Afghan247 0.2% Welsh236 0.2% Swedish223 0.2% Canadian194 0.1% Haitian193 0.1% Norwegian183 0.1% Czech171 0.1% Arab162 0.1% Liberian148 0.1% Ghanaian144 0.1% Guyanese141 0.1% Jordanian128 0.10% Ukrainian122 0.09% British114 0.09% West Indian112 0.09% Finnish109 0.08% Romanian106 0.08% Zimbabwean96 0.07% Russian89 0.07% Belgian75 0.06% Palestinian69 0.05% Brazilian65 0.05% Iranian62 0.05% Northern European61 0.05% Sierra Leonean55 0.04% Swiss51 0.04% Syrian49 0.04% Scandinavian44 0.03% Iraqi43 0.03% Czechoslovakian42 0.03% Soviet Union36 0.03% Somali35 0.03% Slovene34 0.03% Turkish33 0.03% Pennsylvania German30 0.02% Sudanese26 0.02% Austrian23 0.02% Yugoslavian22 0.02% Albanian21 0.02% Portuguese21 0.02% Bulgarian20 0.02% Croatian17 0.01% Bahamian15 0.01% British West Indian14 0.01% Danish14 0.01% German Russian11 0.01% Lithuanian10 0.01% Trinidadian and Tobagonian10 0.01% Ethiopian8 0.01% Cypriot8 0.01% Australian8 0.01% Armenian
Geographical mobility in Toledo Same house 1 year ago 136,258 88.8% White (Caucasian)62,195 86.8% Black or African American456 56.9% American Indian / Alaska Native2,986 84.9% Asian157 90.0% Native Hawaiian / Pacific Islander8,248 81.3% Other race20,953 88.0% Two or more races131,258 88.5% White alone, not Hispanic / Latino20,645 87.7% Hispanic or LatinoMoved within same county 8,353 5.4% White / Caucasian7,709 10.8% Black or African American171 21.4% American Indian / Alaska Native219 6.2% Asian6 3.5% Native Hawaiian / Pacific Islander1,164 11.5% Other race2,157 9.1% Two or more races8,171 5.5% White alone, not Hispanic / Latino2,028 8.6% Hispanic or LatinoMoved within same state 5,141 3.3% White / Caucasian1,481 2.1% Black or African American16 2.0% American Indian / Alaska Native149 4.2% Asian13 7.7% Native Hawaiian / Pacific Islander149 1.5% Other race160 0.7% Two or more races5,141 3.5% White alone, not Hispanic / Latino509 2.2% Hispanic or LatinoMoved from different state 3,394 2.2% White / Caucasian166 0.2% Black or African American63 7.9% American Indian / Alaska Native86 2.5% Asian241 2.4% Other race390 1.6% Two or more races3,394 2.3% White alone, not Hispanic / Latino350 1.5% Hispanic or LatinoMoved from abroad 350 0.2% White137 0.2% Black or African American81 2.3% Asian205 2.0% Other race141 0.6% Two or more races350 0.2% White alone, not Hispanic / Latino
Children Nativity (place of birth) in Toledo
Children under 6 years - Living with two parents Both parents native 5,969 100.0% NativeBoth parents foreign-born 164 72.0% Native64 28.0% Foreign-bornOne native, one foreign-born parent 289 100.0% NativeChildren under 6 years - Living with one parent Native parent 12,547 100.0% NativeForeign-born parent 39 100.0% NativeChildren 6 to 17 years - Living with two parents Both parents native 13,550 99.7% Native44 0.3% Foreign-bornBoth parents foreign-born 700 80.1% Native174 19.9% Foreign-bornOne native, one foreign-born parent 611 92.0% Native53 8.0% Foreign-bornChildren 6 to 17 years - Living with one parent Native parent 21,388 100.0% NativeForeign-born parent 679 54.6% Native564 45.4% Foreign-born
Place of birth for residents in Toledo
Grandparents responsible for own grandchildren in Toledo
Grandparents (30 to 59 years) White / Caucasian 329 24.4% Responsible for grandchildren1,021 75.6% Not responsible for grandchildrenBlack or African American 343 43.4% Responsible for grandchildren447 56.6% Not responsible for grandchildrenOther race 113 64.7% Responsible for grandchildren61 35.3% Not responsible for grandchildrenTwo or more races 91 74.9% Responsible for grandchildren31 25.1% Not responsible for grandchildrenWhite alone, not Hispanic / Latino 329 24.4% Responsible for grandchildren1,021 75.6% Not responsible for grandchildrenHispanic or Latino 242 75.3% Responsible for grandchildren79 24.7% Not responsible for grandchildrenGrandparents (60 years and over) White / Caucasian 548 59.9% Responsible for grandchildren367 40.1% Not responsible for grandchildrenBlack or African American 296 36.6% Responsible for grandchildren514 63.4% Not responsible for grandchildrenOther race 30 50.4% Responsible for grandchildren30 49.6% Not responsible for grandchildrenTwo or more races 30 28.0% Responsible for grandchildren78 72.0% Not responsible for grandchildrenWhite alone, not Hispanic / Latino 548 59.9% Responsible for grandchildren367 40.1% Not responsible for grandchildrenHispanic or Latino 19 32.7% Responsible for grandchildren40 67.3% Not responsible for grandchildren