Work and Jobs in Arlington, Kansas (KS) Detailed Stats
Occupations, Industries, Unemployment, Workers, Commute
Settings
X


Discuss Arlington, Kansas work on our local forum with over 2,400,000 registered users
Latest news about work in Arlington, KS collected exclusively by city-data.com from local newspapers, TV, and radio stations
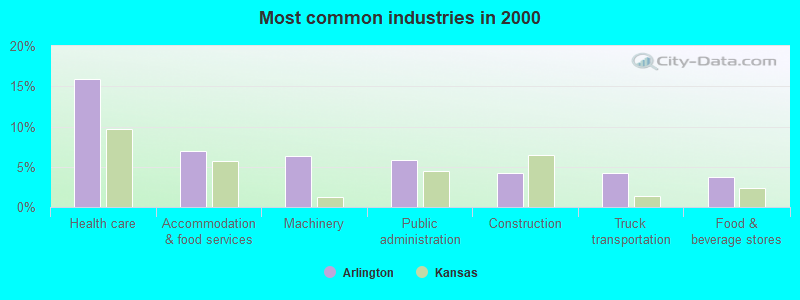
The most common industries in Arlington are: Health care (16.0% of civilian employees), Accommodation & food services (6.9% of civilian employees), Machinery (6.4% of civilian employees). 90.5% of workers work in Reno County and 9.0% of all workers work at home. 73.3% of workers are employees of private companies, which is 10.6% greater than the rate of 65.5% across the entire state of Kansas.
Whole page based on the data from 2000 / 2022 when the population of Arlington, Kansas was 459 / 475
Whole page based on the data from 2000 / 2022 when the population of Arlington, Kansas was 459 / 475
Most common industries
Most common industries | |||
|---|---|---|---|
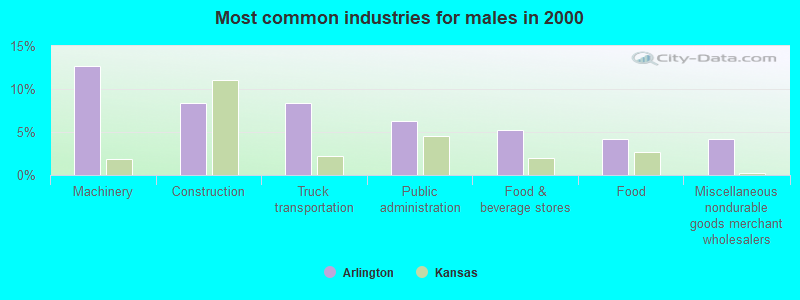
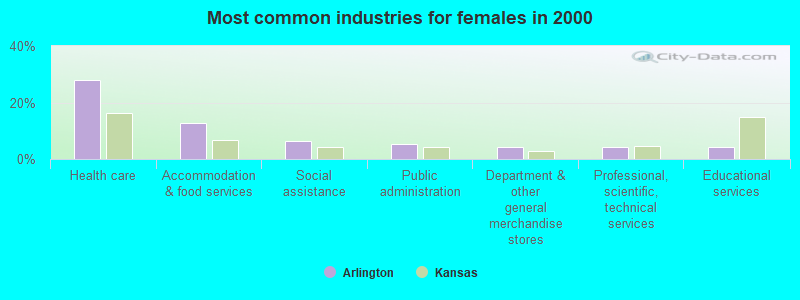
Industry | All | Males | Females |
| Health care | 16.0% (30) | 4.2% (4) | 28.0% (26) |
| Accommodation and food services | 6.9% (13) | 1.1% (1) | 12.9% (12) |
| Machinery | 6.4% (12) | 12.6% (12) | 0.0% (0) |
| Public administration | 5.9% (11) | 6.3% (6) | 5.4% (5) |
| Construction | 4.3% (8) | 8.4% (8) | 0.0% (0) |
| Truck transportation | 4.3% (8) | 8.4% (8) | 0.0% (0) |
| Food and beverage stores | 3.7% (7) | 5.3% (5) | 2.2% (2) |
| Professional, scientific, and technical services | 3.2% (6) | 2.1% (2) | 4.3% (4) |
| Textile mills and textile products | 3.2% (6) | 3.2% (3) | 3.2% (3) |
| Social assistance | 3.2% (6) | 0.0% (0) | 6.5% (6) |
| Educational services | 3.2% (6) | 2.1% (2) | 4.3% (4) |
| Publishing, and motion picture and sound recording industries | 2.7% (5) | 3.2% (3) | 2.2% (2) |
| Wood products | 2.7% (5) | 2.1% (2) | 3.2% (3) |
| Agriculture, forestry, fishing and hunting | 2.1% (4) | 2.1% (2) | 2.2% (2) |
| Food | 2.1% (4) | 4.2% (4) | 0.0% (0) |
| Miscellaneous nondurable goods merchant wholesalers | 2.1% (4) | 4.2% (4) | 0.0% (0) |
| Repair and maintenance | 2.1% (4) | 2.1% (2) | 2.2% (2) |
| Department and other general merchandise stores | 2.1% (4) | 0.0% (0) | 4.3% (4) |
| Other transportation, and support activities, and couriers | 1.6% (3) | 3.2% (3) | 0.0% (0) |
| U. S. Postal service | 1.6% (3) | 0.0% (0) | 3.2% (3) |
| Printing and related support activities | 1.6% (3) | 1.1% (1) | 2.2% (2) |
| Transportation equipment | 1.6% (3) | 2.1% (2) | 1.1% (1) |
| Utilities | 1.1% (2) | 2.1% (2) | 0.0% (0) |
| Finance and insurance | 1.1% (2) | 0.0% (0) | 2.2% (2) |
| Real estate and rental and leasing | 1.1% (2) | 2.1% (2) | 0.0% (0) |
| Administrative and support and waste management services | 1.1% (2) | 2.1% (2) | 0.0% (0) |
| Personal and laundry services | 1.1% (2) | 0.0% (0) | 2.2% (2) |
| Private households | 1.1% (2) | 0.0% (0) | 2.2% (2) |
| Plastics and rubber products | 1.1% (2) | 2.1% (2) | 0.0% (0) |
| Groceries and related products merchant wholesalers | 1.1% (2) | 2.1% (2) | 0.0% (0) |
| Furniture and home furnishings, and household appliance stores | 1.1% (2) | 0.0% (0) | 2.2% (2) |
| Building material and garden equipment and supplies dealers | 1.1% (2) | 2.1% (2) | 0.0% (0) |
| Health and personal care, except drug, stores | 1.1% (2) | 2.1% (2) | 0.0% (0) |
| Furniture and related product manufacturing | 1.1% (2) | 2.1% (2) | 0.0% (0) |
| Gasoline stations | 1.1% (2) | 0.0% (0) | 2.2% (2) |
| Other direct selling establishments | 1.1% (2) | 2.1% (2) | 0.0% (0) |
| Paper | 0.5% (1) | 1.1% (1) | 0.0% (0) |
| Radio, TV, and computer stores | 0.5% (1) | 0.0% (0) | 1.1% (1) |
| Motor vehicle and parts dealers | 0.5% (1) | 1.1% (1) | 0.0% (0) |
| Sewing, needlework, and piece goods stores | 0.5% (1) | 1.1% (1) | 0.0% (0) |
| Religious, grantmaking, civic, professional, and similar organizations | 0.5% (1) | 0.0% (0) | 1.1% (1) |
Unemployment in Arlington
- Unemployment by race in 2022
- Unemployment rate for White non-Hispanic residents
- 7.8%Females
- Unemployment by race in 2000
- Unemployment rate for White non-Hispanic residents
- 2.1%Males
Time leaving home to go to work

12:00 a.m. to 4:59 a.m.:
| Arlington: | 2.1% (4) |
| Kansas: | 5.0% (63,464) |
5:00 a.m. to 5:29 a.m.:
| Arlington: | 10.5% (21) |
| Kansas: | 3.4% (43,978) |
5:30 a.m. to 5:59 a.m.:
| Arlington: | 0.5% (1) |
| Kansas: | 5.1% (65,540) |
6:00 a.m. to 6:29 a.m.:
| Arlington: | 21.9% (43) |
| Kansas: | 7.3% (93,495) |
6:30 a.m. to 6:59 a.m.:
| Arlington: | 2.0% (4) |
| Kansas: | 10.2% (129,994) |
7:00 a.m. to 7:29 a.m.:
| Arlington: | 24.5% (48) |
| Kansas: | 14.8% (188,435) |
7:30 a.m. to 7:59 a.m.:
| Arlington: | 15.5% (31) |
| Kansas: | 17.4% (221,699) |
8:00 a.m. to 8:29 a.m.:
| Arlington: | 10.7% (21) |
| Kansas: | 10.0% (127,374) |
10:00 a.m. to 10:59 a.m.:
| Arlington: | 3.5% (7) |
| Kansas: | 2.5% (31,968) |
11:00 a.m. to 11:59 a.m.:
| Arlington: | 1.1% (2) |
| Kansas: | 1.4% (17,384) |
12:00 p.m. to 3:59 p.m.:
| Arlington: | 5.5% (11) |
| Kansas: | 7.1% (90,847) |
4:00 p.m. to 11:59 p.m.:
| Arlington: | 1.4% (3) |
| Kansas: | 6.6% (83,997) |

<5am:
| Arlington: | 6.4% (12) |
| Kansas: | 2.8% (37,001) |
5:30am:
| Arlington: | 1.1% (2) |
| Kansas: | 2.2% (29,449) |
6am:
| Arlington: | 5.3% (10) |
| Kansas: | 4.0% (52,725) |
6:30am:
| Arlington: | 11.2% (21) |
| Kansas: | 7.1% (93,264) |
7am:
| Arlington: | 4.3% (8) |
| Kansas: | 10.3% (135,647) |
7:30am:
| Arlington: | 20.7% (39) |
| Kansas: | 15.1% (198,358) |
8am:
| Arlington: | 19.1% (36) |
| Kansas: | 19.7% (258,625) |
8:30am:
| Arlington: | 4.8% (9) |
| Kansas: | 9.8% (127,994) |
9am:
| Arlington: | 4.3% (8) |
| Kansas: | 4.2% (54,906) |
10am:
| Arlington: | 1.6% (3) |
| Kansas: | 4.3% (56,570) |
11am:
| Arlington: | 1.1% (2) |
| Kansas: | 1.9% (24,928) |
12pm:
| Arlington: | 1.6% (3) |
| Kansas: | 0.9% (12,131) |
4pm:
| Arlington: | 9.0% (17) |
| Kansas: | 6.7% (88,226) |
>4pm:
| Arlington: | 8.5% (16) |
| Kansas: | 6.8% (89,657) |

12:00 a.m. to 4:59 a.m. - Males:
| Arlington: | 2.2% (2) |
| Kansas: | 6.4% (44,516) |
5:00 a.m. to 5:29 a.m. - Males:
| Arlington: | 12.6% (13) |
| Kansas: | 4.2% (28,841) |
5:30 a.m. to 5:59 a.m. - Males:
| Arlington: | 1.0% (1) |
| Kansas: | 6.5% (45,470) |
6:00 a.m. to 6:29 a.m. - Males:
| Arlington: | 40.8% (41) |
| Kansas: | 8.8% (61,038) |
6:30 a.m. to 6:59 a.m. - Males:
| Arlington: | 3.9% (4) |
| Kansas: | 11.2% (77,567) |
7:00 a.m. to 7:29 a.m. - Males:
| Arlington: | 10.6% (11) |
| Kansas: | 14.2% (98,880) |
8:00 a.m. to 8:29 a.m. - Males:
| Arlington: | 19.7% (20) |
| Kansas: | 9.4% (65,252) |
10:00 a.m. to 10:59 a.m. - Males:
| Arlington: | 3.0% (3) |
| Kansas: | 2.0% (14,209) |
12:00 p.m. to 3:59 p.m. - Males:
| Arlington: | 4.0% (4) |
| Kansas: | 7.0% (48,896) |

12:00 a.m. to 4:59 a.m. - Females:
| Arlington: | 1.9% (2) |
| Kansas: | 3.3% (18,948) |
5:00 a.m. to 5:29 a.m. - Females:
| Arlington: | 8.6% (8) |
| Kansas: | 2.6% (15,137) |
6:00 a.m. to 6:29 a.m. - Females:
| Arlington: | 2.0% (2) |
| Kansas: | 5.6% (32,457) |
7:00 a.m. to 7:29 a.m. - Females:
| Arlington: | 38.8% (38) |
| Kansas: | 15.4% (89,555) |
7:30 a.m. to 7:59 a.m. - Females:
| Arlington: | 31.7% (31) |
| Kansas: | 20.2% (117,744) |
8:00 a.m. to 8:29 a.m. - Females:
| Arlington: | 2.0% (2) |
| Kansas: | 10.7% (62,122) |
10:00 a.m. to 10:59 a.m. - Females:
| Arlington: | 4.1% (4) |
| Kansas: | 3.1% (17,759) |
11:00 a.m. to 11:59 a.m. - Females:
| Arlington: | 2.4% (2) |
| Kansas: | 1.6% (9,296) |
12:00 p.m. to 3:59 p.m. - Females:
| Arlington: | 7.1% (7) |
| Kansas: | 7.2% (41,951) |
4:00 p.m. to 11:59 p.m. - Females:
| Arlington: | 3.0% (3) |
| Kansas: | 6.9% (40,196) |
Travel time to work
Percentage of workers working in this county: 90.5%
Number of people working at home: 20 (9.0% of all workers)
Number of people working at home: 20 (9.0% of all workers)


Less than 5 minutes:
| Arlington: | 8.0% (15) |
| Kansas: | 6.1% (79,963) |
5 to 9 minutes:
| Arlington: | 12.8% (24) |
| Kansas: | 16.8% (220,956) |
10 to 14 minutes:
| Arlington: | 5.9% (11) |
| Kansas: | 18.6% (244,433) |
15 to 19 minutes:
| Arlington: | 4.8% (9) |
| Kansas: | 16.9% (221,991) |
20 to 24 minutes:
| Arlington: | 12.8% (24) |
| Kansas: | 13.5% (177,293) |
25 to 29 minutes:
| Arlington: | 11.2% (21) |
| Kansas: | 4.9% (64,184) |
30 to 34 minutes:
| Arlington: | 28.2% (53) |
| Kansas: | 9.0% (118,138) |
35 to 39 minutes:
| Arlington: | 4.3% (8) |
| Kansas: | 1.6% (21,204) |
40 to 44 minutes:
| Arlington: | 0.5% (1) |
| Kansas: | 1.7% (22,394) |
45 to 59 minutes:
| Arlington: | 2.1% (4) |
| Kansas: | 3.4% (44,713) |
60 to 89 minutes:
| Arlington: | 6.9% (13) |
| Kansas: | 2.0% (26,173) |
90 or more minutes:
| Arlington: | 1.6% (3) |
| Kansas: | 1.4% (18,039) |
Means of transportation to work

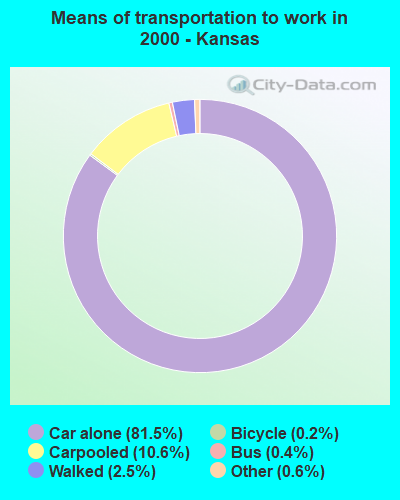
Drove car alone:
| Arlington: | 80.9% (152) |
| Kansas: | 81.5% (1,068,501) |
Carpooled:
| Arlington: | 14.9% (28) |
| Kansas: | 10.6% (139,348) |
Walked:
| Arlington: | 2.1% (4) |
| Kansas: | 2.5% (33,271) |
Other means:
| Arlington: | 1.1% (2) |
| Kansas: | 0.6% (7,927) |
Private vehicle occupancy

Drove alone:
| Arlington: | 92.6% (171) |
| Kansas: | 90.1% (1,093,613) |
In 2 person carpool:
| Arlington: | 2.6% (5) |
| Kansas: | 7.2% (86,855) |
In 3 person carpool:
| Arlington: | 4.9% (9) |
| Kansas: | 1.7% (20,774) |

Drove alone:
| Arlington: | 84.4% (152) |
| Kansas: | 88.5% (1,068,501) |
In 2 person carpool:
| Arlington: | 14.4% (26) |
| Kansas: | 9.0% (109,278) |
In 3 person carpool:
| Arlington: | 1.1% (2) |
| Kansas: | 1.6% (19,470) |
Class of workers

Employee of private company:
| Arlington: | 73.3% (165) |
| Kansas: | 65.5% (954,573) |
Self-employed in own incorporated business:
| Arlington: | 0.4% (1) |
| Kansas: | 3.7% (53,764) |
Private not-for-profit wage and salary workers:
| Arlington: | 0.9% (2) |
| Kansas: | 8.6% (124,918) |
Local government workers:
| Arlington: | 9.8% (22) |
| Kansas: | 8.9% (130,140) |
State government workers:
| Arlington: | 5.3% (12) |
| Kansas: | 4.7% (68,405) |
Self-employed workers in own not incorporated business:
| Arlington: | 10.2% (23) |
| Kansas: | 5.7% (83,239) |

Employee of private company:
| Arlington: | 68.1% (128) |
| Kansas: | 65.6% (863,522) |
Private not-for-profit wage and salary workers:
| Arlington: | 9.0% (17) |
| Kansas: | 7.7% (101,602) |
Local government workers:
| Arlington: | 5.9% (11) |
| Kansas: | 7.1% (93,985) |
State government workers:
| Arlington: | 4.3% (8) |
| Kansas: | 5.7% (75,164) |
Federal government workers:
| Arlington: | 1.6% (3) |
| Kansas: | 2.6% (34,749) |
Self-employed workers in own not incorporated business:
| Arlington: | 11.2% (21) |
| Kansas: | 7.8% (102,378) |

Employee of private company - Males:
| Arlington: | 80.9% (93) |
| Kansas: | 70.4% (543,878) |
Self-employed in own incorporated business - Males:
| Arlington: | 0.9% (1) |
| Kansas: | 4.7% (36,544) |
Local government workers - Males:
| Arlington: | 1.7% (2) |
| Kansas: | 6.6% (51,074) |
State government workers - Males:
| Arlington: | 3.5% (4) |
| Kansas: | 3.8% (29,053) |
Self-employed workers in own not incorporated business - Males:
| Arlington: | 13.0% (15) |
| Kansas: | 6.8% (52,202) |

Employee of private company - Females:
| Arlington: | 65.5% (72) |
| Kansas: | 60.1% (410,695) |
Private not-for-profit wage and salary workers - Females:
| Arlington: | 1.8% (2) |
| Kansas: | 12.9% (87,981) |
Local government workers - Females:
| Arlington: | 18.2% (20) |
| Kansas: | 11.6% (79,066) |
State government workers - Females:
| Arlington: | 7.3% (8) |
| Kansas: | 5.8% (39,352) |
Self-employed workers in own not incorporated business - Females:
| Arlington: | 7.3% (8) |
| Kansas: | 4.5% (31,037) |