Work and Jobs in Barton, Maryland (MD) Detailed Stats
Occupations, Industries, Unemployment, Workers, Commute
Settings
X


Recent posts about work in Barton, Maryland on our local forum with over 2,400,000 registered users:
 | Baltimore City Elections 2020 (30 replies) |
| Potomac MD to Capitol Hill Commute Time (3 replies) |
| Cumberland area crime, local police (16 replies) |
| Commute from Rockville MD to Herndon VA during rush hours (5 replies) |
| What is MARYLAND known for? Characteristics of Marylanders? (279 replies) |
| Maryland vs Virginia (96 replies) |
Latest news about work in Barton, MD collected exclusively by city-data.com from local newspapers, TV, and radio stations
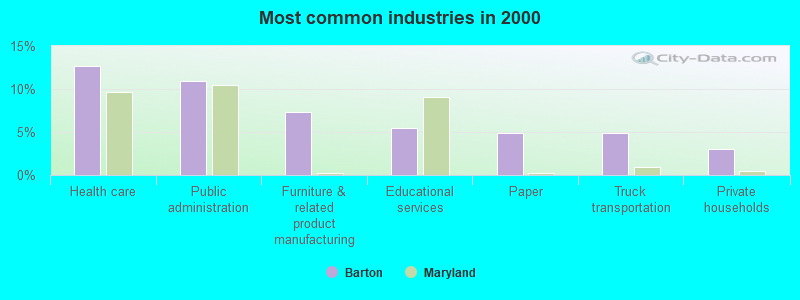
The most common industries in Barton are: Health care (12.7% of civilian employees), Public administration (10.9% of civilian employees), Furniture & related product manufacturing (7.3% of civilian employees). 75.7% of workers work in Allegany County and 8.8% of all workers work at home. 61.8% of workers are employees of private companies, which is 6.3% greater than the rate of 57.9% across the entire state of Maryland.
Whole page based on the data from 2000 / 2022 when the population of Barton, Maryland was 478 / 598
Whole page based on the data from 2000 / 2022 when the population of Barton, Maryland was 478 / 598
Most common industries
Most common industries | |||
|---|---|---|---|
Industry | All | Males | Females |
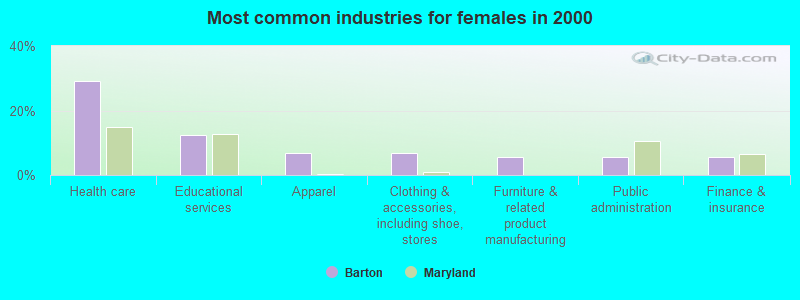
| Health care | 12.7% (21) | 0.0% (0) | 29.2% (21) |
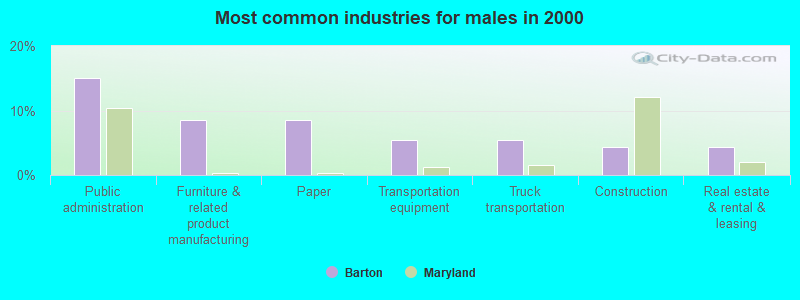
| Public administration | 10.9% (18) | 15.1% (14) | 5.6% (4) |
| Furniture and related product manufacturing | 7.3% (12) | 8.6% (8) | 5.6% (4) |
| Educational services | 5.5% (9) | 0.0% (0) | 12.5% (9) |
| Paper | 4.8% (8) | 8.6% (8) | 0.0% (0) |
| Truck transportation | 4.8% (8) | 5.4% (5) | 4.2% (3) |
| Private households | 3.0% (5) | 4.3% (4) | 1.4% (1) |
| Transportation equipment | 3.0% (5) | 5.4% (5) | 0.0% (0) |
| Apparel | 3.0% (5) | 0.0% (0) | 6.9% (5) |
| Clothing and accessories, including shoe, stores | 3.0% (5) | 0.0% (0) | 6.9% (5) |
| Accommodation and food services | 3.0% (5) | 2.2% (2) | 4.2% (3) |
| Construction | 2.4% (4) | 4.3% (4) | 0.0% (0) |
| Food and beverage stores | 2.4% (4) | 3.2% (3) | 1.4% (1) |
| Finance and insurance | 2.4% (4) | 0.0% (0) | 5.6% (4) |
| Real estate and rental and leasing | 2.4% (4) | 4.3% (4) | 0.0% (0) |
| Professional, scientific, and technical services | 2.4% (4) | 2.2% (2) | 2.8% (2) |
| Administrative and support and waste management services | 2.4% (4) | 4.3% (4) | 0.0% (0) |
| Mining, quarrying, and oil and gas extraction | 1.8% (3) | 3.2% (3) | 0.0% (0) |
| Motor vehicle and parts dealers | 1.8% (3) | 1.1% (1) | 2.8% (2) |
| Textile mills and textile products | 1.8% (3) | 3.2% (3) | 0.0% (0) |
| Plastics and rubber products | 1.8% (3) | 3.2% (3) | 0.0% (0) |
| Rail transportation | 1.8% (3) | 3.2% (3) | 0.0% (0) |
| Metals and minerals, except petroleum, merchant wholesalers | 1.2% (2) | 2.2% (2) | 0.0% (0) |
| Chemicals | 1.2% (2) | 2.2% (2) | 0.0% (0) |
| Groceries and related products merchant wholesalers | 1.2% (2) | 2.2% (2) | 0.0% (0) |
| Radio, TV, and computer stores | 1.2% (2) | 2.2% (2) | 0.0% (0) |
| Building material and garden equipment and supplies dealers | 1.2% (2) | 0.0% (0) | 2.8% (2) |
| Retail florists | 1.2% (2) | 0.0% (0) | 2.8% (2) |
| Office supplies and stationery stores | 1.2% (2) | 2.2% (2) | 0.0% (0) |
| Social assistance | 1.2% (2) | 0.0% (0) | 2.8% (2) |
| Arts, entertainment, and recreation | 1.2% (2) | 2.2% (2) | 0.0% (0) |
| Wood products | 1.2% (2) | 2.2% (2) | 0.0% (0) |
| Gasoline stations | 1.2% (2) | 2.2% (2) | 0.0% (0) |
| Repair and maintenance | 0.6% (1) | 1.1% (1) | 0.0% (0) |
| Religious, grantmaking, civic, professional, and similar organizations | 0.6% (1) | 0.0% (0) | 1.4% (1) |
| Nonmetallic mineral products | 0.6% (1) | 0.0% (0) | 1.4% (1) |
Unemployment in Barton
- Unemployment by race in 2022
- Unemployment rate for White non-Hispanic residents
- 32.7%Males
- 7.2%Females
- Unemployment by race in 2000
- Unemployment rate for White non-Hispanic residents
- 7.0%Males
- 5.3%Females
Time leaving home to go to work

12:00 a.m. to 4:59 a.m.:
| Barton: | 6.4% (10) |
| Maryland: | 5.4% (137,252) |
5:00 a.m. to 5:29 a.m.:
| Barton: | 7.2% (11) |
| Maryland: | 4.4% (112,169) |
5:30 a.m. to 5:59 a.m.:
| Barton: | 9.4% (15) |
| Maryland: | 4.8% (121,529) |
6:00 a.m. to 6:29 a.m.:
| Barton: | 8.7% (13) |
| Maryland: | 9.1% (231,673) |
6:30 a.m. to 6:59 a.m.:
| Barton: | 4.9% (8) |
| Maryland: | 8.3% (211,777) |
7:00 a.m. to 7:29 a.m.:
| Barton: | 13.0% (20) |
| Maryland: | 14.3% (362,787) |
7:30 a.m. to 7:59 a.m.:
| Barton: | 10.0% (15) |
| Maryland: | 10.9% (277,831) |
8:00 a.m. to 8:29 a.m.:
| Barton: | 9.3% (14) |
| Maryland: | 12.2% (310,633) |
8:30 a.m. to 8:59 a.m.:
| Barton: | 7.6% (12) |
| Maryland: | 6.2% (157,490) |
9:00 a.m. to 9:59 a.m.:
| Barton: | 10.6% (16) |
| Maryland: | 8.0% (204,415) |
10:00 a.m. to 10:59 a.m.:
| Barton: | 0.7% (1) |
| Maryland: | 3.0% (77,287) |
12:00 p.m. to 3:59 p.m.:
| Barton: | 11.8% (18) |
| Maryland: | 6.3% (159,318) |
4:00 p.m. to 11:59 p.m.:
| Barton: | 4.3% (7) |
| Maryland: | 5.3% (135,542) |

<5am:
| Barton: | 4.5% (7) |
| Maryland: | 3.0% (77,561) |
5:30am:
| Barton: | 5.7% (9) |
| Maryland: | 3.2% (81,972) |
6am:
| Barton: | 6.4% (10) |
| Maryland: | 4.7% (120,768) |
6:30am:
| Barton: | 10.8% (17) |
| Maryland: | 9.1% (235,203) |
7am:
| Barton: | 11.5% (18) |
| Maryland: | 10.3% (267,702) |
7:30am:
| Barton: | 11.5% (18) |
| Maryland: | 14.9% (386,941) |
8am:
| Barton: | 17.2% (27) |
| Maryland: | 14.3% (370,838) |
8:30am:
| Barton: | 8.3% (13) |
| Maryland: | 11.6% (300,061) |
9am:
| Barton: | 7.6% (12) |
| Maryland: | 6.0% (154,337) |
10am:
| Barton: | 0.6% (1) |
| Maryland: | 5.9% (151,747) |
11am:
| Barton: | 0.6% (1) |
| Maryland: | 2.2% (56,218) |
4pm:
| Barton: | 1.9% (3) |
| Maryland: | 5.3% (136,187) |
>4pm:
| Barton: | 12.1% (19) |
| Maryland: | 5.4% (139,172) |

12:00 a.m. to 4:59 a.m. - Males:
| Barton: | 9.9% (9) |
| Maryland: | 7.5% (99,701) |
5:00 a.m. to 5:29 a.m. - Males:
| Barton: | 12.1% (11) |
| Maryland: | 5.9% (79,059) |
5:30 a.m. to 5:59 a.m. - Males:
| Barton: | 8.5% (8) |
| Maryland: | 5.9% (79,436) |
6:00 a.m. to 6:29 a.m. - Males:
| Barton: | 11.8% (11) |
| Maryland: | 10.9% (145,135) |
6:30 a.m. to 6:59 a.m. - Males:
| Barton: | 3.7% (3) |
| Maryland: | 8.3% (110,674) |
7:00 a.m. to 7:29 a.m. - Males:
| Barton: | 13.7% (12) |
| Maryland: | 13.0% (173,935) |
7:30 a.m. to 7:59 a.m. - Males:
| Barton: | 2.5% (2) |
| Maryland: | 9.1% (121,963) |
8:30 a.m. to 8:59 a.m. - Males:
| Barton: | 4.8% (4) |
| Maryland: | 4.7% (62,260) |
9:00 a.m. to 9:59 a.m. - Males:
| Barton: | 16.7% (15) |
| Maryland: | 7.6% (101,199) |
12:00 p.m. to 3:59 p.m. - Males:
| Barton: | 21.8% (20) |
| Maryland: | 6.5% (86,966) |
4:00 p.m. to 11:59 p.m. - Males:
| Barton: | 2.1% (2) |
| Maryland: | 5.1% (68,188) |

12:00 a.m. to 4:59 a.m. - Females:
| Barton: | 1.5% (1) |
| Maryland: | 3.1% (37,551) |
5:30 a.m. to 5:59 a.m. - Females:
| Barton: | 5.5% (4) |
| Maryland: | 3.5% (42,093) |
6:00 a.m. to 6:29 a.m. - Females:
| Barton: | 4.7% (3) |
| Maryland: | 7.2% (86,538) |
6:30 a.m. to 6:59 a.m. - Females:
| Barton: | 6.6% (4) |
| Maryland: | 8.4% (101,103) |
7:00 a.m. to 7:29 a.m. - Females:
| Barton: | 10.4% (7) |
| Maryland: | 15.7% (188,852) |
7:30 a.m. to 7:59 a.m. - Females:
| Barton: | 24.3% (16) |
| Maryland: | 12.9% (155,868) |
8:00 a.m. to 8:29 a.m. - Females:
| Barton: | 22.0% (14) |
| Maryland: | 13.3% (159,924) |
8:30 a.m. to 8:59 a.m. - Females:
| Barton: | 11.5% (7) |
| Maryland: | 7.9% (95,230) |
9:00 a.m. to 9:59 a.m. - Females:
| Barton: | 3.7% (2) |
| Maryland: | 8.6% (103,216) |
10:00 a.m. to 10:59 a.m. - Females:
| Barton: | 1.5% (1) |
| Maryland: | 3.5% (41,705) |
4:00 p.m. to 11:59 p.m. - Females:
| Barton: | 5.5% (4) |
| Maryland: | 5.6% (67,354) |
Travel time to work
Percentage of workers working in this county: 75.7%
Number of people working at home: 16 (8.8% of all workers)
Number of people working at home: 16 (8.8% of all workers)


Less than 5 minutes:
| Barton: | 1.9% (3) |
| Maryland: | 1.8% (47,843) |
5 to 9 minutes:
| Barton: | 13.4% (21) |
| Maryland: | 6.6% (169,884) |
10 to 14 minutes:
| Barton: | 10.2% (16) |
| Maryland: | 10.5% (271,204) |
15 to 19 minutes:
| Barton: | 4.5% (7) |
| Maryland: | 12.4% (320,679) |
20 to 24 minutes:
| Barton: | 12.1% (19) |
| Maryland: | 13.0% (337,452) |
25 to 29 minutes:
| Barton: | 10.8% (17) |
| Maryland: | 6.1% (158,702) |
30 to 34 minutes:
| Barton: | 28.0% (44) |
| Maryland: | 14.5% (375,140) |
35 to 39 minutes:
| Barton: | 4.5% (7) |
| Maryland: | 3.5% (91,893) |
40 to 44 minutes:
| Barton: | 1.3% (2) |
| Maryland: | 4.8% (123,823) |
45 to 59 minutes:
| Barton: | 2.5% (4) |
| Maryland: | 11.3% (291,586) |
60 to 89 minutes:
| Barton: | 0.6% (1) |
| Maryland: | 8.6% (223,613) |
90 or more minutes:
| Barton: | 8.9% (14) |
| Maryland: | 3.6% (93,148) |
Means of transportation to work


Drove car alone:
| Barton: | 83.4% (131) |
| Maryland: | 73.7% (1,910,917) |
Carpooled:
| Barton: | 12.1% (19) |
| Maryland: | 12.4% (320,992) |
Bus or trolley bus:
| Barton: | 0.6% (1) |
| Maryland: | 3.6% (93,111) |
Walked:
| Barton: | 2.5% (4) |
| Maryland: | 2.5% (64,852) |
Private vehicle occupancy

Drove alone:
| Barton: | 89.8% (127) |
| Maryland: | 89.2% (2,046,832) |
In 2 person carpool:
| Barton: | 10.0% (14) |
| Maryland: | 8.2% (188,419) |

Drove alone:
| Barton: | 87.3% (131) |
| Maryland: | 85.6% (1,910,917) |
In 2 person carpool:
| Barton: | 11.3% (17) |
| Maryland: | 11.2% (249,591) |
In 4 person carpool:
| Barton: | 1.3% (2) |
| Maryland: | 0.7% (15,540) |
Class of workers

Employee of private company:
| Barton: | 61.8% (107) |
| Maryland: | 57.9% (1,834,766) |
Self-employed in own incorporated business:
| Barton: | 1.1% (2) |
| Maryland: | 3.6% (114,186) |
Private not-for-profit wage and salary workers:
| Barton: | 3.4% (6) |
| Maryland: | 10.1% (321,165) |
Local government workers:
| Barton: | 14.0% (24) |
| Maryland: | 7.7% (243,652) |
State government workers:
| Barton: | 10.1% (17) |
| Maryland: | 4.5% (142,830) |
Federal government workers:
| Barton: | 2.2% (4) |
| Maryland: | 10.5% (333,930) |
Self-employed workers in own not incorporated business:
| Barton: | 7.3% (13) |
| Maryland: | 5.4% (171,588) |

Employee of private company:
| Barton: | 78.8% (130) |
| Maryland: | 60.5% (1,579,238) |
Private not-for-profit wage and salary workers:
| Barton: | 0.6% (1) |
| Maryland: | 8.4% (219,162) |
Local government workers:
| Barton: | 9.1% (15) |
| Maryland: | 7.9% (204,895) |
State government workers:
| Barton: | 8.5% (14) |
| Maryland: | 4.4% (114,670) |
Federal government workers:
| Barton: | 1.2% (2) |
| Maryland: | 10.0% (262,046) |
Self-employed workers in own not incorporated business:
| Barton: | 1.8% (3) |
| Maryland: | 5.4% (140,769) |

Employee of private company - Males:
| Barton: | 64.6% (62) |
| Maryland: | 62.1% (1,004,780) |
Local government workers - Males:
| Barton: | 8.1% (8) |
| Maryland: | 5.3% (85,832) |
State government workers - Males:
| Barton: | 12.1% (12) |
| Maryland: | 3.8% (61,646) |
Federal government workers - Males:
| Barton: | 2.0% (2) |
| Maryland: | 10.8% (174,115) |
Self-employed workers in own not incorporated business - Males:
| Barton: | 13.1% (13) |
| Maryland: | 6.0% (97,677) |

Employee of private company - Females:
| Barton: | 58.2% (45) |
| Maryland: | 53.5% (829,986) |
Self-employed in own incorporated business - Females:
| Barton: | 2.5% (2) |
| Maryland: | 2.6% (40,406) |
Private not-for-profit wage and salary workers - Females:
| Barton: | 7.6% (6) |
| Maryland: | 13.2% (205,485) |
Local government workers - Females:
| Barton: | 21.5% (17) |
| Maryland: | 10.2% (157,820) |
State government workers - Females:
| Barton: | 7.6% (6) |
| Maryland: | 5.2% (81,184) |
Federal government workers - Females:
| Barton: | 2.5% (2) |
| Maryland: | 10.3% (159,815) |