Work and Jobs in Belmont, West Virginia (WV) Detailed Stats
Occupations, Industries, Unemployment, Workers, Commute
Settings
X


Recent posts about work in Belmont, West Virginia on our local forum with over 2,400,000 registered users:
 | Gas & Oil jobs near Wheeling... (5 replies) |
| Regional Wv Employment & Unemployment. (41 replies) |
| Where people go when they leave WV. (12 replies) |
| Mafia in West Virginia (174 replies) |
| interesting article about WV (13 replies) |
| Wheeling/Weirton/Northern Panhandle News & Information (309 replies) |
Latest news about work in Belmont, WV collected exclusively by city-data.com from local newspapers, TV, and radio stations
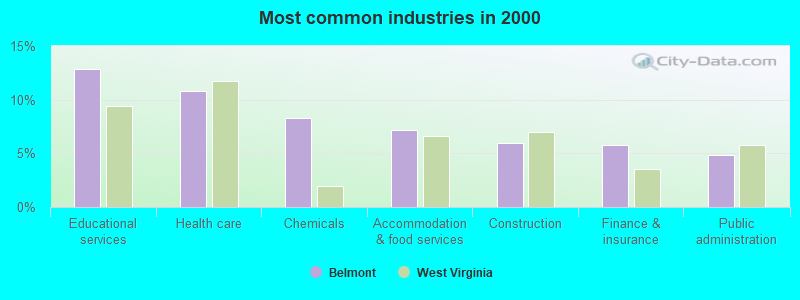
The most common industries in Belmont are: Educational services (12.9% of civilian employees), Health care (10.8% of civilian employees), Chemicals (8.3% of civilian employees). 46.2% of workers work in Pleasants County and 2.8% of all workers work at home. 66.2% of workers are employees of private companies, which is 2.5% greater than the rate of 64.5% across the entire state of West Virginia.
Whole page based on the data from 2000 / 2022 when the population of Belmont, West Virginia was 1,036 / 816
Whole page based on the data from 2000 / 2022 when the population of Belmont, West Virginia was 1,036 / 816
Most common industries
Most common industries | |||
|---|---|---|---|
Industry | All | Males | Females |
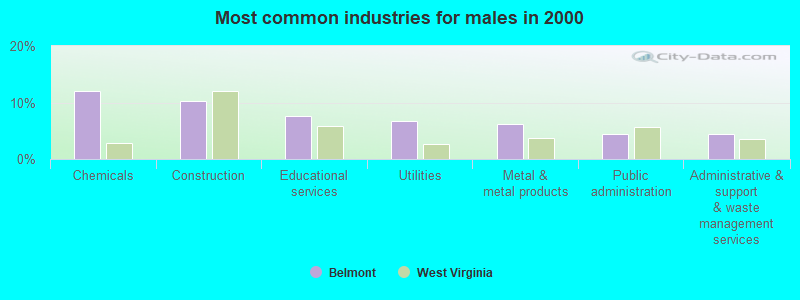
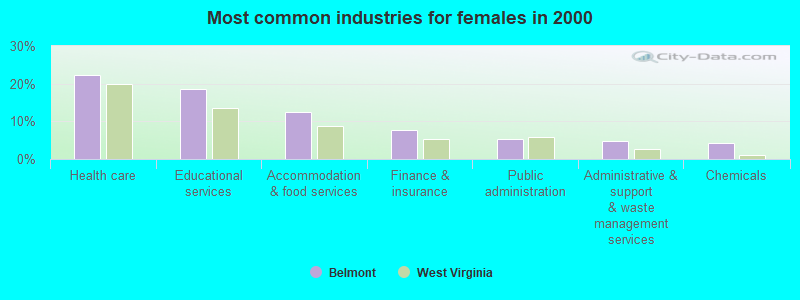
| Educational services | 12.9% (56) | 7.6% (17) | 18.6% (39) |
| Health care | 10.8% (47) | 0.0% (0) | 22.4% (47) |
| Chemicals | 8.3% (36) | 12.1% (27) | 4.3% (9) |
| Accommodation and food services | 7.1% (31) | 2.2% (5) | 12.4% (26) |
| Construction | 6.0% (26) | 10.3% (23) | 1.4% (3) |
| Finance and insurance | 5.8% (25) | 4.0% (9) | 7.6% (16) |
| Public administration | 4.8% (21) | 4.5% (10) | 5.2% (11) |
| Administrative and support and waste management services | 4.6% (20) | 4.5% (10) | 4.8% (10) |
| Utilities | 4.1% (18) | 6.7% (15) | 1.4% (3) |
| Food and beverage stores | 3.5% (15) | 3.6% (8) | 3.3% (7) |
| Metal and metal products | 3.2% (14) | 6.2% (14) | 0.0% (0) |
| Nonmetallic mineral products | 2.1% (9) | 3.1% (7) | 1.0% (2) |
| Publishing, and motion picture and sound recording industries | 1.8% (8) | 2.7% (6) | 1.0% (2) |
| Truck transportation | 1.8% (8) | 3.6% (8) | 0.0% (0) |
| Wood products | 1.6% (7) | 3.1% (7) | 0.0% (0) |
| Repair and maintenance | 1.6% (7) | 3.1% (7) | 0.0% (0) |
| Agriculture, forestry, fishing and hunting | 1.4% (6) | 2.7% (6) | 0.0% (0) |
| Professional, scientific, and technical services | 1.4% (6) | 1.8% (4) | 1.0% (2) |
| Motor vehicle and parts dealers | 1.4% (6) | 1.8% (4) | 1.0% (2) |
| U. S. Postal service | 1.2% (5) | 0.9% (2) | 1.4% (3) |
| Department and other general merchandise stores | 1.2% (5) | 0.9% (2) | 1.4% (3) |
| Machinery, equipment, and supplies merchant wholesalers | 0.9% (4) | 1.8% (4) | 0.0% (0) |
| Clothing and accessories, including shoe, stores | 0.9% (4) | 0.0% (0) | 1.9% (4) |
| Social assistance | 0.9% (4) | 0.0% (0) | 1.9% (4) |
| Miscellaneous manufacturing | 0.7% (3) | 1.3% (3) | 0.0% (0) |
| Other direct selling establishments | 0.7% (3) | 0.0% (0) | 1.4% (3) |
| Gasoline stations | 0.7% (3) | 0.9% (2) | 0.5% (1) |
| Other transportation, and support activities, and couriers | 0.7% (3) | 1.3% (3) | 0.0% (0) |
| Pharmacies and drug stores | 0.7% (3) | 0.0% (0) | 1.4% (3) |
| Hardware, plumbing and heating equipment, and supplies merchant wholesalers | 0.7% (3) | 1.3% (3) | 0.0% (0) |
| Furniture and related product manufacturing | 0.5% (2) | 0.9% (2) | 0.0% (0) |
| Groceries and related products merchant wholesalers | 0.5% (2) | 0.9% (2) | 0.0% (0) |
| Lumber and other construction materials merchant wholesalers | 0.5% (2) | 0.9% (2) | 0.0% (0) |
| Air transportation | 0.5% (2) | 0.9% (2) | 0.0% (0) |
| Computer and electronic products | 0.5% (2) | 0.9% (2) | 0.0% (0) |
| Warehousing and storage | 0.5% (2) | 0.0% (0) | 1.0% (2) |
| Data processing, libraries, and other information services | 0.5% (2) | 0.0% (0) | 1.0% (2) |
| Real estate and rental and leasing | 0.5% (2) | 0.9% (2) | 0.0% (0) |
| Electronic shopping and mail-order houses | 0.5% (2) | 0.0% (0) | 1.0% (2) |
| Metals and minerals, except petroleum, merchant wholesalers | 0.5% (2) | 0.0% (0) | 1.0% (2) |
| Furniture and home furnishings, and household appliance stores | 0.5% (2) | 0.9% (2) | 0.0% (0) |
| Religious, grantmaking, civic, professional, and similar organizations | 0.5% (2) | 0.9% (2) | 0.0% (0) |
| Private households | 0.5% (2) | 0.0% (0) | 1.0% (2) |
| Broadcasting and telecommunications | 0.2% (1) | 0.4% (1) | 0.0% (0) |
| Plastics and rubber products | 0.2% (1) | 0.4% (1) | 0.0% (0) |
Unemployment in Belmont
- Unemployment by race in 2022
- Unemployment rate for White non-Hispanic residents
- 4.0%Males
- 7.6%Females
- Unemployment by race in 2000
- Unemployment rate for White non-Hispanic residents
- 1.8%Males
- 4.6%Females
Time leaving home to go to work

12:00 a.m. to 4:59 a.m.:
| Belmont: | 4.0% (12) |
| West Virginia: | 6.2% (40,785) |
5:00 a.m. to 5:29 a.m.:
| Belmont: | 21.4% (66) |
| West Virginia: | 3.7% (24,623) |
5:30 a.m. to 5:59 a.m.:
| Belmont: | 0.6% (2) |
| West Virginia: | 5.7% (37,599) |
6:00 a.m. to 6:29 a.m.:
| Belmont: | 9.8% (30) |
| West Virginia: | 10.0% (66,185) |
6:30 a.m. to 6:59 a.m.:
| Belmont: | 3.1% (10) |
| West Virginia: | 9.6% (63,233) |
7:00 a.m. to 7:29 a.m.:
| Belmont: | 10.5% (33) |
| West Virginia: | 14.2% (93,622) |
7:30 a.m. to 7:59 a.m.:
| Belmont: | 23.2% (72) |
| West Virginia: | 11.7% (77,435) |
8:00 a.m. to 8:29 a.m.:
| Belmont: | 5.9% (18) |
| West Virginia: | 10.6% (69,988) |
8:30 a.m. to 8:59 a.m.:
| Belmont: | 1.0% (3) |
| West Virginia: | 4.7% (31,179) |
9:00 a.m. to 9:59 a.m.:
| Belmont: | 0.7% (2) |
| West Virginia: | 5.6% (37,311) |
10:00 a.m. to 10:59 a.m.:
| Belmont: | 5.3% (16) |
| West Virginia: | 2.5% (16,311) |
12:00 p.m. to 3:59 p.m.:
| Belmont: | 4.2% (13) |
| West Virginia: | 7.0% (46,555) |
4:00 p.m. to 11:59 p.m.:
| Belmont: | 5.9% (18) |
| West Virginia: | 7.1% (46,937) |

<5am:
| Belmont: | 6.1% (26) |
| West Virginia: | 3.9% (28,047) |
5:30am:
| Belmont: | 3.3% (14) |
| West Virginia: | 3.2% (23,235) |
6am:
| Belmont: | 4.0% (17) |
| West Virginia: | 4.8% (34,464) |
6:30am:
| Belmont: | 8.4% (36) |
| West Virginia: | 8.6% (61,784) |
7am:
| Belmont: | 14.0% (60) |
| West Virginia: | 10.1% (72,395) |
7:30am:
| Belmont: | 12.4% (53) |
| West Virginia: | 13.8% (98,948) |
8am:
| Belmont: | 18.7% (80) |
| West Virginia: | 15.2% (108,921) |
8:30am:
| Belmont: | 7.2% (31) |
| West Virginia: | 9.7% (69,399) |
9am:
| Belmont: | 1.6% (7) |
| West Virginia: | 4.7% (33,885) |
10am:
| Belmont: | 2.6% (11) |
| West Virginia: | 4.6% (33,112) |
11am:
| Belmont: | 1.9% (8) |
| West Virginia: | 2.1% (14,733) |
12pm:
| Belmont: | 1.9% (8) |
| West Virginia: | 1.1% (7,763) |
4pm:
| Belmont: | 6.8% (29) |
| West Virginia: | 8.1% (57,871) |
>4pm:
| Belmont: | 8.4% (36) |
| West Virginia: | 7.8% (56,126) |

12:00 a.m. to 4:59 a.m. - Males:
| Belmont: | 4.6% (9) |
| West Virginia: | 7.8% (27,728) |
5:00 a.m. to 5:29 a.m. - Males:
| Belmont: | 36.7% (70) |
| West Virginia: | 5.3% (18,680) |
6:00 a.m. to 6:29 a.m. - Males:
| Belmont: | 13.3% (25) |
| West Virginia: | 11.4% (40,309) |
6:30 a.m. to 6:59 a.m. - Males:
| Belmont: | 4.9% (9) |
| West Virginia: | 9.4% (33,409) |
7:00 a.m. to 7:29 a.m. - Males:
| Belmont: | 10.0% (19) |
| West Virginia: | 12.9% (45,886) |
7:30 a.m. to 7:59 a.m. - Males:
| Belmont: | 12.3% (23) |
| West Virginia: | 10.1% (35,698) |
9:00 a.m. to 9:59 a.m. - Males:
| Belmont: | 1.3% (2) |
| West Virginia: | 5.1% (18,066) |
10:00 a.m. to 10:59 a.m. - Males:
| Belmont: | 9.4% (18) |
| West Virginia: | 2.3% (8,119) |
12:00 p.m. to 3:59 p.m. - Males:
| Belmont: | 0.9% (2) |
| West Virginia: | 6.7% (23,594) |
4:00 p.m. to 11:59 p.m. - Males:
| Belmont: | 3.1% (6) |
| West Virginia: | 7.7% (27,448) |

12:00 a.m. to 4:59 a.m. - Females:
| Belmont: | 3.0% (4) |
| West Virginia: | 4.3% (13,057) |
5:30 a.m. to 5:59 a.m. - Females:
| Belmont: | 1.5% (2) |
| West Virginia: | 3.7% (11,394) |
6:00 a.m. to 6:29 a.m. - Females:
| Belmont: | 3.6% (4) |
| West Virginia: | 8.5% (25,876) |
7:00 a.m. to 7:29 a.m. - Females:
| Belmont: | 11.4% (14) |
| West Virginia: | 15.6% (47,736) |
7:30 a.m. to 7:59 a.m. - Females:
| Belmont: | 39.7% (47) |
| West Virginia: | 13.6% (41,737) |
8:00 a.m. to 8:29 a.m. - Females:
| Belmont: | 15.2% (18) |
| West Virginia: | 12.4% (37,967) |
8:30 a.m. to 8:59 a.m. - Females:
| Belmont: | 2.6% (3) |
| West Virginia: | 5.7% (17,593) |
12:00 p.m. to 3:59 p.m. - Females:
| Belmont: | 10.0% (12) |
| West Virginia: | 7.5% (22,961) |
4:00 p.m. to 11:59 p.m. - Females:
| Belmont: | 10.1% (12) |
| West Virginia: | 6.4% (19,489) |
Travel time to work
Percentage of workers working in this county: 46.2%
Number of people working at home: 9 (2.8% of all workers)
Number of people working at home: 9 (2.8% of all workers)


Less than 5 minutes:
| Belmont: | 6.8% (29) |
| West Virginia: | 4.0% (28,589) |
5 to 9 minutes:
| Belmont: | 21.0% (90) |
| West Virginia: | 11.7% (83,929) |
10 to 14 minutes:
| Belmont: | 15.9% (68) |
| West Virginia: | 15.4% (110,704) |
15 to 19 minutes:
| Belmont: | 5.4% (23) |
| West Virginia: | 15.7% (112,448) |
20 to 24 minutes:
| Belmont: | 8.6% (37) |
| West Virginia: | 13.5% (96,666) |
25 to 29 minutes:
| Belmont: | 7.0% (30) |
| West Virginia: | 5.3% (38,292) |
30 to 34 minutes:
| Belmont: | 14.0% (60) |
| West Virginia: | 11.1% (79,985) |
35 to 39 minutes:
| Belmont: | 3.0% (13) |
| West Virginia: | 2.4% (17,466) |
40 to 44 minutes:
| Belmont: | 3.5% (15) |
| West Virginia: | 2.8% (19,840) |
45 to 59 minutes:
| Belmont: | 4.7% (20) |
| West Virginia: | 6.9% (49,594) |
60 to 89 minutes:
| Belmont: | 2.1% (9) |
| West Virginia: | 4.9% (35,242) |
90 or more minutes:
| Belmont: | 5.1% (22) |
| West Virginia: | 3.9% (27,928) |
Means of transportation to work
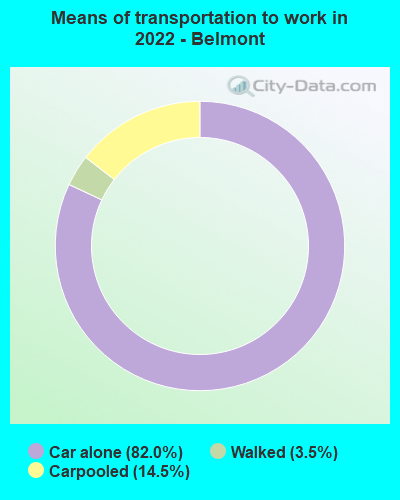
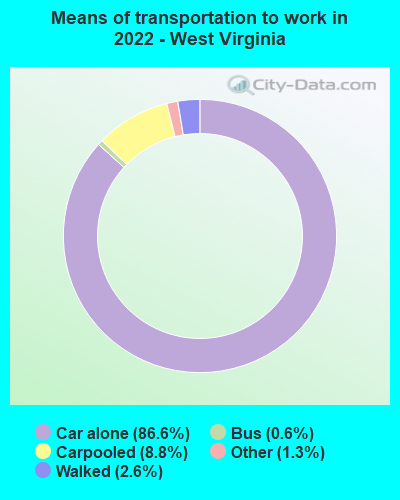
Drove car alone:
| Belmont: | 82.0% (300) |
| West Virginia: | 86.6% (262,986) |
Carpooled:
| Belmont: | 14.5% (53) |
| West Virginia: | 8.8% (27,402) |
Walked:
| Belmont: | 3.5% (13) |
| West Virginia: | 2.6% (8,086) |

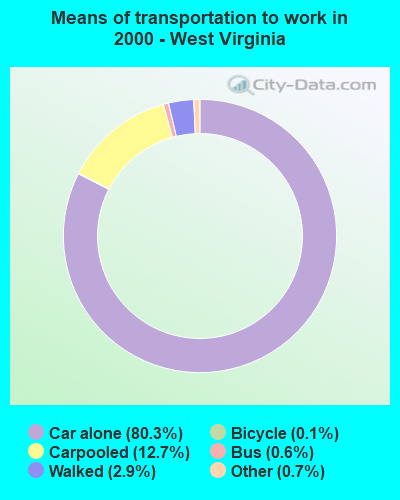
Drove car alone:
| Belmont: | 83.6% (358) |
| West Virginia: | 80.3% (576,360) |
Carpooled:
| Belmont: | 11.4% (49) |
| West Virginia: | 12.7% (91,133) |
Walked:
| Belmont: | 1.6% (7) |
| West Virginia: | 2.9% (21,059) |
Other means:
| Belmont: | 0.5% (2) |
| West Virginia: | 0.7% (5,379) |


Drove car alone - Males:
| Belmont: | 77.4% (168) |
| West Virginia: | 86.4% (262,986) |
Carpooled - Males:
| Belmont: | 21.3% (46) |
| West Virginia: | 8.6% (27,402) |
Walked - Males:
| Belmont: | 1.4% (3) |
| West Virginia: | 2.6% (8,086) |


Drove car alone - Females:
| Belmont: | 88.7% (132) |
| West Virginia: | 86.7% (262,986) |
Carpooled - Females:
| Belmont: | 4.6% (7) |
| West Virginia: | 9.0% (27,402) |
Walked - Females:
| Belmont: | 6.6% (10) |
| West Virginia: | 2.7% (8,086) |
Private vehicle occupancy

Drove alone:
| Belmont: | 95.5% (269) |
| West Virginia: | 90.4% (569,293) |
In 2 person carpool:
| Belmont: | 4.3% (12) |
| West Virginia: | 7.7% (48,251) |

Drove alone:
| Belmont: | 88.0% (358) |
| West Virginia: | 86.3% (576,360) |
In 2 person carpool:
| Belmont: | 6.6% (27) |
| West Virginia: | 11.1% (74,212) |
In 3 person carpool:
| Belmont: | 3.9% (16) |
| West Virginia: | 1.7% (11,417) |
In 4 person carpool:
| Belmont: | 1.5% (6) |
| West Virginia: | 0.5% (3,370) |
Class of workers

Employee of private company:
| Belmont: | 66.2% (235) |
| West Virginia: | 64.5% (474,637) |
Self-employed in own incorporated business:
| Belmont: | 1.1% (4) |
| West Virginia: | 2.8% (20,622) |
Private not-for-profit wage and salary workers:
| Belmont: | 5.9% (21) |
| West Virginia: | 8.6% (63,372) |
Local government workers:
| Belmont: | 14.9% (53) |
| West Virginia: | 7.1% (52,269) |
State government workers:
| Belmont: | 8.5% (30) |
| West Virginia: | 8.1% (59,474) |
Self-employed workers in own not incorporated business:
| Belmont: | 3.4% (12) |
| West Virginia: | 4.3% (31,634) |

Employee of private company:
| Belmont: | 68.2% (296) |
| West Virginia: | 66.7% (488,582) |
Self-employed in own incorporated business:
| Belmont: | 1.8% (8) |
| West Virginia: | 2.3% (16,512) |
Private not-for-profit wage and salary workers:
| Belmont: | 5.8% (25) |
| West Virginia: | 6.8% (50,039) |
Local government workers:
| Belmont: | 7.4% (32) |
| West Virginia: | 6.6% (48,204) |
State government workers:
| Belmont: | 7.8% (34) |
| West Virginia: | 7.7% (56,389) |
Federal government workers:
| Belmont: | 4.1% (18) |
| West Virginia: | 3.6% (26,733) |
Self-employed workers in own not incorporated business:
| Belmont: | 4.4% (19) |
| West Virginia: | 5.9% (43,225) |
Unpaid family workers:
| Belmont: | 0.5% (2) |
| West Virginia: | 0.4% (2,989) |

Employee of private company - Males:
| Belmont: | 83.5% (193) |
| West Virginia: | 68.2% (262,651) |
Self-employed in own incorporated business - Males:
| Belmont: | 1.7% (4) |
| West Virginia: | 3.5% (13,492) |
Local government workers - Males:
| Belmont: | 3.0% (7) |
| West Virginia: | 5.2% (20,188) |
State government workers - Males:
| Belmont: | 9.5% (22) |
| West Virginia: | 7.3% (28,170) |
Self-employed workers in own not incorporated business - Males:
| Belmont: | 2.2% (5) |
| West Virginia: | 4.7% (17,918) |

Employee of private company - Females:
| Belmont: | 33.9% (42) |
| West Virginia: | 60.4% (211,986) |
Private not-for-profit wage and salary workers - Females:
| Belmont: | 16.9% (21) |
| West Virginia: | 11.5% (40,323) |
Local government workers - Females:
| Belmont: | 37.1% (46) |
| West Virginia: | 9.1% (32,081) |
State government workers - Females:
| Belmont: | 6.5% (8) |
| West Virginia: | 8.9% (31,304) |
Self-employed workers in own not incorporated business - Females:
| Belmont: | 5.6% (7) |
| West Virginia: | 3.9% (13,716) |