Work and Jobs in Bennington, Vermont (VT) Detailed Stats
Occupations, Industries, Unemployment, Workers, Commute
Settings
X


Recent posts about work in Bennington, Vermont on our local forum with over 2,400,000 registered users:
 | Taking job in Sunderland: relocation to Bennington area? (5 replies) |
| Southern Vermont Retirement Advice! Thank you! (22 replies) |
| So where are the jobs outside of Burlington? (10 replies) |
| Bennington, Vermont: Looks nice. What's the catch? (35 replies) |
| Bennington, Vermont area (14 replies) |
| Bennington and surrounding area? (6 replies) |
Latest news about work in Bennington, VT collected exclusively by city-data.com from local newspapers, TV, and radio stations
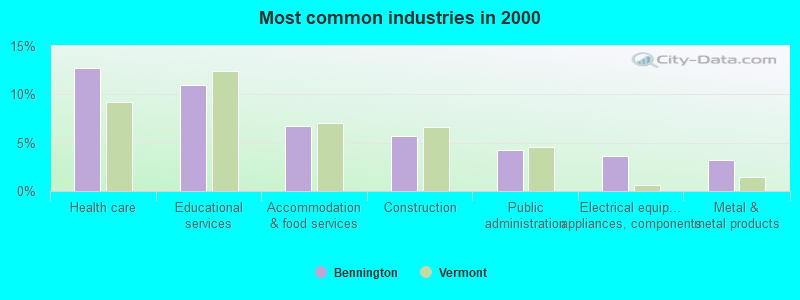
The most common industries in Bennington are: Health care (12.7% of civilian employees), Educational services (11.0% of civilian employees), Accommodation & food services (6.7% of civilian employees). 90.7% of workers work in Bennington County and 10.1% of all workers work at home. 58.5% of workers are employees of private companies, which is 6.5% greater than the rate of 54.7% across the entire state of Vermont.
Whole page based on the data from 2000 / 2022 when the population of Bennington, Vermont was 9,168 / 8,797
Whole page based on the data from 2000 / 2022 when the population of Bennington, Vermont was 9,168 / 8,797
Most common industries
Most common industries | |||
|---|---|---|---|
Industry | All | Males | Females |
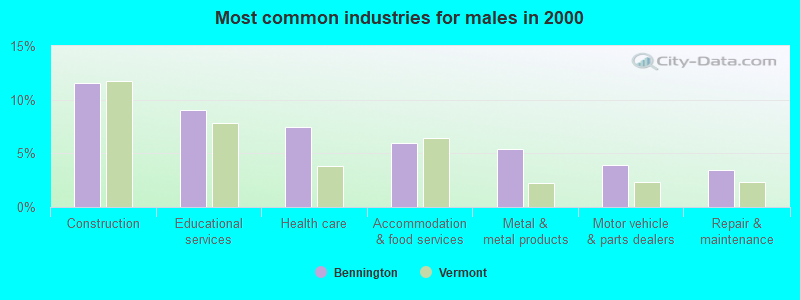
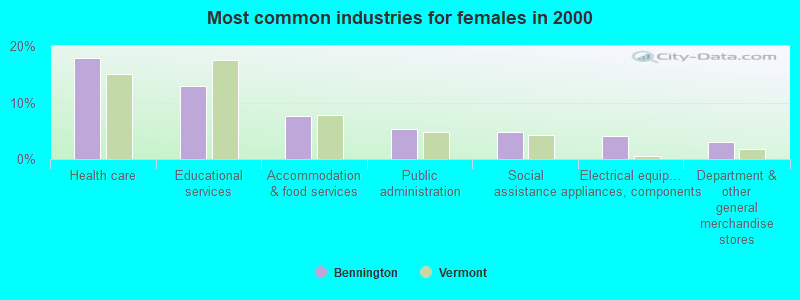
| Health care | 12.7% (556) | 7.4% (161) | 17.9% (395) |
| Educational services | 11.0% (479) | 9.0% (195) | 12.9% (284) |
| Accommodation and food services | 6.7% (294) | 5.9% (128) | 7.5% (166) |
| Construction | 5.7% (250) | 11.6% (250) | 0.0% (0) |
| Public administration | 4.2% (183) | 3.1% (67) | 5.3% (116) |
| Electrical equipment, appliances, and components | 3.6% (157) | 3.1% (68) | 4.0% (89) |
| Metal and metal products | 3.3% (142) | 5.4% (117) | 1.1% (25) |
| Food and beverage stores | 3.0% (132) | 3.1% (66) | 3.0% (66) |
| Social assistance | 2.7% (118) | 0.6% (13) | 4.8% (105) |
| Used merchandise, gift, novelty, and souvenir, and other miscellaneous stores | 2.5% (107) | 2.5% (54) | 2.4% (53) |
| Repair and maintenance | 2.4% (106) | 3.4% (74) | 1.5% (32) |
| Motor vehicle and parts dealers | 2.3% (99) | 3.9% (84) | 0.7% (15) |
| Department and other general merchandise stores | 2.2% (95) | 1.3% (28) | 3.0% (67) |
| Personal and laundry services | 2.1% (92) | 1.3% (29) | 2.9% (63) |
| Transportation equipment | 2.1% (90) | 3.1% (67) | 1.0% (23) |
| Administrative and support and waste management services | 2.0% (87) | 2.0% (44) | 2.0% (43) |
| Publishing, and motion picture and sound recording industries | 1.9% (82) | 1.3% (28) | 2.5% (54) |
| Finance and insurance | 1.9% (82) | 2.1% (46) | 1.6% (36) |
| Arts, entertainment, and recreation | 1.5% (67) | 1.4% (31) | 1.6% (36) |
| Religious, grantmaking, civic, professional, and similar organizations | 1.4% (63) | 0.0% (0) | 2.9% (63) |
| Plastics and rubber products | 1.4% (62) | 1.2% (25) | 1.7% (37) |
| Textile mills and textile products | 1.4% (60) | 1.8% (38) | 1.0% (22) |
| Nonmetallic mineral products | 1.4% (60) | 2.1% (45) | 0.7% (15) |
| Computer and electronic products | 1.3% (55) | 2.1% (45) | 0.5% (10) |
| Machinery | 1.2% (51) | 1.7% (36) | 0.7% (15) |
| Miscellaneous manufacturing | 1.1% (49) | 1.3% (29) | 0.9% (20) |
| Real estate and rental and leasing | 1.1% (46) | 0.4% (8) | 1.7% (38) |
| Petroleum and petroleum products merchant wholesalers | 1.0% (45) | 1.1% (23) | 1.0% (22) |
| Food | 1.0% (43) | 1.4% (30) | 0.6% (13) |
| Building material and garden equipment and supplies dealers | 1.0% (43) | 1.6% (35) | 0.4% (8) |
| Furniture and home furnishings, and household appliance stores | 1.0% (42) | 1.5% (32) | 0.5% (10) |
| Pharmacies and drug stores | 0.9% (41) | 0.5% (11) | 1.4% (30) |
| Other transportation, and support activities, and couriers | 0.7% (31) | 0.3% (6) | 1.1% (25) |
| Broadcasting and telecommunications | 0.7% (30) | 0.7% (15) | 0.7% (15) |
| Book stores and news dealers | 0.6% (28) | 0.1% (3) | 1.1% (25) |
| Air transportation | 0.6% (27) | 0.7% (15) | 0.5% (12) |
| Chemicals | 0.6% (26) | 0.8% (18) | 0.4% (8) |
| Wood products | 0.5% (24) | 1.1% (24) | 0.0% (0) |
| Private households | 0.5% (23) | 0.8% (18) | 0.2% (5) |
| Clothing and accessories, including shoe, stores | 0.5% (22) | 0.3% (7) | 0.7% (15) |
| Leather and allied products | 0.5% (22) | 0.0% (0) | 1.0% (22) |
| Data processing, libraries, and other information services | 0.5% (21) | 0.0% (0) | 1.0% (21) |
| Gasoline stations | 0.5% (20) | 0.9% (20) | 0.0% (0) |
| Agriculture, forestry, fishing and hunting | 0.5% (20) | 0.6% (13) | 0.3% (7) |
| Professional, scientific, and technical services | 0.4% (19) | 0.5% (10) | 0.4% (9) |
| Other direct selling establishments | 0.3% (15) | 0.4% (9) | 0.3% (6) |
| Electronic shopping and mail-order houses | 0.3% (14) | 0.0% (0) | 0.6% (14) |
| Paper | 0.3% (14) | 0.6% (14) | 0.0% (0) |
| Jewelry, luggage, and leather goods stores | 0.3% (13) | 0.0% (0) | 0.6% (13) |
| Radio, TV, and computer stores | 0.3% (13) | 0.6% (13) | 0.0% (0) |
| Recyclable material merchant wholesalers | 0.2% (9) | 0.4% (9) | 0.0% (0) |
| Electrical and electronic goods merchant wholesalers | 0.2% (9) | 0.0% (0) | 0.4% (9) |
| Groceries and related products merchant wholesalers | 0.2% (9) | 0.0% (0) | 0.4% (9) |
| Furniture and home furnishing merchant wholesalers | 0.2% (9) | 0.4% (9) | 0.0% (0) |
| Alcoholic beverages merchant wholesalers | 0.2% (8) | 0.4% (8) | 0.0% (0) |
| Miscellaneous nondurable goods merchant wholesalers | 0.2% (8) | 0.4% (8) | 0.0% (0) |
| Motor vehicles, parts and supplies merchant wholesalers | 0.2% (8) | 0.4% (8) | 0.0% (0) |
| Professional and commercial equipment and supplies merchant wholesalers | 0.2% (8) | 0.0% (0) | 0.4% (8) |
| Fuel dealers | 0.2% (7) | 0.0% (0) | 0.3% (7) |
| Truck transportation | 0.2% (7) | 0.3% (7) | 0.0% (0) |
| Utilities | 0.1% (6) | 0.3% (6) | 0.0% (0) |
| Mining, quarrying, and oil and gas extraction | 0.1% (6) | 0.3% (6) | 0.0% (0) |
| Machinery, equipment, and supplies merchant wholesalers | 0.1% (6) | 0.3% (6) | 0.0% (0) |
| Furniture and related product manufacturing | 0.1% (3) | 0.1% (3) | 0.0% (0) |
Unemployment in Bennington
- Unemployment by race in 2022
- Unemployment rate for White non-Hispanic residents
- 3.5%Males
- 3.0%Females
- Unemployment rate for Asian residents
- 20.2%Males
- 100.0%Females
- Unemployment by race in 2000
- Unemployment rate for White non-Hispanic residents
- 5.9%Males
- 5.0%Females
- Unemployment rate for two or more race residents
- 22.2%Females
Time leaving home to go to work

12:00 a.m. to 4:59 a.m.:
| Bennington: | 12.8% (428) |
| Vermont: | 4.6% (13,068) |
5:00 a.m. to 5:29 a.m.:
| Bennington: | 0.7% (24) |
| Vermont: | 2.0% (5,620) |
5:30 a.m. to 5:59 a.m.:
| Bennington: | 4.3% (145) |
| Vermont: | 4.1% (11,617) |
6:00 a.m. to 6:29 a.m.:
| Bennington: | 5.2% (175) |
| Vermont: | 7.8% (22,005) |
6:30 a.m. to 6:59 a.m.:
| Bennington: | 6.9% (232) |
| Vermont: | 9.6% (26,984) |
7:00 a.m. to 7:29 a.m.:
| Bennington: | 12.3% (412) |
| Vermont: | 16.6% (46,920) |
7:30 a.m. to 7:59 a.m.:
| Bennington: | 16.4% (552) |
| Vermont: | 15.2% (42,950) |
8:00 a.m. to 8:29 a.m.:
| Bennington: | 7.8% (263) |
| Vermont: | 12.7% (35,673) |
8:30 a.m. to 8:59 a.m.:
| Bennington: | 5.6% (187) |
| Vermont: | 5.6% (15,922) |
9:00 a.m. to 9:59 a.m.:
| Bennington: | 1.7% (55) |
| Vermont: | 5.9% (16,491) |
10:00 a.m. to 10:59 a.m.:
| Bennington: | 2.6% (86) |
| Vermont: | 2.5% (7,138) |
11:00 a.m. to 11:59 a.m.:
| Bennington: | 2.4% (81) |
| Vermont: | 1.5% (4,356) |
12:00 p.m. to 3:59 p.m.:
| Bennington: | 14.3% (478) |
| Vermont: | 7.2% (20,225) |
4:00 p.m. to 11:59 p.m.:
| Bennington: | 9.2% (309) |
| Vermont: | 4.6% (12,885) |

<5am:
| Bennington: | 3.3% (141) |
| Vermont: | 3.1% (9,660) |
5:30am:
| Bennington: | 1.7% (74) |
| Vermont: | 2.4% (7,330) |
6am:
| Bennington: | 5.5% (235) |
| Vermont: | 4.0% (12,509) |
6:30am:
| Bennington: | 5.3% (230) |
| Vermont: | 7.8% (24,450) |
7am:
| Bennington: | 10.0% (430) |
| Vermont: | 11.1% (34,572) |
7:30am:
| Bennington: | 12.0% (517) |
| Vermont: | 14.8% (46,249) |
8am:
| Bennington: | 16.1% (695) |
| Vermont: | 16.2% (50,397) |
8:30am:
| Bennington: | 12.4% (536) |
| Vermont: | 10.7% (33,273) |
9am:
| Bennington: | 4.5% (194) |
| Vermont: | 4.7% (14,526) |
10am:
| Bennington: | 3.9% (168) |
| Vermont: | 4.6% (14,385) |
11am:
| Bennington: | 2.2% (95) |
| Vermont: | 1.8% (5,484) |
12pm:
| Bennington: | 1.0% (42) |
| Vermont: | 0.9% (2,823) |
4pm:
| Bennington: | 11.8% (510) |
| Vermont: | 6.7% (20,897) |
>4pm:
| Bennington: | 6.4% (277) |
| Vermont: | 5.7% (17,633) |

12:00 a.m. to 4:59 a.m. - Males:
| Bennington: | 26.2% (406) |
| Vermont: | 6.8% (10,020) |
5:00 a.m. to 5:29 a.m. - Males:
| Bennington: | 0.7% (10) |
| Vermont: | 2.7% (3,928) |
5:30 a.m. to 5:59 a.m. - Males:
| Bennington: | 6.5% (100) |
| Vermont: | 5.1% (7,456) |
6:00 a.m. to 6:29 a.m. - Males:
| Bennington: | 8.3% (128) |
| Vermont: | 9.2% (13,439) |
6:30 a.m. to 6:59 a.m. - Males:
| Bennington: | 3.9% (60) |
| Vermont: | 11.1% (16,257) |
7:00 a.m. to 7:29 a.m. - Males:
| Bennington: | 13.3% (206) |
| Vermont: | 15.3% (22,447) |
7:30 a.m. to 7:59 a.m. - Males:
| Bennington: | 12.5% (194) |
| Vermont: | 12.3% (18,069) |
8:00 a.m. to 8:29 a.m. - Males:
| Bennington: | 3.1% (48) |
| Vermont: | 11.2% (16,364) |
8:30 a.m. to 8:59 a.m. - Males:
| Bennington: | 3.3% (51) |
| Vermont: | 5.3% (7,795) |
10:00 a.m. to 10:59 a.m. - Males:
| Bennington: | 4.8% (74) |
| Vermont: | 2.7% (4,002) |
11:00 a.m. to 11:59 a.m. - Males:
| Bennington: | 2.9% (45) |
| Vermont: | 1.5% (2,192) |
12:00 p.m. to 3:59 p.m. - Males:
| Bennington: | 10.9% (168) |
| Vermont: | 6.7% (9,852) |
4:00 p.m. to 11:59 p.m. - Males:
| Bennington: | 8.0% (124) |
| Vermont: | 4.9% (7,249) |

12:00 a.m. to 4:59 a.m. - Females:
| Bennington: | 1.9% (33) |
| Vermont: | 2.3% (3,048) |
5:00 a.m. to 5:29 a.m. - Females:
| Bennington: | 0.8% (15) |
| Vermont: | 1.3% (1,692) |
5:30 a.m. to 5:59 a.m. - Females:
| Bennington: | 2.4% (44) |
| Vermont: | 3.1% (4,161) |
6:00 a.m. to 6:29 a.m. - Females:
| Bennington: | 2.3% (42) |
| Vermont: | 6.3% (8,566) |
6:30 a.m. to 6:59 a.m. - Females:
| Bennington: | 8.9% (160) |
| Vermont: | 7.9% (10,727) |
7:00 a.m. to 7:29 a.m. - Females:
| Bennington: | 11.4% (207) |
| Vermont: | 18.1% (24,473) |
7:30 a.m. to 7:59 a.m. - Females:
| Bennington: | 20.0% (361) |
| Vermont: | 18.4% (24,881) |
8:00 a.m. to 8:29 a.m. - Females:
| Bennington: | 11.9% (215) |
| Vermont: | 14.3% (19,309) |
8:30 a.m. to 8:59 a.m. - Females:
| Bennington: | 7.0% (127) |
| Vermont: | 6.0% (8,127) |
9:00 a.m. to 9:59 a.m. - Females:
| Bennington: | 2.9% (53) |
| Vermont: | 6.6% (8,858) |
10:00 a.m. to 10:59 a.m. - Females:
| Bennington: | 1.1% (20) |
| Vermont: | 2.3% (3,136) |
11:00 a.m. to 11:59 a.m. - Females:
| Bennington: | 2.0% (36) |
| Vermont: | 1.6% (2,164) |
12:00 p.m. to 3:59 p.m. - Females:
| Bennington: | 17.5% (315) |
| Vermont: | 7.7% (10,373) |
4:00 p.m. to 11:59 p.m. - Females:
| Bennington: | 9.9% (178) |
| Vermont: | 4.2% (5,636) |
Travel time to work
Percentage of workers working in this county: 90.7%
Number of people working at home: 392 (10.1% of all workers)
Daytime population change due to commuting: +3,331 (+36.3%)
Workers who live and work in this place: 2,796 (64.9%)
Number of people working at home: 392 (10.1% of all workers)
Daytime population change due to commuting: +3,331 (+36.3%)
Workers who live and work in this place: 2,796 (64.9%)

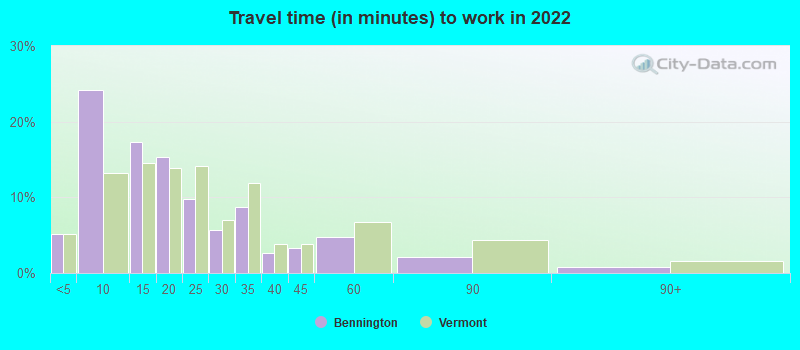

Less than 5 minutes:
| Bennington: | 5.2% (334) |
| Vermont: | 5.1% (14,354) |
5 to 9 minutes:
| Bennington: | 24.1% (1,551) |
| Vermont: | 13.2% (37,272) |
10 to 14 minutes:
| Bennington: | 17.3% (1,111) |
| Vermont: | 14.5% (40,724) |
15 to 19 minutes:
| Bennington: | 15.4% (988) |
| Vermont: | 13.9% (39,033) |
20 to 24 minutes:
| Bennington: | 9.7% (625) |
| Vermont: | 14.1% (39,728) |
25 to 29 minutes:
| Bennington: | 5.7% (364) |
| Vermont: | 6.9% (19,526) |
30 to 34 minutes:
| Bennington: | 8.8% (565) |
| Vermont: | 11.9% (33,532) |
35 to 39 minutes:
| Bennington: | 2.6% (169) |
| Vermont: | 3.8% (10,763) |
40 to 44 minutes:
| Bennington: | 3.3% (214) |
| Vermont: | 3.8% (10,749) |
45 to 59 minutes:
| Bennington: | 4.7% (303) |
| Vermont: | 6.8% (19,083) |
60 to 89 minutes:
| Bennington: | 2.1% (132) |
| Vermont: | 4.3% (12,206) |
90 or more minutes:
| Bennington: | 0.7% (48) |
| Vermont: | 1.5% (4,349) |


Less than 5 minutes:
| Bennington: | 9.6% (415) |
| Vermont: | 5.8% (18,209) |
5 to 9 minutes:
| Bennington: | 30.6% (1,321) |
| Vermont: | 14.2% (44,253) |
10 to 14 minutes:
| Bennington: | 25.4% (1,093) |
| Vermont: | 16.1% (50,133) |
15 to 19 minutes:
| Bennington: | 12.0% (517) |
| Vermont: | 14.9% (46,609) |
20 to 24 minutes:
| Bennington: | 5.4% (234) |
| Vermont: | 12.8% (39,922) |
25 to 29 minutes:
| Bennington: | 1.2% (53) |
| Vermont: | 5.4% (16,919) |
30 to 34 minutes:
| Bennington: | 4.4% (190) |
| Vermont: | 10.1% (31,641) |
35 to 39 minutes:
| Bennington: | 0.9% (37) |
| Vermont: | 2.2% (6,974) |
40 to 44 minutes:
| Bennington: | 0.3% (13) |
| Vermont: | 2.7% (8,296) |
45 to 59 minutes:
| Bennington: | 2.3% (101) |
| Vermont: | 5.3% (16,427) |
60 to 89 minutes:
| Bennington: | 2.6% (113) |
| Vermont: | 2.9% (9,137) |
90 or more minutes:
| Bennington: | 1.3% (57) |
| Vermont: | 1.8% (5,668) |

Less than 5 minutes - Males:
| Bennington: | 5.7% (143) |
| Vermont: | 4.8% (7,010) |
5 to 9 minutes - Males:
| Bennington: | 20.3% (507) |
| Vermont: | 12.1% (17,701) |
10 to 14 minutes - Males:
| Bennington: | 9.6% (239) |
| Vermont: | 13.1% (19,260) |
15 to 19 minutes - Males:
| Bennington: | 16.6% (415) |
| Vermont: | 14.3% (20,964) |
20 to 24 minutes - Males:
| Bennington: | 8.7% (217) |
| Vermont: | 15.3% (22,408) |
25 to 29 minutes - Males:
| Bennington: | 7.3% (183) |
| Vermont: | 6.1% (8,976) |
30 to 34 minutes - Males:
| Bennington: | 14.3% (357) |
| Vermont: | 12.1% (17,792) |
35 to 39 minutes - Males:
| Bennington: | 2.9% (72) |
| Vermont: | 3.7% (5,359) |
40 to 44 minutes - Males:
| Bennington: | 4.1% (102) |
| Vermont: | 4.1% (6,005) |
45 to 59 minutes - Males:
| Bennington: | 5.5% (137) |
| Vermont: | 7.4% (10,842) |
60 to 89 minutes - Males:
| Bennington: | 3.9% (96) |
| Vermont: | 5.1% (7,413) |
90 or more minutes - Males:
| Bennington: | 1.1% (27) |
| Vermont: | 1.9% (2,787) |

Less than 5 minutes - Females:
| Bennington: | 4.9% (194) |
| Vermont: | 5.4% (7,344) |
5 to 9 minutes - Females:
| Bennington: | 26.9% (1,057) |
| Vermont: | 14.5% (19,571) |
10 to 14 minutes - Females:
| Bennington: | 23.1% (906) |
| Vermont: | 15.9% (21,464) |
15 to 19 minutes - Females:
| Bennington: | 14.3% (561) |
| Vermont: | 13.4% (18,069) |
20 to 24 minutes - Females:
| Bennington: | 9.9% (389) |
| Vermont: | 12.8% (17,320) |
25 to 29 minutes - Females:
| Bennington: | 4.6% (179) |
| Vermont: | 7.8% (10,550) |
30 to 34 minutes - Females:
| Bennington: | 5.4% (211) |
| Vermont: | 11.7% (15,740) |
35 to 39 minutes - Females:
| Bennington: | 2.5% (100) |
| Vermont: | 4.0% (5,404) |
40 to 44 minutes - Females:
| Bennington: | 2.8% (109) |
| Vermont: | 3.5% (4,744) |
45 to 59 minutes - Females:
| Bennington: | 4.2% (166) |
| Vermont: | 6.1% (8,241) |
60 to 89 minutes - Females:
| Bennington: | 0.9% (35) |
| Vermont: | 3.6% (4,793) |
90 or more minutes - Females:
| Bennington: | 0.5% (21) |
| Vermont: | 1.2% (1,562) |
Means of transportation to work
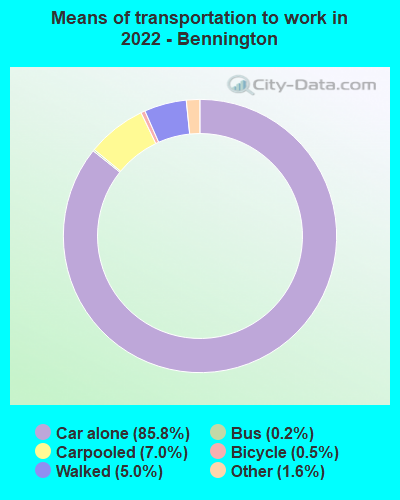
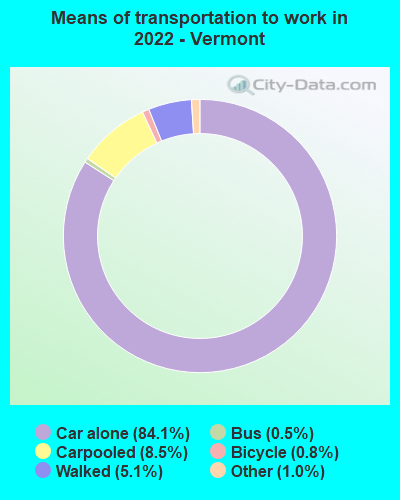
Drove car alone:
| Bennington: | 85.8% (5,733) |
| Vermont: | 84.1% (113,056) |
Carpooled:
| Bennington: | 7.0% (465) |
| Vermont: | 8.5% (11,381) |
Bus:
| Bennington: | 0.2% (12) |
| Vermont: | 0.5% (898) |
Bicycle:
| Bennington: | 0.5% (31) |
| Vermont: | 0.8% (914) |
Walked:
| Bennington: | 5.0% (335) |
| Vermont: | 5.1% (7,199) |
Other means:
| Bennington: | 1.6% (108) |
| Vermont: | 1.0% (1,244) |

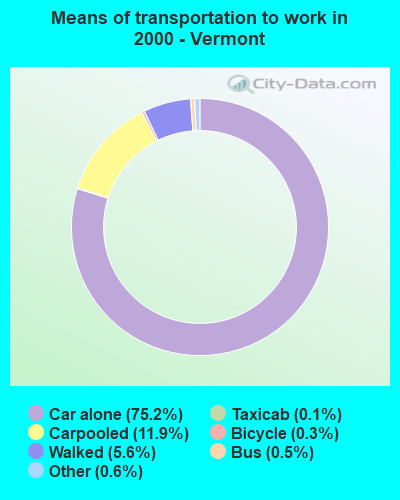
Drove car alone:
| Bennington: | 73.4% (3,165) |
| Vermont: | 75.2% (234,388) |
Carpooled:
| Bennington: | 13.9% (598) |
| Vermont: | 11.9% (37,191) |
Bus or trolley bus:
| Bennington: | 0.3% (15) |
| Vermont: | 0.5% (1,569) |
Taxicab:
| Bennington: | 0.8% (33) |
| Vermont: | 0.1% (388) |
Motorcycle:
| Bennington: | 0.2% (10) |
| Vermont: | 0.0% (136) |
Bicycle:
| Bennington: | 0.9% (39) |
| Vermont: | 0.3% (977) |
Walked:
| Bennington: | 6.1% (265) |
| Vermont: | 5.6% (17,554) |
Other means:
| Bennington: | 0.4% (19) |
| Vermont: | 0.6% (1,734) |

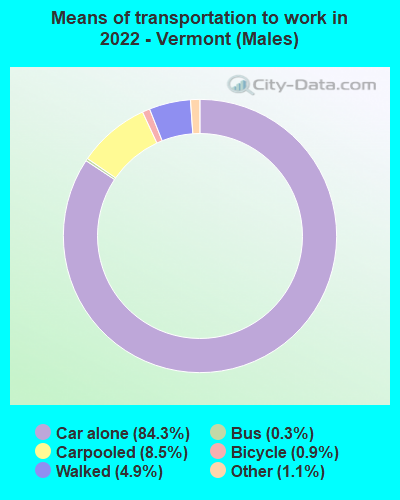
Drove car alone - Males:
| Bennington: | 86.6% (2,233) |
| Vermont: | 84.3% (113,056) |
Carpooled - Males:
| Bennington: | 6.8% (174) |
| Vermont: | 8.5% (11,381) |
Bus - Males:
| Bennington: | 0.4% (10) |
| Vermont: | 0.3% (898) |
Walked - Males:
| Bennington: | 3.5% (91) |
| Vermont: | 4.9% (7,199) |
Other means - Males:
| Bennington: | 2.8% (71) |
| Vermont: | 1.1% (1,244) |


Drove car alone - Females:
| Bennington: | 85.3% (3,506) |
| Vermont: | 83.9% (113,056) |
Carpooled - Females:
| Bennington: | 7.1% (291) |
| Vermont: | 8.4% (11,381) |
Bus - Females:
| Bennington: | 0.1% (2) |
| Vermont: | 0.7% (898) |
Bicycle - Females:
| Bennington: | 0.8% (31) |
| Vermont: | 0.7% (914) |
Walked - Females:
| Bennington: | 6.0% (245) |
| Vermont: | 5.3% (7,199) |
Other means - Females:
| Bennington: | 0.9% (36) |
| Vermont: | 0.9% (1,244) |
Private vehicle occupancy

Drove alone:
| Bennington: | 83.7% (2,777) |
| Vermont: | 90.6% (235,835) |
In 2 person carpool:
| Bennington: | 4.1% (135) |
| Vermont: | 7.5% (19,529) |
In 4 person carpool:
| Bennington: | 0.3% (10) |
| Vermont: | 0.3% (835) |
In 5-6 person carpool:
| Bennington: | 11.9% (395) |
| Vermont: | 0.5% (1,328) |

Drove alone:
| Bennington: | 84.1% (3,165) |
| Vermont: | 86.3% (234,388) |
In 2 person carpool:
| Bennington: | 13.9% (524) |
| Vermont: | 11.4% (30,882) |
In 3 person carpool:
| Bennington: | 1.4% (51) |
| Vermont: | 1.6% (4,340) |
In 4 person carpool:
| Bennington: | 0.3% (13) |
| Vermont: | 0.5% (1,230) |
In 5-6 person carpool:
| Bennington: | 0.3% (10) |
| Vermont: | 0.2% (441) |
Class of workers

Employee of private company:
| Bennington: | 58.5% (2,216) |
| Vermont: | 54.7% (188,342) |
Self-employed in own incorporated business:
| Bennington: | 5.7% (218) |
| Vermont: | 4.8% (16,454) |
Private not-for-profit wage and salary workers:
| Bennington: | 16.1% (609) |
| Vermont: | 16.9% (58,278) |
Local government workers:
| Bennington: | 7.9% (299) |
| Vermont: | 7.7% (26,443) |
State government workers:
| Bennington: | 4.2% (160) |
| Vermont: | 4.3% (14,935) |
Federal government workers:
| Bennington: | 0.8% (31) |
| Vermont: | 2.4% (8,337) |
Self-employed workers in own not incorporated business:
| Bennington: | 6.7% (255) |
| Vermont: | 9.0% (31,083) |

Employee of private company:
| Bennington: | 64.4% (2,813) |
| Vermont: | 59.9% (189,982) |
Self-employed in own incorporated business:
| Bennington: | 2.1% (91) |
| Vermont: | 3.8% (12,027) |
Private not-for-profit wage and salary workers:
| Bennington: | 10.1% (441) |
| Vermont: | 11.6% (36,669) |
Local government workers:
| Bennington: | 8.8% (386) |
| Vermont: | 7.6% (24,003) |
State government workers:
| Bennington: | 3.5% (154) |
| Vermont: | 4.3% (13,652) |
Federal government workers:
| Bennington: | 1.4% (61) |
| Vermont: | 2.3% (7,355) |
Self-employed workers in own not incorporated business:
| Bennington: | 9.6% (420) |
| Vermont: | 10.3% (32,546) |

Employee of private company - Males:
| Bennington: | 73.5% (1,215) |
| Vermont: | 59.7% (104,328) |
Self-employed in own incorporated business - Males:
| Bennington: | 0.4% (6) |
| Vermont: | 6.3% (10,965) |
Private not-for-profit wage and salary workers - Males:
| Bennington: | 7.8% (129) |
| Vermont: | 11.8% (20,650) |
Local government workers - Males:
| Bennington: | 7.1% (117) |
| Vermont: | 5.7% (9,930) |
State government workers - Males:
| Bennington: | 2.5% (42) |
| Vermont: | 3.7% (6,435) |
Federal government workers - Males:
| Bennington: | 1.9% (31) |
| Vermont: | 2.3% (4,077) |
Self-employed workers in own not incorporated business - Males:
| Bennington: | 6.9% (114) |
| Vermont: | 10.5% (18,300) |

Employee of private company - Females:
| Bennington: | 46.9% (1,001) |
| Vermont: | 49.5% (84,014) |
Self-employed in own incorporated business - Females:
| Bennington: | 9.9% (211) |
| Vermont: | 3.2% (5,489) |
Private not-for-profit wage and salary workers - Females:
| Bennington: | 22.5% (480) |
| Vermont: | 22.2% (37,628) |
Local government workers - Females:
| Bennington: | 8.5% (182) |
| Vermont: | 9.7% (16,513) |
State government workers - Females:
| Bennington: | 5.6% (118) |
| Vermont: | 5.0% (8,500) |
Self-employed workers in own not incorporated business - Females:
| Bennington: | 6.6% (141) |
| Vermont: | 7.5% (12,783) |