Work and Jobs in Bluewater, California (CA) Detailed Stats
Data:
Unemployment (%)
Unemployment (% change since 2000)
Unemployment (%) - White
Unemployment (% change since 2000) - White
Unemployment (%) - Black or African American
Unemployment (% change since 2000) - Black or African American
Unemployment (%) - Asian
Unemployment (% change since 2000) - Asian
Unemployment (%) - Hispanic or Latino
Unemployment (% change since 2000) - Hispanic or Latino
Unemployment (%) - American Indian and Alaska Native
Unemployment (% change since 2000) - American Indian and Alaska Native
Unemployment (%) - Multirace
Unemployment (% change since 2000) - Multirace
Unemployment (%) - Other Race
Unemployment (% change since 2000) - Other Race
Industry diversity
Most Common Industries - Agriculture, forestry, fishing and hunting, and mining (%)
Most Common Industries - Agriculture, forestry, fishing and hunting (%)
Most Common Industries - Mining, quarrying, and oil and gas extraction (%)
Most Common Industries - Construction (%)
Most Common Industries - Manufacturing (%)
Most Common Industries - Wholesale trade (%)
Most Common Industries - Retail trade (%)
Most Common Industries - Transportation and warehousing, and utilities (%)
Most Common Industries - Transportation and warehousing (%)
Most Common Industries - Utilities (%)
Most Common Industries - Information (%)
Most Common Industries - Finance and insurance, and real estate and rental and leasing (%)
Most Common Industries - Finance and insurance (%)
Most Common Industries - Real estate and rental and leasing (%)
Most Common Industries - Professional, scientific, and management, and administrative and waste management services (%)
Most Common Industries - Professional, scientific, and technical services (%)
Most Common Industries - Management of companies and enterprises (%)
Most Common Industries - Administrative and support and waste management services (%)
Most Common Industries - Educational services, and health care and social assistance (%)
Most Common Industries - Educational services (%)
Most Common Industries - Health care and social assistance (%)
Most Common Industries - Arts, entertainment, and recreation, and accommodation and food services (%)
Most Common Industries - Arts, entertainment, and recreation (%)
Most Common Industries - Accommodation and food services (%)
Most Common Industries - Other services, except public administration (%)
Most Common Industries - Public administration (%)
Occupation diversity
Most Common Occupations - Management, business, science, and arts occupations (%)
Most Common Occupations - Management, business, and financial occupations (%)
Most Common Occupations - Management occupations (%)
Most Common Occupations - Business and financial operations occupations (%)
Most Common Occupations - Computer, engineering, and science occupations (%)
Most Common Occupations - Computer and mathematical occupations (%)
Most Common Occupations - Architecture and engineering occupations (%)
Most Common Occupations - Life, physical, and social science occupations (%)
Most Common Occupations - Education, legal, community service, arts, and media occupations (%)
Most Common Occupations - Community and social service occupations (%)
Most Common Occupations - Legal occupations (%)
Most Common Occupations - Education, training, and library occupations (%)
Most Common Occupations - Arts, design, entertainment, sports, and media occupations (%)
Most Common Occupations - Healthcare practitioners and technical occupations (%)
Most Common Occupations - Health diagnosing and treating practitioners and other technical occupations (%)
Most Common Occupations - Health technologists and technicians (%)
Most Common Occupations - Service occupations (%)
Most Common Occupations - Healthcare support occupations (%)
Most Common Occupations - Protective service occupations (%)
Most Common Occupations - Fire fighting and prevention, and other protective service workers including supervisors (%)
Most Common Occupations - Law enforcement workers including supervisors (%)
Most Common Occupations - Food preparation and serving related occupations (%)
Most Common Occupations - Building and grounds cleaning and maintenance occupations (%)
Most Common Occupations - Personal care and service occupations (%)
Most Common Occupations - Sales and office occupations (%)
Most Common Occupations - Sales and related occupations (%)
Most Common Occupations - Office and administrative support occupations (%)
Most Common Occupations - Natural resources, construction, and maintenance occupations (%)
Most Common Occupations - Farming, fishing, and forestry occupations (%)
Most Common Occupations - Construction and extraction occupations (%)
Most Common Occupations - Installation, maintenance, and repair occupations (%)
Most Common Occupations - Production, transportation, and material moving occupations (%)
Most Common Occupations - Production occupations (%)
Most Common Occupations - Transportation occupations (%)
Most Common Occupations - Material moving occupations (%)
Private vehicle occupancy - Drove alone (% change since 2000)
Private vehicle occupancy - Carpooled (%)
Private vehicle occupancy - Carpooled (% change since 2000)
Private vehicle occupancy - In 2-person carpool (%)
Private vehicle occupancy - In 2-person carpool (% change since 2000)
Private vehicle occupancy - In 3-person carpool (%)
Private vehicle occupancy - In 3-person carpool (% change since 2000)
Private vehicle occupancy - In 4-person carpool (%)
Private vehicle occupancy - In 4-person carpool (% change since 2000)
Private vehicle occupancy - In 5- or 6-person carpool (%)
Private vehicle occupancy - In 5- or 6-person carpool (% change since 2000)
Private vehicle occupancy - In 7-or-more-person carpool (%)
Private vehicle occupancy - In 7-or-more-person carpool (% change since 2000)
Time Leaving Home To Go To Work - 12:00 a.m. to 4:59 a.m. (%)
Time Leaving Home To Go To Work - 12:00 a.m. to 4:59 a.m. (% change since 2000)
Time Leaving Home To Go To Work - 5:00 a.m. to 5:59 a.m. (%)
Time Leaving Home To Go To Work - 5:00 a.m. to 5:59 a.m. (% change since 2000)
Time Leaving Home To Go To Work - 6:00 a.m. to 6:59 a.m. (%)
Time Leaving Home To Go To Work - 6:00 a.m. to 6:59 a.m. (% change since 2000)
Time Leaving Home To Go To Work - 7:00 a.m. to 7:59 a.m. (%)
Time Leaving Home To Go To Work - 7:00 a.m. to 7:59 a.m. (% change since 2000)
Time Leaving Home To Go To Work - 8:00 a.m. to 8:59 a.m. (%)
Time Leaving Home To Go To Work - 8:00 a.m. to 8:59 a.m. (% change since 2000)
Time Leaving Home To Go To Work - 9:00 a.m. to 9:59 a.m. (%)
Time Leaving Home To Go To Work - 9:00 a.m. to 9:59 a.m. (% change since 2000)
Time Leaving Home To Go To Work - 10:00 a.m. to 10:59 a.m. (%)
Time Leaving Home To Go To Work - 10:00 a.m. to 10:59 a.m. (% change since 2000)
Time Leaving Home To Go To Work - 11:00 a.m. to 11:59 a.m. (%)
Time Leaving Home To Go To Work - 11:00 a.m. to 11:59 a.m. (% change since 2000)
Time Leaving Home To Go To Work - 12:00 p.m. to 3:59 p.m. (%)
Time Leaving Home To Go To Work - 12:00 p.m. to 3:59 p.m. (% change since 2000)
Time Leaving Home To Go To Work - 4:00 p.m. to 11:59 p.m. (%)
Time Leaving Home To Go To Work - 4:00 p.m. to 11:59 p.m. (% change since 2000)
Class of Workers - Employee of private company (%)
Class of Workers - Employee of private company (% change since 2000)
Class of Workers - Self-employed in own incorporated business (%)
Class of Workers - Self-employed in own incorporated business (% change since 2000)
Class of Workers - Private not-for-profit wage and salary workers (%)
Class of Workers - Private not-for-profit wage and salary workers (% change since 2000)
Class of Workers - Local government workers (%)
Class of Workers - Local government workers (% change since 2000)
Class of Workers - State government workers (%)
Class of Workers - State government workers (% change since 2000)
Class of Workers - Federal government workers (%)
Class of Workers - Federal government workers (% change since 2000)
Class of Workers - Self-employed workers in own not incorporated business and Unpaid family workers (%)
Class of Workers - Self-employed workers in own not incorporated business and Unpaid family workers (% change since 2000)
Means of transportation to work - Drove car alone (%)
Means of transportation to work - Drove car alone (% change since 2000)
Means of transportation to work - Carpooled (%)
Means of transportation to work - Carpooled (% change since 2000)
Means of transportation to work - Public transportation (%)
Means of transportation to work - Public transportation (% change since 2000)
Means of transportation to work - Bus or trolley bus (%)
Means of transportation to work - Bus or trolley bus (% change since 2000)
Means of transportation to work - Streetcar or trolley car (%)
Means of transportation to work - Streetcar or trolley car (% change since 2000)
Means of transportation to work - Subway or elevated (%)
Means of transportation to work - Subway or elevated (% change since 2000)
Means of transportation to work - Railroad (%)
Means of transportation to work - Railroad (% change since 2000)
Means of transportation to work - Ferryboat (%)
Means of transportation to work - Ferryboat (% change since 2000)
Means of transportation to work - Taxicab (%)
Means of transportation to work - Taxicab (% change since 2000)
Means of transportation to work - Motorcycle (%)
Means of transportation to work - Motorcycle (% change since 2000)
Means of transportation to work - Bicycle (%)
Means of transportation to work - Bicycle (% change since 2000)
Means of transportation to work - Walked (%)
Means of transportation to work - Walked (% change since 2000)
Means of transportation to work - Other means (%)
Means of transportation to work - Other means (% change since 2000)
Working at home (%)
Working at home (% change since 2000)
Travel time to work - Less than 5 minutes (%)
Travel time to work - Less than 5 minutes (% change since 2000)
Travel time to work - 5 to 9 minutes (%)
Travel time to work - 5 to 9 minutes (% change since 2000)
Travel time to work - 10 to 19 minutes (%)
Travel time to work - 10 to 19 minutes (% change since 2000)
Travel time to work - 20 to 29 minutes (%)
Travel time to work - 20 to 29 minutes (% change since 2000)
Travel time to work - 30 to 39 minutes (%)
Travel time to work - 30 to 39 minutes (% change since 2000)
Travel time to work - 40 to 59 minutes (%)
Travel time to work - 40 to 59 minutes (% change since 2000)
Travel time to work - 60 to 89 minutes (%)
Travel time to work - 60 to 89 minutes (% change since 2000)
Travel time to work - 90 or more minutes (%)
Travel time to work - 90 or more minutes (% change since 2000)
Latest news about work in Bluewater, CA collected exclusively by city-data.com from local newspapers, TV, and radio stations
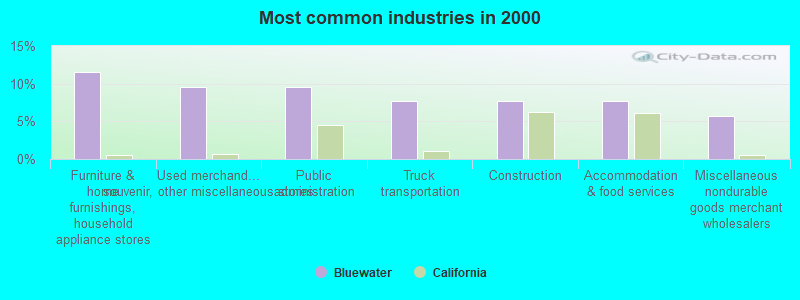
The most common industries in Bluewater are: Furniture & home furnishings, household appliance stores (11.5% of civilian employees), Used merchandise, gift, novelty, souvenir, other miscellaneous stores (9.6% of civilian employees), Public administration (9.6% of civilian employees). 45.2% of workers work in San Bernardino County and 28.6% of all workers work at home. 45.2% of workers are employees of private companies, which is 47.0% less than the rate of 66.5% across the entire state of California.
Whole page based on the data from 2000 / 2022 when the population of Bluewater, California was 265 / 168
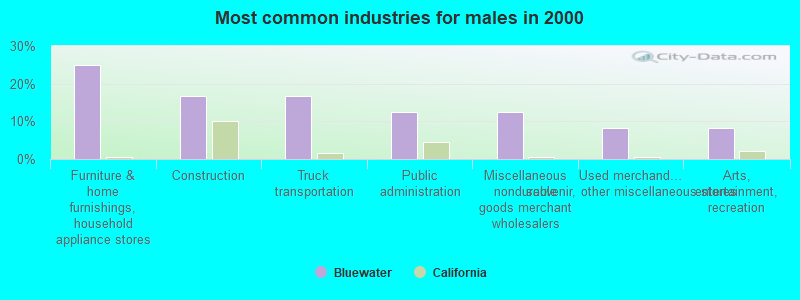
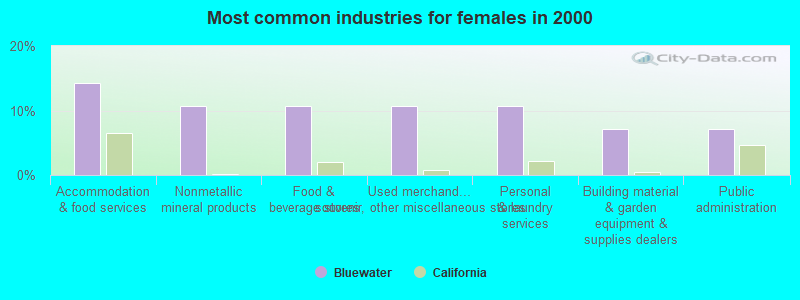
Most common industries
Most common industries Industry All Males Females
Furniture and home furnishings, and household appliance stores 11.5% 25.0% 0.0% Used merchandise, gift, novelty, and souvenir, and other miscellaneous stores 9.6% 8.3% 10.7% Public administration 9.6% 12.5% 7.1% Truck transportation 7.7% 16.7% 0.0% Construction 7.7% 16.7% 0.0% Accommodation and food services 7.7% 0.0% 14.3% Miscellaneous nondurable goods merchant wholesalers 5.8% 12.5% 0.0% Nonmetallic mineral products 5.8% 0.0% 10.7% Food and beverage stores 5.8% 0.0% 10.7% Personal and laundry services 5.8% 0.0% 10.7% Building material and garden equipment and supplies dealers 3.8% 0.0% 7.1% Real estate and rental and leasing 3.8% 0.0% 7.1% Professional, scientific, and technical services 3.8% 0.0% 7.1% Health care 3.8% 0.0% 7.1% Arts, entertainment, and recreation 3.8% 8.3% 0.0% Broadcasting and telecommunications 1.9% 0.0% 3.6% Educational services 1.9% 0.0% 3.6%
Unemployment in Bluewater Unemployment by race in 2022
Unemployment rate for White non-Hispanic residents 32.6% MalesUnemployment by race in 2000
Unemployment rate for White non-Hispanic residents 20.0% Males
Time leaving home to go to work 7:30 a.m. to 7:59 a.m.: Bluewater:
75.9% (23)California:
10.1% (1,550,402)
10:00 a.m. to 10:59 a.m.: Bluewater:
23.0% (7)California:
4.0% (613,193)
<5am: Bluewater:
5.8% (3)California:
4.2% (606,086)
5:30am: Bluewater:
15.4% (8)California:
3.6% (523,209)
6am: Bluewater:
5.8% (3)California:
4.8% (692,256)
6:30am: Bluewater:
7.7% (4)California:
8.4% (1,216,867)
7am: Bluewater:
5.8% (3)California:
9.4% (1,362,830)
7:30am: Bluewater:
7.7% (4)California:
13.8% (2,006,950)
8am: Bluewater:
9.6% (5)California:
13.7% (1,986,831)
8:30am: Bluewater:
15.4% (8)California:
10.9% (1,577,815)
9am: Bluewater:
9.6% (5)California:
5.4% (778,152)
10am: Bluewater:
7.7% (4)California:
6.7% (972,355)
12pm: Bluewater:
3.8% (2)California:
1.3% (189,005)
4pm: Bluewater:
1.9% (1)California:
6.0% (865,284)
7:30 a.m. to 7:59 a.m. - Males: Bluewater:
52.9% (8)California:
8.2% (702,727)
10:00 a.m. to 10:59 a.m. - Males: Bluewater:
50.2% (8)California:
3.5% (301,425)
7:30 a.m. to 7:59 a.m. - Females: Bluewater:
99.3% (15)California:
12.4% (847,675)
Travel time to work Percentage of workers working in this county: 45.2%Number of people working at home: 12 (28.6% of all workers )
Less than 5 minutes: Bluewater:
19.2% (10)California:
2.2% (324,703)
5 to 9 minutes: Bluewater:
7.7% (4)California:
8.8% (1,280,443)
10 to 14 minutes: Bluewater:
55.8% (29)California:
13.3% (1,930,263)
15 to 19 minutes: Bluewater:
3.8% (2)California:
14.9% (2,157,970)
20 to 24 minutes: Bluewater:
5.8% (3)California:
13.8% (2,004,060)
30 to 34 minutes: Bluewater:
3.8% (2)California:
13.9% (2,025,657)
Means of transportation to work Drove car alone: Bluewater:
92.3% (48)California:
71.8% (10,432,462)
Carpooled: Bluewater:
3.8% (2)California:
14.5% (2,113,313)
Private vehicle occupancy Drove alone: Bluewater:
99.5% (30)California:
86.9% (12,187,486)
Drove alone: Bluewater:
96.0% (48)California:
83.2% (10,432,462)
In 2 person carpool: Bluewater:
4.0% (2)California:
12.5% (1,564,905)
Class of workers
Employee of private company: Bluewater:
45.2% (20)California:
66.5% (12,596,030)
Local government workers: Bluewater:
40.5% (18)California:
8.2% (1,547,056)
State government workers: Bluewater:
14.3% (6)California:
4.1% (780,915)
Employee of private company: Bluewater:
59.6% (31)California:
68.0% (10,009,465)
Local government workers: Bluewater:
5.8% (3)California:
8.3% (1,218,764)
Federal government workers: Bluewater:
17.3% (9)California:
2.3% (344,354)
Self-employed workers in own not incorporated business: Bluewater:
17.3% (9)California:
8.5% (1,249,530)
Employee of private company - Males: Bluewater:
46.7% (7)California:
70.3% (7,191,252)
Local government workers - Males: Bluewater:
53.3% (8)California:
6.0% (610,331)
Employee of private company - Females: Bluewater:
44.4% (12)California:
62.0% (5,404,778)
Local government workers - Females: Bluewater:
33.3% (9)California:
10.8% (936,725)
State government workers - Females: Bluewater:
22.2% (6)California:
5.0% (437,279)