Latest news about work in Bluff, UT collected exclusively by city-data.com from local newspapers, TV, and radio stations
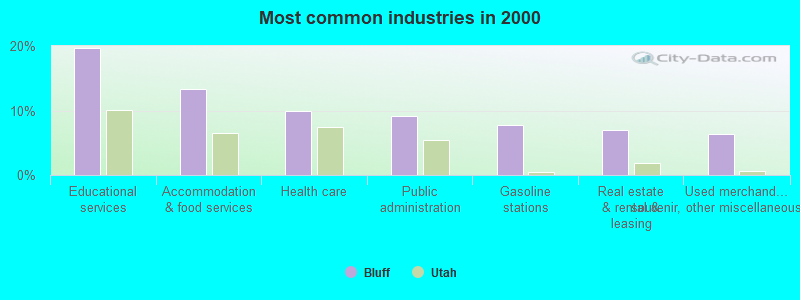
The most common industries in Bluff are: Educational services (19.7% of civilian employees), Accommodation & food services (13.4% of civilian employees), Health care (9.9% of civilian employees). 100.0% of workers work in San Juan County. 25.9% of workers are employees of private companies, which is 162.4% less than the rate of 68.0% across the entire state of Utah.
Whole page based on the data from 2000 / 2022 when the population of Bluff, Utah was 320 / 127
Most common industries
Most common industries
Industry
All
Males
Females
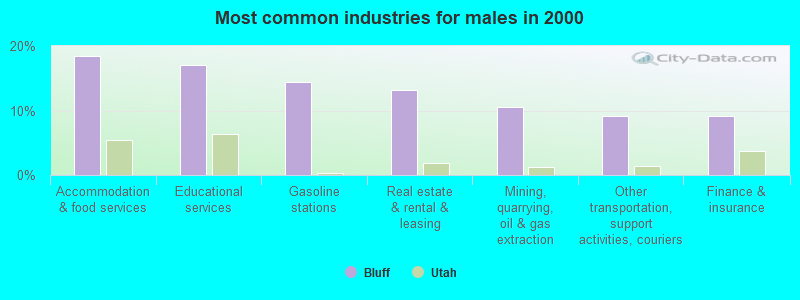
Educational services
19.7% (28)
17.1% (13)
22.7% (15)
Accommodation and food services
13.4% (19)
18.4% (14)
7.6% (5)
Health care
9.9% (14)
0.0% (0)
21.2% (14)
Public administration
9.2% (13)
0.0% (0)
19.7% (13)
Gasoline stations
7.7% (11)
14.5% (11)
0.0% (0)
Real estate and rental and leasing
7.0% (10)
13.2% (10)
0.0% (0)
Used merchandise, gift, novelty, and souvenir, and other miscellaneous stores
6.3% (9)
0.0% (0)
13.6% (9)
Mining, quarrying, and oil and gas extraction
5.6% (8)
10.5% (8)
0.0% (0)
Other transportation, and support activities, and couriers
4.9% (7)
9.2% (7)
0.0% (0)
Finance and insurance
4.9% (7)
9.2% (7)
0.0% (0)
Religious, grantmaking, civic, professional, and similar organizations
4.2% (6)
7.9% (6)
0.0% (0)
Construction
3.5% (5)
0.0% (0)
7.6% (5)
Professional, scientific, and technical services
3.5% (5)
0.0% (0)
7.6% (5)
Unemployment in Bluff
Unemployment by race in 2000
Unemployment rate for White non-Hispanic residents
11.9%Males
Unemployment rate for American Indian and Alaska Native residents
38.5%Males
Time leaving home to go to work
6:30 a.m. to 6:59 a.m.:
Bluff:
46.0% (13)
Utah:
8.3% (116,899)
7:00 a.m. to 7:29 a.m.:
Bluff:
25.6% (7)
Utah:
12.2% (171,911)
9:00 a.m. to 9:59 a.m.:
Bluff:
28.1% (8)
Utah:
7.9% (110,519)
6:30am:
Bluff:
5.6% (8)
Utah:
6.9% (71,407)
7am:
Bluff:
9.2% (13)
Utah:
9.6% (99,512)
7:30am:
Bluff:
21.1% (30)
Utah:
12.2% (126,423)
8am:
Bluff:
24.6% (35)
Utah:
14.5% (149,517)
8:30am:
Bluff:
3.5% (5)
Utah:
10.4% (107,893)
9am:
Bluff:
6.3% (9)
Utah:
5.7% (59,261)
4pm:
Bluff:
4.9% (7)
Utah:
8.5% (87,296)
9:00 a.m. to 9:59 a.m. - Males:
Bluff:
109.1% (8)
Utah:
6.7% (53,428)
6:30 a.m. to 6:59 a.m. - Females:
Bluff:
60.4% (12)
Utah:
6.8% (41,656)
7:00 a.m. to 7:29 a.m. - Females:
Bluff:
35.6% (7)
Utah:
12.2% (74,159)
Travel time to work
Percentage of workers working in this county: 100.0%
Less than 5 minutes:
Bluff:
23.2% (33)
Utah:
4.2% (43,896)
5 to 9 minutes:
Bluff:
14.1% (20)
Utah:
13.9% (143,317)
15 to 19 minutes:
Bluff:
11.3% (16)
Utah:
16.8% (173,076)
30 to 34 minutes:
Bluff:
18.3% (26)
Utah:
10.8% (111,752)
35 to 39 minutes:
Bluff:
4.9% (7)
Utah:
1.8% (18,540)
45 to 59 minutes:
Bluff:
3.5% (5)
Utah:
4.6% (47,093)
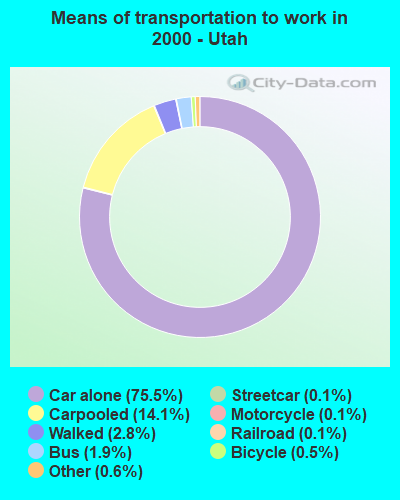
Means of transportation to work
Drove car alone:
Bluff:
47.9% (68)
Utah:
75.5% (779,438)
Carpooled:
Bluff:
4.9% (7)
Utah:
14.1% (145,950)
Walked:
Bluff:
16.9% (24)
Utah:
2.8% (28,523)
Other means:
Bluff:
5.6% (8)
Utah:
0.6% (5,862)
Private vehicle occupancy
Drove alone:
Bluff:
99.3% (13)
Utah:
87.1% (1,155,419)
Drove alone:
Bluff:
90.7% (68)
Utah:
84.2% (779,438)
In 2 person carpool:
Bluff:
9.3% (7)
Utah:
12.2% (112,575)
Class of workers
Employee of private company:
Bluff:
25.9% (7)
Utah:
68.0% (1,180,825)
State government workers:
Bluff:
74.1% (21)
Utah:
5.0% (86,212)
Employee of private company:
Bluff:
34.5% (49)
Utah:
68.0% (709,966)
Self-employed in own incorporated business:
Bluff:
7.7% (11)
Utah:
3.9% (40,428)
Private not-for-profit wage and salary workers:
Bluff:
9.2% (13)
Utah:
6.3% (66,081)
Local government workers:
Bluff:
14.8% (21)
Utah:
5.7% (59,805)
Federal government workers:
Bluff:
12.7% (18)
Utah:
3.6% (37,312)
Self-employed workers in own not incorporated business:
Bluff:
21.1% (30)
Utah:
5.8% (60,621)
Employee of private company - Males:
Bluff:
100.0% (7)
Utah:
71.9% (694,651)
State government workers - Females:
Bluff:
100.0% (21)
Utah:
6.0% (46,057)
Discuss Bluff, Utah (UT) on our hugely popular Utah forum.