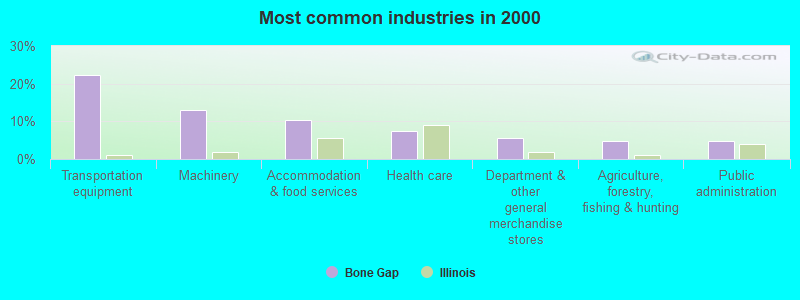
The most common industries in Bone Gap are: Transportation equipment (22.4% of civilian employees), Machinery (13.1% of civilian employees), Accommodation & food services (10.3% of civilian employees). 22.2% of workers work in Edwards County. 71.9% of workers are employees of private companies, which is 5.0% greater than the rate of 68.3% across the entire state of Illinois.
Whole page based on the data from 2000 / 2022 when the population of Bone Gap, Illinois was 272 / 195
Most common industries
Most common industries
Industry
All
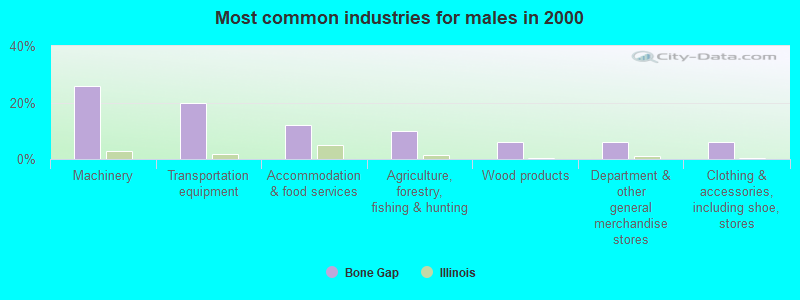
Males
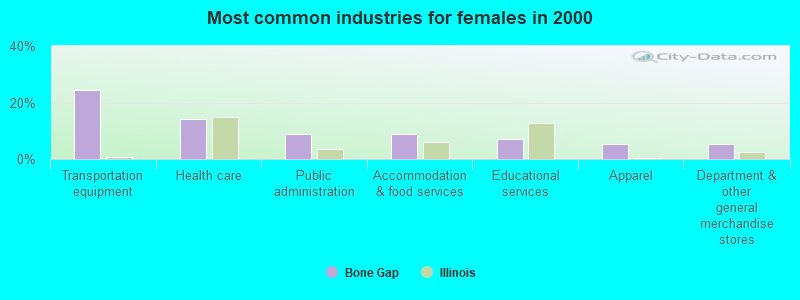
Females
Transportation equipment
22.4% (24)
20.0% (10)
24.6% (14)
Machinery
13.1% (14)
26.0% (13)
1.8% (1)
Accommodation and food services
10.3% (11)
12.0% (6)
8.8% (5)
Health care
7.5% (8)
0.0% (0)
14.0% (8)
Department and other general merchandise stores
5.6% (6)
6.0% (3)
5.3% (3)
Agriculture, forestry, fishing and hunting
4.7% (5)
10.0% (5)
0.0% (0)
Public administration
4.7% (5)
0.0% (0)
8.8% (5)
Truck transportation
4.7% (5)
6.0% (3)
3.5% (2)
Educational services
3.7% (4)
0.0% (0)
7.0% (4)
Apparel
2.8% (3)
0.0% (0)
5.3% (3)
Wood products
2.8% (3)
6.0% (3)
0.0% (0)
Clothing and accessories, including shoe, stores
2.8% (3)
6.0% (3)
0.0% (0)
Warehousing and storage
2.8% (3)
0.0% (0)
5.3% (3)
Construction
1.9% (2)
4.0% (2)
0.0% (0)
Motor vehicle and parts dealers
1.9% (2)
4.0% (2)
0.0% (0)
Nonmetallic mineral products
1.9% (2)
0.0% (0)
3.5% (2)
U. S. Postal service
1.9% (2)
0.0% (0)
3.5% (2)
Broadcasting and telecommunications
1.9% (2)
0.0% (0)
3.5% (2)
Personal and laundry services
1.9% (2)
0.0% (0)
3.5% (2)
Finance and insurance
0.9% (1)
0.0% (0)
1.8% (1)
Unemployment in Bone Gap
Unemployment by race in 2022
Unemployment rate for White non-Hispanic residents
4.2%Males
25.4%Females
Unemployment rate for two or more race residents
44.1%Males
100.0%Females
Unemployment by race in 2000
Unemployment rate for White non-Hispanic residents
16.7%Males
Time leaving home to go to work
12:00 a.m. to 4:59 a.m.:
Bone Gap:
17.6% (11)
Illinois:
6.0% (313,385)
5:00 a.m. to 5:29 a.m.:
Bone Gap:
3.2% (2)
Illinois:
4.3% (226,583)
5:30 a.m. to 5:59 a.m.:
Bone Gap:
3.1% (2)
Illinois:
4.9% (254,951)
6:00 a.m. to 6:29 a.m.:
Bone Gap:
7.6% (5)
Illinois:
8.9% (466,416)
6:30 a.m. to 6:59 a.m.:
Bone Gap:
15.3% (9)
Illinois:
9.3% (484,300)
7:00 a.m. to 7:29 a.m.:
Bone Gap:
1.6% (1)
Illinois:
14.3% (746,798)
7:30 a.m. to 7:59 a.m.:
Bone Gap:
12.6% (8)
Illinois:
11.5% (597,236)
8:00 a.m. to 8:29 a.m.:
Bone Gap:
6.5% (4)
Illinois:
11.2% (585,810)
8:30 a.m. to 8:59 a.m.:
Bone Gap:
1.6% (1)
Illinois:
5.2% (271,981)
9:00 a.m. to 9:59 a.m.:
Bone Gap:
8.1% (5)
Illinois:
6.0% (310,820)
12:00 p.m. to 3:59 p.m.:
Bone Gap:
6.2% (4)
Illinois:
7.6% (397,128)
4:00 p.m. to 11:59 p.m.:
Bone Gap:
17.0% (10)
Illinois:
6.3% (328,692)
<5am:
Bone Gap:
6.8% (7)
Illinois:
3.6% (205,429)
5:30am:
Bone Gap:
3.9% (4)
Illinois:
3.5% (199,483)
6am:
Bone Gap:
2.9% (3)
Illinois:
4.8% (274,395)
6:30am:
Bone Gap:
5.8% (6)
Illinois:
9.3% (532,224)
7am:
Bone Gap:
16.5% (17)
Illinois:
10.3% (593,196)
7:30am:
Bone Gap:
4.9% (5)
Illinois:
14.1% (808,399)
8am:
Bone Gap:
9.7% (10)
Illinois:
14.5% (834,444)
10am:
Bone Gap:
4.9% (5)
Illinois:
4.7% (269,854)
11am:
Bone Gap:
3.9% (4)
Illinois:
2.1% (118,418)
4pm:
Bone Gap:
19.4% (20)
Illinois:
7.4% (425,049)
>4pm:
Bone Gap:
13.6% (14)
Illinois:
6.8% (393,506)
12:00 a.m. to 4:59 a.m. - Males:
Bone Gap:
31.5% (11)
Illinois:
7.8% (217,984)
5:00 a.m. to 5:29 a.m. - Males:
Bone Gap:
5.8% (2)
Illinois:
5.9% (165,953)
6:00 a.m. to 6:29 a.m. - Males:
Bone Gap:
13.5% (5)
Illinois:
10.5% (292,003)
6:30 a.m. to 6:59 a.m. - Males:
Bone Gap:
8.3% (3)
Illinois:
9.4% (261,362)
8:00 a.m. to 8:29 a.m. - Males:
Bone Gap:
3.0% (1)
Illinois:
10.1% (280,890)
12:00 p.m. to 3:59 p.m. - Males:
Bone Gap:
11.5% (4)
Illinois:
8.0% (224,733)
4:00 p.m. to 11:59 p.m. - Males:
Bone Gap:
28.1% (9)
Illinois:
6.4% (179,820)
5:30 a.m. to 5:59 a.m. - Females:
Bone Gap:
6.7% (2)
Illinois:
3.5% (83,982)
6:30 a.m. to 6:59 a.m. - Females:
Bone Gap:
24.2% (6)
Illinois:
9.2% (222,938)
7:00 a.m. to 7:29 a.m. - Females:
Bone Gap:
3.7% (1)
Illinois:
16.0% (386,700)
7:30 a.m. to 7:59 a.m. - Females:
Bone Gap:
28.2% (8)
Illinois:
13.7% (331,772)
8:00 a.m. to 8:29 a.m. - Females:
Bone Gap:
10.9% (3)
Illinois:
12.6% (304,920)
8:30 a.m. to 8:59 a.m. - Females:
Bone Gap:
3.7% (1)
Illinois:
6.2% (149,881)
9:00 a.m. to 9:59 a.m. - Females:
Bone Gap:
18.6% (5)
Illinois:
7.0% (169,031)
4:00 p.m. to 11:59 p.m. - Females:
Bone Gap:
3.4% (1)
Illinois:
6.2% (148,872)
Travel time to work
Percentage of workers working in this county: 22.2%
Less than 5 minutes:
Bone Gap:
1.9% (2)
Illinois:
3.2% (183,600)
5 to 9 minutes:
Bone Gap:
1.9% (2)
Illinois:
10.2% (587,746)
10 to 14 minutes:
Bone Gap:
20.4% (21)
Illinois:
12.9% (743,149)
15 to 19 minutes:
Bone Gap:
24.3% (25)
Illinois:
13.0% (748,578)
20 to 24 minutes:
Bone Gap:
13.6% (14)
Illinois:
12.2% (703,743)
30 to 34 minutes:
Bone Gap:
6.8% (7)
Illinois:
12.9% (741,188)
45 to 59 minutes:
Bone Gap:
10.7% (11)
Illinois:
9.6% (551,290)
60 to 89 minutes:
Bone Gap:
10.7% (11)
Illinois:
7.5% (432,921)
90 or more minutes:
Bone Gap:
1.9% (2)
Illinois:
2.9% (168,793)
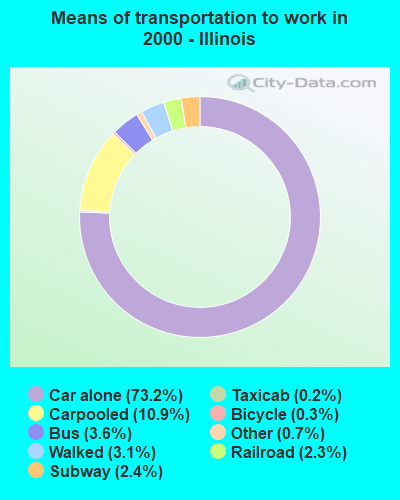
Means of transportation to work
Drove car alone:
Bone Gap:
64.1% (66)
Illinois:
73.2% (4,207,339)
Carpooled:
Bone Gap:
26.2% (27)
Illinois:
10.9% (625,411)
Walked:
Bone Gap:
1.9% (2)
Illinois:
3.1% (180,119)
Private vehicle occupancy
Drove alone:
Bone Gap:
96.2% (59)
Illinois:
89.3% (4,089,987)
In 2 person carpool:
Bone Gap:
3.3% (2)
Illinois:
7.9% (361,887)
Drove alone:
Bone Gap:
71.0% (66)
Illinois:
87.1% (4,207,339)
In 2 person carpool:
Bone Gap:
22.6% (21)
Illinois:
10.0% (484,652)
In 3 person carpool:
Bone Gap:
6.5% (6)
Illinois:
1.7% (84,139)
Class of workers
Employee of private company:
Bone Gap:
71.9% (46)
Illinois:
68.3% (4,298,982)
Private not-for-profit wage and salary workers:
Bone Gap:
6.2% (4)
Illinois:
9.5% (597,909)
Local government workers:
Bone Gap:
7.8% (5)
Illinois:
7.8% (491,805)
State government workers:
Bone Gap:
6.2% (4)
Illinois:
3.3% (207,590)
Federal government workers:
Bone Gap:
6.2% (4)
Illinois:
1.9% (122,680)
Self-employed workers in own not incorporated business:
Bone Gap:
1.6% (1)
Illinois:
4.7% (295,989)
Employee of private company:
Bone Gap:
76.6% (82)
Illinois:
70.3% (4,102,786)
Private not-for-profit wage and salary workers:
Bone Gap:
0.9% (1)
Illinois:
8.3% (484,163)
Local government workers:
Bone Gap:
7.5% (8)
Illinois:
6.8% (395,132)
State government workers:
Bone Gap:
1.9% (2)
Illinois:
3.8% (220,995)
Federal government workers:
Bone Gap:
4.7% (5)
Illinois:
2.1% (121,776)
Self-employed workers in own not incorporated business:
Bone Gap:
6.5% (7)
Illinois:
5.3% (307,691)
Unpaid family workers:
Bone Gap:
1.9% (2)
Illinois:
0.3% (15,661)
Employee of private company - Males:
Bone Gap:
77.8% (28)
Illinois:
72.3% (2,390,375)
Local government workers - Males:
Bone Gap:
11.1% (4)
Illinois:
5.9% (193,630)
Federal government workers - Males:
Bone Gap:
11.1% (4)
Illinois:
2.0% (64,842)
Employee of private company - Females:
Bone Gap:
64.3% (18)
Illinois:
63.9% (1,908,607)
Private not-for-profit wage and salary workers - Females:
Bone Gap:
14.3% (4)
Illinois:
13.1% (392,281)
Local government workers - Females:
Bone Gap:
3.6% (1)
Illinois:
10.0% (298,175)
State government workers - Females:
Bone Gap:
14.3% (4)
Illinois:
3.6% (108,656)
Self-employed workers in own not incorporated business - Females:
Bone Gap:
3.6% (1)
Illinois:
4.3% (128,324)
Discuss Bone Gap, Illinois (IL) on our hugely popular Illinois forum.