Work and Jobs in Colchester, Vermont (VT) Detailed Stats
Occupations, Industries, Unemployment, Workers, Commute

Recent posts about work in Colchester, Vermont on our local forum with over 2,400,000 registered users:
 | Gardener's Supply in Burlington (12 replies) |
| What the HELL is up with Vermont's insane property taxes???? (59 replies) |
| Lunch delivery in Colchester (1 reply) |
| Moving to Burlington, where to live? (49 replies) |
| Long Island to Burlington? (2 replies) |
| Colchester Questions (4 replies) |
Latest news about work in Colchester, VT collected exclusively by city-data.com from local newspapers, TV, and radio stations
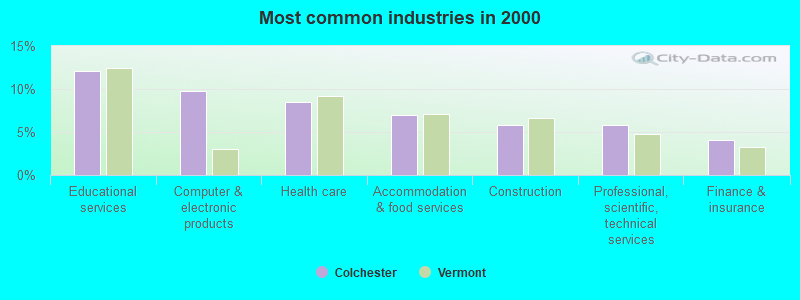
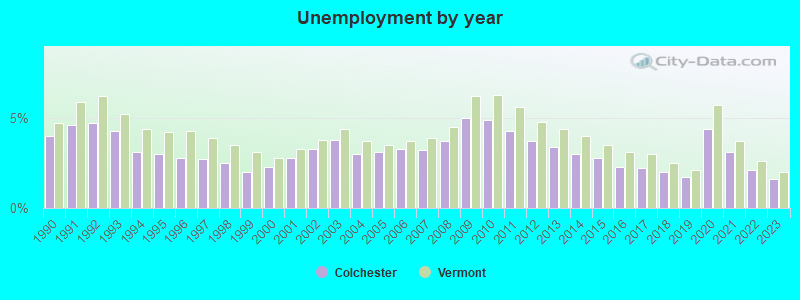
The unemployment rate in 2023 in Colchester, VT was 1.6%, which was 25.0% less than the unemployment rate of 2.0% across the entire state of Vermont. Compared to the unemployment rate of 3.4% in 2013, this represents a decrease of 112.5%. The most common industries in Colchester are: Educational services (12.1% of civilian employees), Computer & electronic products (9.8% of civilian employees), Health care (8.4% of civilian employees). 68.3% of workers are employees of private companies, which is 12.2% greater than the rate of 59.9% across the entire state of Vermont.
Most common industries

Most common industries | |||
|---|---|---|---|
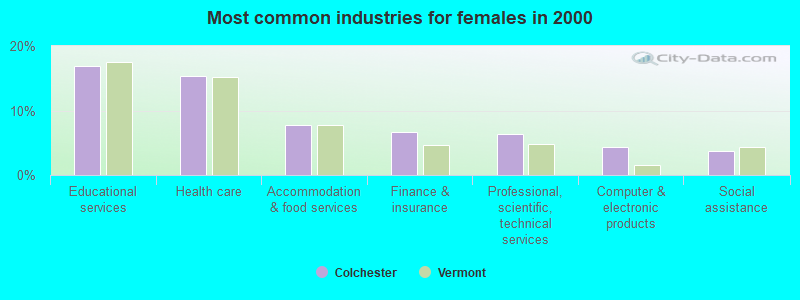
Industry | All | Males | Females |
| Educational services | 12.1% (1,169) | 8.0% (417) | 16.9% (752) |
| Computer and electronic products | 9.8% (942) | 14.4% (751) | 4.3% (191) |
| Health care | 8.4% (813) | 2.5% (131) | 15.4% (682) |
| Accommodation and food services | 7.0% (675) | 6.3% (328) | 7.8% (347) |
| Construction | 5.9% (565) | 9.6% (500) | 1.5% (65) |
| Professional, scientific, and technical services | 5.8% (561) | 5.4% (281) | 6.3% (280) |
| Finance and insurance | 4.0% (389) | 1.8% (93) | 6.7% (296) |
| Public administration | 3.5% (335) | 3.7% (190) | 3.3% (145) |
| Administrative and support and waste management services | 3.0% (292) | 2.6% (136) | 3.5% (156) |
| Social assistance | 2.3% (225) | 1.1% (57) | 3.8% (168) |
| Broadcasting and telecommunications | 2.3% (217) | 2.0% (106) | 2.5% (111) |
| Food and beverage stores | 2.1% (202) | 2.2% (112) | 2.0% (90) |
| Metal and metal products | 2.0% (196) | 2.9% (150) | 1.0% (46) |
| Other transportation, and support activities, and couriers | 1.7% (165) | 2.3% (121) | 1.0% (44) |
| Religious, grantmaking, civic, professional, and similar organizations | 1.7% (160) | 1.2% (62) | 2.2% (98) |
| Department and other general merchandise stores | 1.6% (150) | 1.2% (63) | 2.0% (87) |
| Repair and maintenance | 1.5% (145) | 2.7% (138) | 0.2% (7) |
| Machinery | 1.5% (142) | 1.7% (90) | 1.2% (52) |
| Miscellaneous manufacturing | 1.4% (132) | 1.4% (72) | 1.4% (60) |
| Motor vehicle and parts dealers | 1.3% (130) | 2.3% (122) | 0.2% (8) |
| Personal and laundry services | 1.3% (124) | 0.8% (43) | 1.8% (81) |
| Arts, entertainment, and recreation | 1.1% (105) | 1.4% (71) | 0.8% (34) |
| Building material and garden equipment and supplies dealers | 1.0% (101) | 1.4% (73) | 0.6% (28) |
| Electrical equipment, appliances, and components | 1.0% (95) | 1.1% (55) | 0.9% (40) |
| Real estate and rental and leasing | 0.9% (88) | 1.2% (64) | 0.5% (24) |
| Groceries and related products merchant wholesalers | 0.9% (88) | 1.4% (71) | 0.4% (17) |
| Publishing, and motion picture and sound recording industries | 0.9% (85) | 1.0% (54) | 0.7% (31) |
| Furniture and home furnishings, and household appliance stores | 0.8% (74) | 0.2% (10) | 1.4% (64) |
| U. S. Postal service | 0.7% (67) | 1.1% (59) | 0.2% (8) |
| Utilities | 0.7% (63) | 0.8% (40) | 0.5% (23) |
| Air transportation | 0.7% (63) | 1.0% (53) | 0.2% (10) |
| Printing and related support activities | 0.6% (59) | 1.1% (59) | 0.0% (0) |
| Machinery, equipment, and supplies merchant wholesalers | 0.5% (50) | 0.6% (31) | 0.4% (19) |
| Professional and commercial equipment and supplies merchant wholesalers | 0.5% (47) | 0.6% (30) | 0.4% (17) |
| Used merchandise, gift, novelty, and souvenir, and other miscellaneous stores | 0.5% (46) | 0.2% (9) | 0.8% (37) |
| Electronic shopping and mail-order houses | 0.4% (42) | 0.5% (25) | 0.4% (17) |
| Miscellaneous nondurable goods merchant wholesalers | 0.4% (41) | 0.6% (30) | 0.2% (11) |
| Chemicals | 0.4% (41) | 0.8% (41) | 0.0% (0) |
| Sporting goods, camera, and hobby and toy stores | 0.4% (40) | 0.5% (28) | 0.3% (12) |
| Furniture and related product manufacturing | 0.4% (40) | 0.6% (33) | 0.2% (7) |
| Truck transportation | 0.4% (39) | 0.7% (39) | 0.0% (0) |
| Radio, TV, and computer stores | 0.4% (39) | 0.7% (39) | 0.0% (0) |
| Hardware, plumbing and heating equipment, and supplies merchant wholesalers | 0.4% (38) | 0.7% (38) | 0.0% (0) |
| Other direct selling establishments | 0.4% (37) | 0.3% (14) | 0.5% (23) |
| Pharmacies and drug stores | 0.4% (36) | 0.0% (0) | 0.8% (36) |
| Transportation equipment | 0.4% (36) | 0.7% (36) | 0.0% (0) |
| Food | 0.4% (35) | 0.4% (21) | 0.3% (14) |
| Clothing and accessories, including shoe, stores | 0.3% (32) | 0.0% (0) | 0.7% (32) |
| Drugs, sundries, and chemical and allied products merchant wholesalers | 0.3% (28) | 0.4% (19) | 0.2% (9) |
| Plastics and rubber products | 0.3% (26) | 0.4% (19) | 0.2% (7) |
| Agriculture, forestry, fishing and hunting | 0.3% (25) | 0.2% (10) | 0.3% (15) |
| Private households | 0.3% (25) | 0.0% (0) | 0.6% (25) |
| Book stores and news dealers | 0.2% (24) | 0.5% (24) | 0.0% (0) |
| Vending machine operators | 0.2% (21) | 0.4% (21) | 0.0% (0) |
| Data processing, libraries, and other information services | 0.2% (20) | 0.0% (0) | 0.5% (20) |
| Apparel, fabrics, and notions merchant wholesalers | 0.2% (18) | 0.0% (0) | 0.4% (18) |
| Miscellaneous durable goods merchant wholesalers | 0.2% (18) | 0.2% (8) | 0.2% (10) |
| Electrical and electronic goods merchant wholesalers | 0.2% (16) | 0.3% (16) | 0.0% (0) |
| Gasoline stations | 0.1% (14) | 0.1% (6) | 0.2% (8) |
| Jewelry, luggage, and leather goods stores | 0.1% (14) | 0.0% (0) | 0.3% (14) |
| Alcoholic beverages merchant wholesalers | 0.1% (12) | 0.2% (12) | 0.0% (0) |
| Petroleum and coal products | 0.1% (12) | 0.2% (12) | 0.0% (0) |
| Management of companies and enterprises | 0.1% (11) | 0.0% (0) | 0.2% (11) |
| Health and personal care, except drug, stores | 0.1% (11) | 0.2% (11) | 0.0% (0) |
| Petroleum and petroleum products merchant wholesalers | 0.1% (9) | 0.2% (9) | 0.0% (0) |
| Beverage and tobacco products | 0.1% (9) | 0.2% (9) | 0.0% (0) |
| Music stores | 0.1% (9) | 0.2% (9) | 0.0% (0) |
| Water transportation | 0.1% (8) | 0.2% (8) | 0.0% (0) |
| Motor vehicles, parts and supplies merchant wholesalers | 0.1% (8) | 0.2% (8) | 0.0% (0) |
| Retail florists | 0.1% (8) | 0.2% (8) | 0.0% (0) |
| Textile mills and textile products | 0.1% (6) | 0.1% (6) | 0.0% (0) |
Unemployment in Colchester
- Unemployment by race in 2000
- Unemployment rate for White non-Hispanic residents
- 6.4%Males
- 5.7%Females
- Unemployment rate for Asian residents
- 53.3%Males
- 29.8%Females
- Unemployment rate for Hispanic or Latino residents
- 11.0%Males
Unemployment in 2023:
| Colchester: | 1.6% |
| Vermont: | 2.0% |
Unemployment in 2022:
| Colchester: | 2.1% |
| Vermont: | 2.6% |
Unemployment in 2021:
| Colchester: | 3.1% |
| Vermont: | 3.7% |
Unemployment in 2020:
| Colchester: | 4.4% |
| Vermont: | 5.7% |
Unemployment in 2019:
| Colchester: | 1.7% |
| Vermont: | 2.1% |
Unemployment in 2018:
| Colchester: | 2.0% |
| Vermont: | 2.5% |
Unemployment in 2017:
| Colchester: | 2.2% |
| Vermont: | 3.0% |
Unemployment in 2016:
| Colchester: | 2.3% |
| Vermont: | 3.1% |
Unemployment in 2015:
| Colchester: | 2.8% |
| Vermont: | 3.5% |
Unemployment in 2014:
| Colchester: | 3.0% |
| Vermont: | 4.0% |
Unemployment in 2013:
| Colchester: | 3.4% |
| Vermont: | 4.4% |
Unemployment in 2012:
| Colchester: | 3.7% |
| Vermont: | 4.8% |
Unemployment in 2011:
| Colchester: | 4.3% |
| Vermont: | 5.6% |
Unemployment in 2010:
| Colchester: | 4.9% |
| Vermont: | 6.3% |
Unemployment in 2009:
| Colchester: | 5.0% |
| Vermont: | 6.2% |
Unemployment in 2008:
| Colchester: | 3.7% |
| Vermont: | 4.5% |
Unemployment in 2007:
| Colchester: | 3.2% |
| Vermont: | 3.9% |
Unemployment in 2006:
| Colchester: | 3.3% |
| Vermont: | 3.7% |
Unemployment in 2005:
| Colchester: | 3.1% |
| Vermont: | 3.5% |
Unemployment in 2004:
| Colchester: | 3.0% |
| Vermont: | 3.7% |
Unemployment in 2003:
| Colchester: | 3.8% |
| Vermont: | 4.4% |
Unemployment in 2002:
| Colchester: | 3.3% |
| Vermont: | 3.8% |
Unemployment in 2001:
| Colchester: | 2.8% |
| Vermont: | 3.3% |
Unemployment in 2000:
| Colchester: | 2.3% |
| Vermont: | 2.8% |
Unemployment in 1999:
| Colchester: | 2.0% |
| Vermont: | 3.1% |
Unemployment in 1998:
| Colchester: | 2.5% |
| Vermont: | 3.5% |
Unemployment in 1997:
| Colchester: | 2.7% |
| Vermont: | 3.9% |
Unemployment in 1996:
| Colchester: | 2.8% |
| Vermont: | 4.3% |
Unemployment in 1995:
| Colchester: | 3.0% |
| Vermont: | 4.2% |
Unemployment in 1994:
| Colchester: | 3.1% |
| Vermont: | 4.4% |
Unemployment in 1993:
| Colchester: | 4.3% |
| Vermont: | 5.2% |
Unemployment in 1992:
| Colchester: | 4.7% |
| Vermont: | 6.2% |
Unemployment in 1991:
| Colchester: | 4.6% |
| Vermont: | 5.9% |
Unemployment in 1990:
| Colchester: | 4.0% |
| Vermont: | 4.7% |
Time leaving home to go to work

<5am:
| Colchester: | 2.4% (234) |
| Vermont: | 3.1% (9,660) |
5:30am:
| Colchester: | 1.2% (118) |
| Vermont: | 2.4% (7,330) |
6am:
| Colchester: | 4.1% (390) |
| Vermont: | 4.0% (12,509) |
6:30am:
| Colchester: | 7.6% (723) |
| Vermont: | 7.8% (24,450) |
7am:
| Colchester: | 13.5% (1,288) |
| Vermont: | 11.1% (34,572) |
7:30am:
| Colchester: | 12.8% (1,226) |
| Vermont: | 14.8% (46,249) |
8am:
| Colchester: | 16.9% (1,619) |
| Vermont: | 16.2% (50,397) |
8:30am:
| Colchester: | 10.9% (1,044) |
| Vermont: | 10.7% (33,273) |
9am:
| Colchester: | 5.3% (504) |
| Vermont: | 4.7% (14,526) |
10am:
| Colchester: | 5.9% (564) |
| Vermont: | 4.6% (14,385) |
11am:
| Colchester: | 1.8% (177) |
| Vermont: | 1.8% (5,484) |
12pm:
| Colchester: | 0.8% (79) |
| Vermont: | 0.9% (2,823) |
4pm:
| Colchester: | 5.8% (555) |
| Vermont: | 6.7% (20,897) |
>4pm:
| Colchester: | 7.7% (738) |
| Vermont: | 5.7% (17,633) |
Travel time to work


Less than 5 minutes:
| Colchester: | 2.5% (235) |
| Vermont: | 5.8% (18,209) |
5 to 9 minutes:
| Colchester: | 10.0% (960) |
| Vermont: | 14.2% (44,253) |
10 to 14 minutes:
| Colchester: | 14.9% (1,430) |
| Vermont: | 16.1% (50,133) |
15 to 19 minutes:
| Colchester: | 24.3% (2,325) |
| Vermont: | 14.9% (46,609) |
20 to 24 minutes:
| Colchester: | 23.0% (2,197) |
| Vermont: | 12.8% (39,922) |
25 to 29 minutes:
| Colchester: | 7.3% (700) |
| Vermont: | 5.4% (16,919) |
30 to 34 minutes:
| Colchester: | 7.8% (746) |
| Vermont: | 10.1% (31,641) |
35 to 39 minutes:
| Colchester: | 0.9% (85) |
| Vermont: | 2.2% (6,974) |
40 to 44 minutes:
| Colchester: | 1.4% (130) |
| Vermont: | 2.7% (8,296) |
45 to 59 minutes:
| Colchester: | 1.7% (160) |
| Vermont: | 5.3% (16,427) |
60 to 89 minutes:
| Colchester: | 1.7% (165) |
| Vermont: | 2.9% (9,137) |
90 or more minutes:
| Colchester: | 1.3% (126) |
| Vermont: | 1.8% (5,668) |
Means of transportation to work

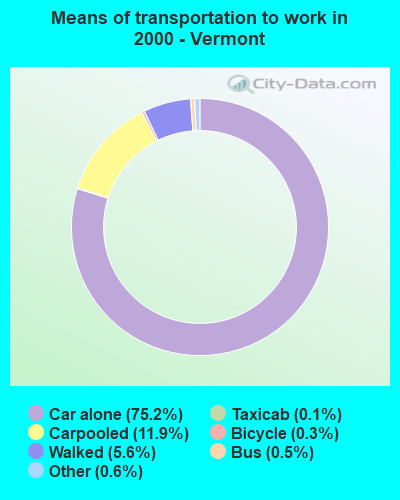
Drove car alone:
| Colchester: | 81.7% (7,821) |
| Vermont: | 75.2% (234,388) |
Carpooled:
| Colchester: | 9.7% (929) |
| Vermont: | 11.9% (37,191) |
Bus or trolley bus:
| Colchester: | 0.3% (27) |
| Vermont: | 0.5% (1,569) |
Bicycle:
| Colchester: | 0.3% (33) |
| Vermont: | 0.3% (977) |
Walked:
| Colchester: | 4.6% (443) |
| Vermont: | 5.6% (17,554) |
Other means:
| Colchester: | 0.1% (6) |
| Vermont: | 0.6% (1,734) |
Private vehicle occupancy

Drove alone:
| Colchester: | 89.4% (7,821) |
| Vermont: | 86.3% (234,388) |
In 2 person carpool:
| Colchester: | 9.7% (848) |
| Vermont: | 11.4% (30,882) |
In 3 person carpool:
| Colchester: | 0.5% (47) |
| Vermont: | 1.6% (4,340) |
In 4 person carpool:
| Colchester: | 0.2% (17) |
| Vermont: | 0.5% (1,230) |
In 5-6 person carpool:
| Colchester: | 0.2% (17) |
| Vermont: | 0.2% (441) |
Class of workers

Employee of private company:
| Colchester: | 68.3% (6,582) |
| Vermont: | 59.9% (189,982) |
Self-employed in own incorporated business:
| Colchester: | 2.8% (269) |
| Vermont: | 3.8% (12,027) |
Private not-for-profit wage and salary workers:
| Colchester: | 12.5% (1,201) |
| Vermont: | 11.6% (36,669) |
Local government workers:
| Colchester: | 6.1% (591) |
| Vermont: | 7.6% (24,003) |
State government workers:
| Colchester: | 2.5% (243) |
| Vermont: | 4.3% (13,652) |
Federal government workers:
| Colchester: | 1.8% (178) |
| Vermont: | 2.3% (7,355) |
Self-employed workers in own not incorporated business:
| Colchester: | 5.9% (571) |
| Vermont: | 10.3% (32,546) |
Unpaid family workers:
| Colchester: | 0.1% (7) |
| Vermont: | 0.3% (900) |

Employee of private company - Males:
| Colchester: | 72.9% (3,791) |
| Vermont: | 64.5% (106,173) |
Self-employed in own incorporated business - Males:
| Colchester: | 3.3% (173) |
| Vermont: | 5.2% (8,594) |
Private not-for-profit wage and salary workers - Males:
| Colchester: | 7.7% (402) |
| Vermont: | 6.8% (11,234) |
Local government workers - Males:
| Colchester: | 4.7% (244) |
| Vermont: | 5.0% (8,286) |
State government workers - Males:
| Colchester: | 2.6% (133) |
| Vermont: | 3.9% (6,384) |
Federal government workers - Males:
| Colchester: | 2.1% (109) |
| Vermont: | 2.3% (3,707) |
Self-employed workers in own not incorporated business - Males:
| Colchester: | 6.7% (349) |
| Vermont: | 12.1% (19,879) |

Employee of private company - Females:
| Colchester: | 62.8% (2,791) |
| Vermont: | 55.0% (83,809) |
Self-employed in own incorporated business - Females:
| Colchester: | 2.2% (96) |
| Vermont: | 2.3% (3,433) |
Private not-for-profit wage and salary workers - Females:
| Colchester: | 18.0% (799) |
| Vermont: | 16.7% (25,435) |
Local government workers - Females:
| Colchester: | 7.8% (347) |
| Vermont: | 10.3% (15,717) |
State government workers - Females:
| Colchester: | 2.5% (110) |
| Vermont: | 4.8% (7,268) |
Federal government workers - Females:
| Colchester: | 1.6% (69) |
| Vermont: | 2.4% (3,648) |
Self-employed workers in own not incorporated business - Females:
| Colchester: | 5.0% (222) |
| Vermont: | 8.3% (12,667) |
Unpaid family workers - Females:
| Colchester: | 0.2% (7) |
| Vermont: | 0.3% (520) |