Work and Jobs in Fort Benning, Georgia (GA) Detailed Stats
Occupations, Industries, Unemployment, Workers, Commute
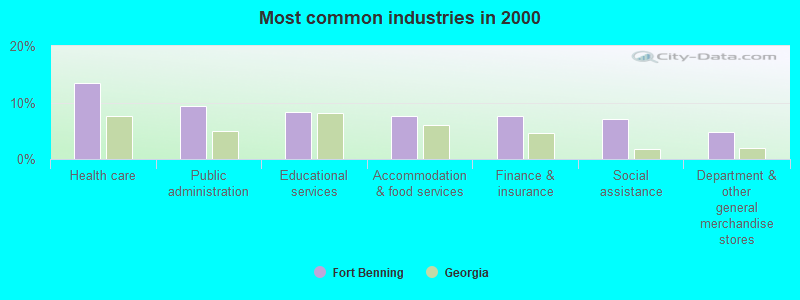
The most common industries in Fort Benning are: Health care (13.5% of civilian employees), Public administration (9.4% of civilian employees), Educational services (8.4% of civilian employees). 58.9% of workers are employees of private companies, which is 19.7% less than the rate of 70.5% across the entire state of Georgia.
Most common industries
Most common industries | |||
|---|---|---|---|
Industry | All | Males | Females |
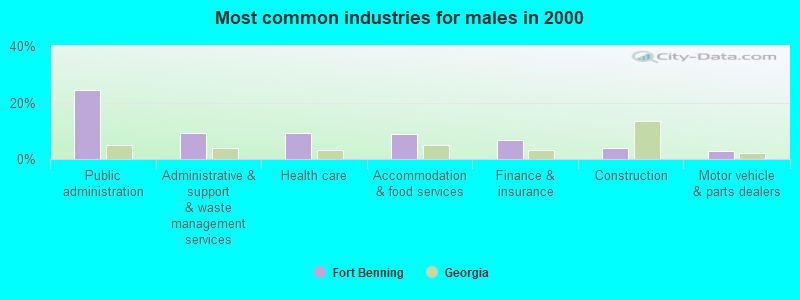
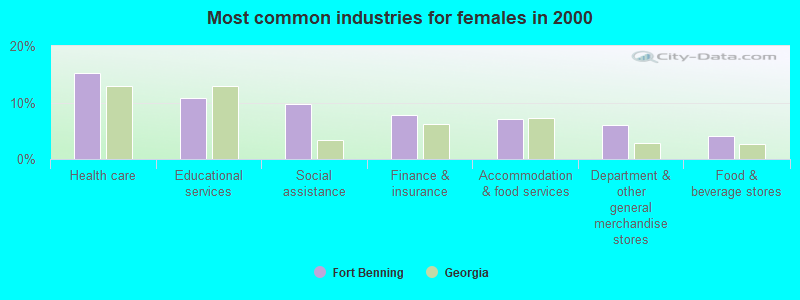
| Health care | 13.5% (155) | 9.3% (30) | 15.1% (125) |
| Public administration | 9.4% (108) | 24.5% (79) | 3.5% (29) |
| Educational services | 8.4% (96) | 2.2% (7) | 10.8% (89) |
| Accommodation and food services | 7.7% (88) | 9.0% (29) | 7.1% (59) |
| Finance and insurance | 7.6% (87) | 6.8% (22) | 7.9% (65) |
| Social assistance | 7.1% (81) | 0.0% (0) | 9.8% (81) |
| Department and other general merchandise stores | 4.7% (54) | 1.2% (4) | 6.1% (50) |
| Administrative and support and waste management services | 3.7% (42) | 9.3% (30) | 1.5% (12) |
| Food and beverage stores | 3.3% (38) | 1.2% (4) | 4.1% (34) |
| Motor vehicle and parts dealers | 2.7% (31) | 2.8% (9) | 2.7% (22) |
| Other direct selling establishments | 2.5% (29) | 1.6% (5) | 2.9% (24) |
| Professional, scientific, and technical services | 2.3% (26) | 2.2% (7) | 2.3% (19) |
| Broadcasting and telecommunications | 2.3% (26) | 2.2% (7) | 2.3% (19) |
| Religious, grantmaking, civic, professional, and similar organizations | 2.1% (24) | 0.0% (0) | 2.9% (24) |
| Agriculture, forestry, fishing and hunting | 1.5% (17) | 1.9% (6) | 1.3% (11) |
| Miscellaneous manufacturing | 1.3% (15) | 0.0% (0) | 1.8% (15) |
| Data processing, libraries, and other information services | 1.2% (14) | 0.0% (0) | 1.7% (14) |
| Construction | 1.1% (13) | 4.0% (13) | 0.0% (0) |
| Real estate and rental and leasing | 1.1% (13) | 2.5% (8) | 0.6% (5) |
| Used merchandise, gift, novelty, and souvenir, and other miscellaneous stores | 1.1% (13) | 1.9% (6) | 0.8% (7) |
| Transportation equipment | 1.1% (13) | 0.0% (0) | 1.6% (13) |
| Sporting goods, camera, and hobby and toy stores | 1.0% (12) | 1.9% (6) | 0.7% (6) |
| Health and personal care, except drug, stores | 1.0% (12) | 0.0% (0) | 1.5% (12) |
| Chemicals | 0.9% (10) | 0.0% (0) | 1.2% (10) |
| Textile mills and textile products | 0.8% (9) | 0.0% (0) | 1.1% (9) |
| Miscellaneous nondurable goods merchant wholesalers | 0.8% (9) | 0.0% (0) | 1.1% (9) |
| Truck transportation | 0.7% (8) | 2.5% (8) | 0.0% (0) |
| Wood products | 0.6% (7) | 2.2% (7) | 0.0% (0) |
| Electrical and electronic goods merchant wholesalers | 0.6% (7) | 2.2% (7) | 0.0% (0) |
| Electrical equipment, appliances, and components | 0.5% (6) | 0.0% (0) | 0.7% (6) |
| Hardware, plumbing and heating equipment, and supplies merchant wholesalers | 0.5% (6) | 1.9% (6) | 0.0% (0) |
| Beverage and tobacco products | 0.5% (6) | 0.0% (0) | 0.7% (6) |
| Radio, TV, and computer stores | 0.5% (6) | 0.0% (0) | 0.7% (6) |
| Drugs, sundries, and chemical and allied products merchant wholesalers | 0.5% (6) | 0.0% (0) | 0.7% (6) |
| Jewelry, luggage, and leather goods stores | 0.5% (6) | 0.0% (0) | 0.7% (6) |
| Music stores | 0.5% (6) | 0.0% (0) | 0.7% (6) |
| Plastics and rubber products | 0.5% (6) | 1.9% (6) | 0.0% (0) |
| Nonmetallic mineral products | 0.5% (6) | 1.9% (6) | 0.0% (0) |
| Water transportation | 0.5% (6) | 0.0% (0) | 0.7% (6) |
| Arts, entertainment, and recreation | 0.5% (6) | 0.0% (0) | 0.7% (6) |
| Repair and maintenance | 0.5% (6) | 1.9% (6) | 0.0% (0) |
| Miscellaneous durable goods merchant wholesalers | 0.4% (5) | 0.0% (0) | 0.6% (5) |
| Clothing and accessories, including shoe, stores | 0.4% (5) | 0.0% (0) | 0.6% (5) |
| Personal and laundry services | 0.4% (5) | 0.0% (0) | 0.6% (5) |
| Publishing, and motion picture and sound recording industries | 0.3% (4) | 1.2% (4) | 0.0% (0) |
Unemployment in Fort Benning
- Unemployment by race in 2000
- Unemployment rate for White non-Hispanic residents
- 4.0%Males
- 8.8%Females
- Unemployment rate for Black residents
- 7.1%Males
- 10.5%Females
- Unemployment rate for American Indian and Alaska Native residents
- 20.0%Females
- Unemployment rate for other race residents
- 23.3%Females
- Unemployment rate for Hispanic or Latino residents
- 16.7%Males
- 25.2%Females
Time leaving home to go to work

<5am:
| Fort Benning: | 8.1% (597) |
| Georgia: | 2.8% (108,019) |
5:30am:
| Fort Benning: | 11.2% (825) |
| Georgia: | 2.7% (102,302) |
6am:
| Fort Benning: | 21.1% (1,552) |
| Georgia: | 4.1% (156,682) |
6:30am:
| Fort Benning: | 18.1% (1,326) |
| Georgia: | 9.0% (343,349) |
7am:
| Fort Benning: | 3.7% (270) |
| Georgia: | 11.0% (422,728) |
7:30am:
| Fort Benning: | 2.6% (194) |
| Georgia: | 15.9% (608,777) |
8am:
| Fort Benning: | 4.3% (316) |
| Georgia: | 15.9% (610,869) |
8:30am:
| Fort Benning: | 4.7% (342) |
| Georgia: | 10.2% (391,849) |
9am:
| Fort Benning: | 9.7% (712) |
| Georgia: | 4.9% (187,692) |
10am:
| Fort Benning: | 3.5% (259) |
| Georgia: | 5.3% (204,205) |
11am:
| Fort Benning: | 0.9% (64) |
| Georgia: | 2.1% (79,927) |
12pm:
| Fort Benning: | 0.1% (4) |
| Georgia: | 0.9% (34,761) |
4pm:
| Fort Benning: | 1.6% (114) |
| Georgia: | 5.7% (219,434) |
>4pm:
| Fort Benning: | 4.4% (321) |
| Georgia: | 6.6% (253,223) |
Travel time to work


Less than 5 minutes:
| Fort Benning: | 19.6% (1,438) |
| Georgia: | 2.4% (93,446) |
5 to 9 minutes:
| Fort Benning: | 25.7% (1,889) |
| Georgia: | 8.7% (334,403) |
10 to 14 minutes:
| Fort Benning: | 20.0% (1,471) |
| Georgia: | 13.3% (511,628) |
15 to 19 minutes:
| Fort Benning: | 13.0% (954) |
| Georgia: | 15.2% (583,820) |
20 to 24 minutes:
| Fort Benning: | 6.8% (496) |
| Georgia: | 13.6% (519,875) |
25 to 29 minutes:
| Fort Benning: | 3.0% (223) |
| Georgia: | 5.5% (209,374) |
30 to 34 minutes:
| Fort Benning: | 2.9% (212) |
| Georgia: | 14.0% (535,531) |
35 to 39 minutes:
| Fort Benning: | 0.4% (26) |
| Georgia: | 2.8% (108,867) |
45 to 59 minutes:
| Fort Benning: | 0.6% (46) |
| Georgia: | 9.1% (347,610) |
60 to 89 minutes:
| Fort Benning: | 0.6% (47) |
| Georgia: | 6.1% (234,588) |
90 or more minutes:
| Fort Benning: | 1.3% (94) |
| Georgia: | 2.9% (112,554) |
Means of transportation to work

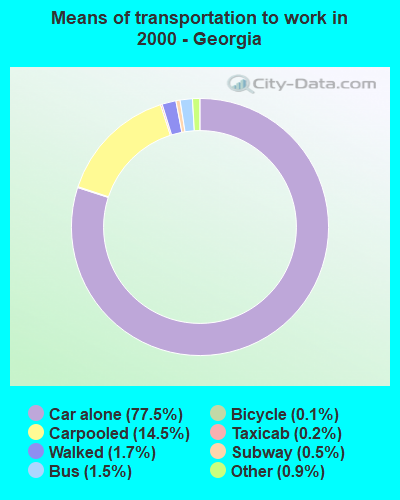
Drove car alone:
| Fort Benning: | 48.1% (3,528) |
| Georgia: | 77.5% (2,968,910) |
Carpooled:
| Fort Benning: | 13.4% (987) |
| Georgia: | 14.5% (557,062) |
Bus or trolley bus:
| Fort Benning: | 0.6% (45) |
| Georgia: | 1.5% (59,355) |
Motorcycle:
| Fort Benning: | 0.3% (25) |
| Georgia: | 0.1% (3,055) |
Bicycle:
| Fort Benning: | 0.2% (17) |
| Georgia: | 0.1% (5,588) |
Walked:
| Fort Benning: | 28.7% (2,106) |
| Georgia: | 1.7% (65,776) |
Other means:
| Fort Benning: | 2.6% (188) |
| Georgia: | 0.9% (33,396) |
Private vehicle occupancy

Drove alone:
| Fort Benning: | 78.1% (3,528) |
| Georgia: | 84.2% (2,968,910) |
In 2 person carpool:
| Fort Benning: | 15.2% (687) |
| Georgia: | 11.5% (406,954) |
In 3 person carpool:
| Fort Benning: | 4.5% (205) |
| Georgia: | 2.5% (87,725) |
In 4 person carpool:
| Fort Benning: | 1.1% (48) |
| Georgia: | 1.0% (34,505) |
In 5-6 person carpool:
| Fort Benning: | 0.4% (20) |
| Georgia: | 0.5% (18,718) |
In 7+ person carpool:
| Fort Benning: | 0.6% (27) |
| Georgia: | 0.3% (9,160) |
Class of workers
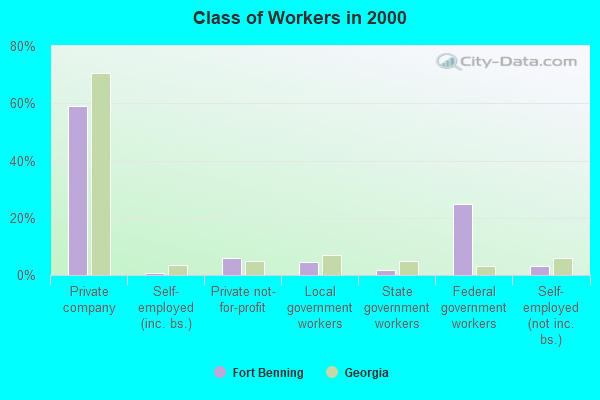
Employee of private company:
| Fort Benning: | 58.9% (676) |
| Georgia: | 70.5% (2,705,775) |
Self-employed in own incorporated business:
| Fort Benning: | 0.7% (8) |
| Georgia: | 3.6% (137,778) |
Private not-for-profit wage and salary workers:
| Fort Benning: | 6.1% (70) |
| Georgia: | 4.8% (185,815) |
Local government workers:
| Fort Benning: | 4.6% (53) |
| Georgia: | 6.9% (265,340) |
State government workers:
| Fort Benning: | 1.7% (19) |
| Georgia: | 5.0% (190,664) |
Federal government workers:
| Fort Benning: | 24.9% (286) |
| Georgia: | 3.1% (118,038) |
Self-employed workers in own not incorporated business:
| Fort Benning: | 3.1% (36) |
| Georgia: | 5.9% (226,595) |

Employee of private company - Males:
| Fort Benning: | 50.0% (161) |
| Georgia: | 73.4% (1,505,132) |
Private not-for-profit wage and salary workers - Males:
| Fort Benning: | 3.7% (12) |
| Georgia: | 3.0% (62,400) |
Local government workers - Males:
| Fort Benning: | 2.8% (9) |
| Georgia: | 4.9% (99,702) |
Federal government workers - Males:
| Fort Benning: | 43.5% (140) |
| Georgia: | 3.0% (61,555) |

Employee of private company - Females:
| Fort Benning: | 62.3% (515) |
| Georgia: | 67.1% (1,200,643) |
Self-employed in own incorporated business - Females:
| Fort Benning: | 1.0% (8) |
| Georgia: | 2.1% (37,390) |
Private not-for-profit wage and salary workers - Females:
| Fort Benning: | 7.0% (58) |
| Georgia: | 6.9% (123,415) |
Local government workers - Females:
| Fort Benning: | 5.3% (44) |
| Georgia: | 9.3% (165,638) |
State government workers - Females:
| Fort Benning: | 2.3% (19) |
| Georgia: | 6.8% (120,999) |
Federal government workers - Females:
| Fort Benning: | 17.7% (146) |
| Georgia: | 3.2% (56,483) |
Self-employed workers in own not incorporated business - Females:
| Fort Benning: | 4.4% (36) |
| Georgia: | 4.4% (78,566) |