Work and Jobs in Kernville, California (CA) Detailed Stats
Occupations, Industries, Unemployment, Workers, Commute
Settings
X


Recent posts about work in Kernville, California on our local forum with over 2,400,000 registered users:
 | Sacramento vs. Bakersfield (110 replies) |
| Interested techy thinking about buying in Bakersfield or other Central Valley city... (81 replies) |
| Tell me about the desert area of Kern County! (79 replies) |
| Young couple in their 30s leaving Illinois and looking for mountains (44 replies) |
| Lake Isabella area livability? (4 replies) |
| California Small Town Retirement...with good schools (6 replies) |
Latest news about work in Kernville, CA collected exclusively by city-data.com from local newspapers, TV, and radio stations
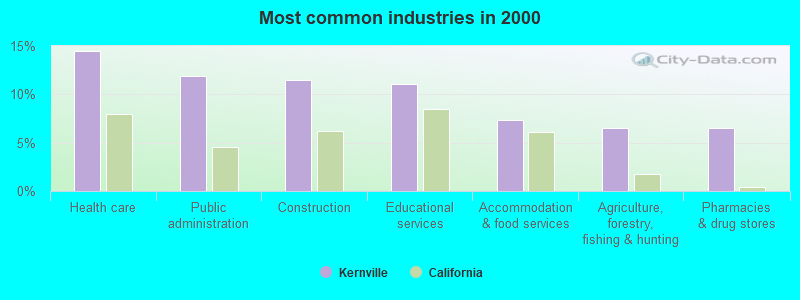
The most common industries in Kernville are: Health care (14.5% of civilian employees), Public administration (11.9% of civilian employees), Construction (11.5% of civilian employees). 78.7% of workers work in Kern County and 11.7% of all workers work at home. 52.0% of workers are employees of private companies, which is 28.0% less than the rate of 66.5% across the entire state of California.
Whole page based on the data from 2000 / 2022 when the population of Kernville, California was 1,736 / 845
Whole page based on the data from 2000 / 2022 when the population of Kernville, California was 1,736 / 845
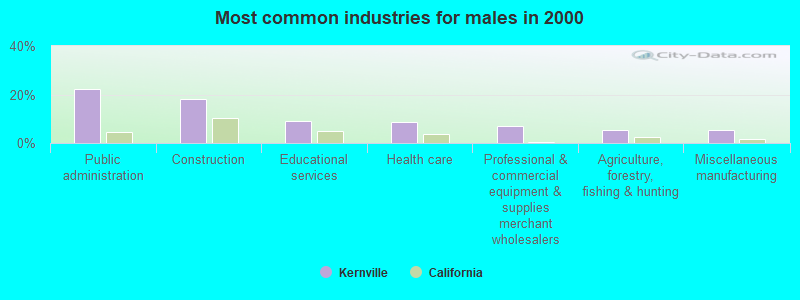
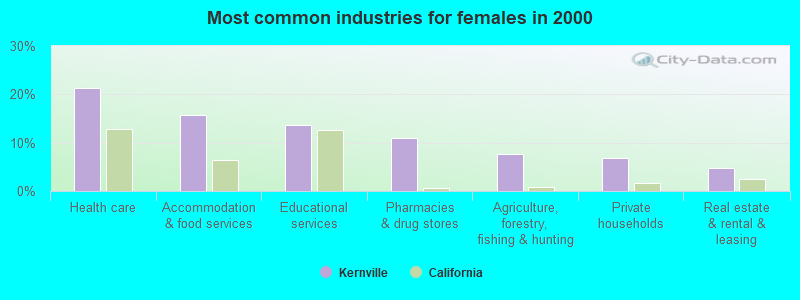
Most common industries
Most common industries | |||
|---|---|---|---|
Industry | All | Males | Females |
| Health care | 14.5% (73) | 8.5% (23) | 21.3% (50) |
| Public administration | 11.9% (60) | 22.2% (60) | 0.0% (0) |
| Construction | 11.5% (58) | 18.1% (49) | 3.8% (9) |
| Educational services | 11.1% (56) | 8.9% (24) | 13.6% (32) |
| Accommodation and food services | 7.3% (37) | 0.0% (0) | 15.7% (37) |
| Agriculture, forestry, fishing and hunting | 6.5% (33) | 5.6% (15) | 7.7% (18) |
| Pharmacies and drug stores | 6.5% (33) | 2.6% (7) | 11.1% (26) |
| Real estate and rental and leasing | 4.4% (22) | 4.1% (11) | 4.7% (11) |
| Repair and maintenance | 4.0% (20) | 3.7% (10) | 4.3% (10) |
| Professional and commercial equipment and supplies merchant wholesalers | 3.8% (19) | 7.0% (19) | 0.0% (0) |
| Private households | 3.2% (16) | 0.0% (0) | 6.8% (16) |
| Miscellaneous manufacturing | 2.8% (14) | 5.2% (14) | 0.0% (0) |
| Machinery, equipment, and supplies merchant wholesalers | 2.4% (12) | 4.4% (12) | 0.0% (0) |
| Motor vehicle and parts dealers | 2.2% (11) | 4.1% (11) | 0.0% (0) |
| Personal and laundry services | 2.2% (11) | 0.0% (0) | 4.7% (11) |
| Used merchandise, gift, novelty, and souvenir, and other miscellaneous stores | 2.0% (10) | 0.0% (0) | 4.3% (10) |
| Metal and metal products | 1.6% (8) | 3.0% (8) | 0.0% (0) |
| Religious, grantmaking, civic, professional, and similar organizations | 1.4% (7) | 2.6% (7) | 0.0% (0) |
| Food and beverage stores | 1.0% (5) | 0.0% (0) | 2.1% (5) |
Unemployment in Kernville
- Unemployment by race in 2022
- Unemployment rate for White non-Hispanic residents
- 21.2%Females
- Unemployment rate for Black residents
- 100.0%Males
- Unemployment by race in 2000
- Unemployment rate for White non-Hispanic residents
- 5.4%Males
- 7.4%Females
Time leaving home to go to work

12:00 a.m. to 4:59 a.m.:
| Kernville: | 26.1% (47) |
| California: | 6.8% (1,050,902) |
7:00 a.m. to 7:29 a.m.:
| Kernville: | 21.9% (39) |
| California: | 13.2% (2,027,702) |
7:30 a.m. to 7:59 a.m.:
| Kernville: | 34.1% (61) |
| California: | 10.1% (1,550,402) |
9:00 a.m. to 9:59 a.m.:
| Kernville: | 5.1% (9) |
| California: | 8.4% (1,288,499) |
11:00 a.m. to 11:59 a.m.:
| Kernville: | 11.7% (21) |
| California: | 1.8% (280,975) |

<5am:
| Kernville: | 1.9% (9) |
| California: | 4.2% (606,086) |
5:30am:
| Kernville: | 1.7% (8) |
| California: | 3.6% (523,209) |
6am:
| Kernville: | 12.1% (58) |
| California: | 4.8% (692,256) |
6:30am:
| Kernville: | 3.3% (16) |
| California: | 8.4% (1,216,867) |
7am:
| Kernville: | 5.6% (27) |
| California: | 9.4% (1,362,830) |
7:30am:
| Kernville: | 12.3% (59) |
| California: | 13.8% (2,006,950) |
8am:
| Kernville: | 12.7% (61) |
| California: | 13.7% (1,986,831) |
8:30am:
| Kernville: | 13.5% (65) |
| California: | 10.9% (1,577,815) |
9am:
| Kernville: | 3.7% (18) |
| California: | 5.4% (778,152) |
10am:
| Kernville: | 9.8% (47) |
| California: | 6.7% (972,355) |
4pm:
| Kernville: | 15.2% (73) |
| California: | 6.0% (865,284) |
>4pm:
| Kernville: | 1.7% (8) |
| California: | 5.3% (776,167) |

12:00 a.m. to 4:59 a.m. - Males:
| Kernville: | 37.8% (44) |
| California: | 8.7% (747,612) |
7:30 a.m. to 7:59 a.m. - Males:
| Kernville: | 50.6% (59) |
| California: | 8.2% (702,727) |
9:00 a.m. to 9:59 a.m. - Males:
| Kernville: | 6.4% (7) |
| California: | 7.7% (655,038) |

7:00 a.m. to 7:29 a.m. - Females:
| Kernville: | 60.4% (38) |
| California: | 14.1% (969,170) |
9:00 a.m. to 9:59 a.m. - Females:
| Kernville: | 3.1% (2) |
| California: | 9.2% (633,461) |
11:00 a.m. to 11:59 a.m. - Females:
| Kernville: | 27.6% (18) |
| California: | 2.0% (139,355) |
Travel time to work
Percentage of workers working in this county: 78.7%
Number of people working at home: 23 (11.7% of all workers)
Number of people working at home: 23 (11.7% of all workers)


Less than 5 minutes:
| Kernville: | 15.6% (75) |
| California: | 2.2% (324,703) |
5 to 9 minutes:
| Kernville: | 22.5% (108) |
| California: | 8.8% (1,280,443) |
10 to 14 minutes:
| Kernville: | 13.3% (64) |
| California: | 13.3% (1,930,263) |
15 to 19 minutes:
| Kernville: | 9.8% (47) |
| California: | 14.9% (2,157,970) |
20 to 24 minutes:
| Kernville: | 7.9% (38) |
| California: | 13.8% (2,004,060) |
25 to 29 minutes:
| Kernville: | 7.3% (35) |
| California: | 5.4% (782,241) |
45 to 59 minutes:
| Kernville: | 1.5% (7) |
| California: | 7.9% (1,151,598) |
60 to 89 minutes:
| Kernville: | 7.9% (38) |
| California: | 6.4% (933,123) |
90 or more minutes:
| Kernville: | 7.7% (37) |
| California: | 3.3% (483,698) |
Means of transportation to work


Drove car alone:
| Kernville: | 61.5% (296) |
| California: | 71.8% (10,432,462) |
Carpooled:
| Kernville: | 11.2% (54) |
| California: | 14.5% (2,113,313) |
Bus or trolley bus:
| Kernville: | 1.5% (7) |
| California: | 3.8% (549,425) |
Bicycle:
| Kernville: | 3.5% (17) |
| California: | 0.8% (120,567) |
Walked:
| Kernville: | 15.6% (75) |
| California: | 2.9% (414,581) |
Private vehicle occupancy

Drove alone:
| Kernville: | 99.7% (172) |
| California: | 86.9% (12,187,486) |

Drove alone:
| Kernville: | 84.6% (296) |
| California: | 83.2% (10,432,462) |
In 2 person carpool:
| Kernville: | 8.3% (29) |
| California: | 12.5% (1,564,905) |
In 5-6 person carpool:
| Kernville: | 7.1% (25) |
| California: | 0.5% (57,036) |
Class of workers

Employee of private company:
| Kernville: | 52.0% (138) |
| California: | 66.5% (12,596,030) |
Private not-for-profit wage and salary workers:
| Kernville: | 24.8% (66) |
| California: | 7.5% (1,417,407) |
Self-employed workers in own not incorporated business:
| Kernville: | 23.2% (62) |
| California: | 7.4% (1,410,735) |

Employee of private company:
| Kernville: | 54.7% (276) |
| California: | 68.0% (10,009,465) |
Private not-for-profit wage and salary workers:
| Kernville: | 5.7% (29) |
| California: | 5.7% (845,536) |
Local government workers:
| Kernville: | 4.6% (23) |
| California: | 8.3% (1,218,764) |
State government workers:
| Kernville: | 11.1% (56) |
| California: | 4.0% (594,953) |
Federal government workers:
| Kernville: | 8.9% (45) |
| California: | 2.3% (344,354) |
Self-employed workers in own not incorporated business:
| Kernville: | 15.0% (76) |
| California: | 8.5% (1,249,530) |

Employee of private company - Males:
| Kernville: | 43.7% (51) |
| California: | 70.3% (7,191,252) |
Private not-for-profit wage and salary workers - Males:
| Kernville: | 56.3% (66) |
| California: | 5.2% (529,122) |

Employee of private company - Females:
| Kernville: | 58.5% (87) |
| California: | 62.0% (5,404,778) |
Self-employed workers in own not incorporated business - Females:
| Kernville: | 41.5% (62) |
| California: | 6.7% (586,376) |