Work and Jobs in Knightsen, California (CA) Detailed Stats
Occupations, Industries, Unemployment, Workers, Commute
Settings
X


Recent posts about work in Knightsen, California on our local forum with over 2,400,000 registered users:
 | Need advice on buying a grape farm (9 replies) |
| The Bay Area's 3rd Major Urban Area? (8 replies) |
| Single Mother Wanting To Move To California (62 replies) |
| Antioch's a Bargain...but is it a good place to live? (88 replies) |
The most common industries in Knightsen are: Construction (14.8% of civilian employees), Public administration (7.9% of civilian employees), Agriculture, forestry, fishing & hunting (6.0% of civilian employees). 82.7% of workers work in Contra Costa County and 16.5% of all workers work at home. 59.8% of workers are employees of private companies, which is 11.3% less than the rate of 66.5% across the entire state of California.
Whole page based on the data from 2000 / 2022 when the population of Knightsen, California was 861 / 1,638
Whole page based on the data from 2000 / 2022 when the population of Knightsen, California was 861 / 1,638
Most common industries

Most common industries | |||
|---|---|---|---|
Industry | All | Males | Females |
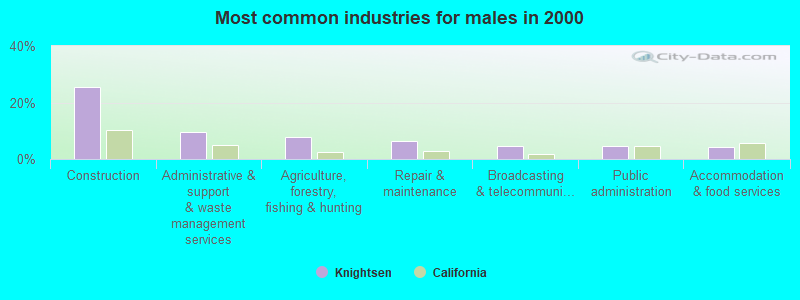
| Construction | 14.8% (54) | 25.7% (49) | 2.9% (5) |
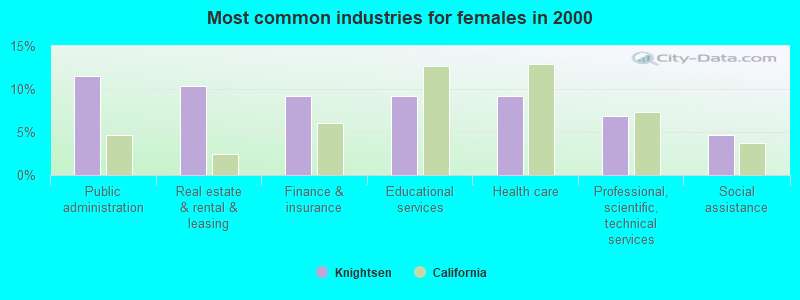
| Public administration | 7.9% (29) | 4.7% (9) | 11.5% (20) |
| Agriculture, forestry, fishing and hunting | 6.0% (22) | 7.9% (15) | 4.0% (7) |
| Educational services | 4.9% (18) | 1.0% (2) | 9.2% (16) |
| Administrative and support and waste management services | 4.9% (18) | 9.4% (18) | 0.0% (0) |
| Real estate and rental and leasing | 4.9% (18) | 0.0% (0) | 10.3% (18) |
| Finance and insurance | 4.9% (18) | 1.0% (2) | 9.2% (16) |
| Professional, scientific, and technical services | 4.7% (17) | 2.6% (5) | 6.9% (12) |
| Health care | 4.4% (16) | 0.0% (0) | 9.2% (16) |
| Personal and laundry services | 3.8% (14) | 3.1% (6) | 4.6% (8) |
| Repair and maintenance | 3.8% (14) | 6.3% (12) | 1.1% (2) |
| Accommodation and food services | 3.3% (12) | 4.2% (8) | 2.3% (4) |
| Broadcasting and telecommunications | 2.7% (10) | 4.7% (9) | 0.6% (1) |
| Social assistance | 2.5% (9) | 0.5% (1) | 4.6% (8) |
| Department and other general merchandise stores | 2.5% (9) | 2.6% (5) | 2.3% (4) |
| Motor vehicle and parts dealers | 1.9% (7) | 3.1% (6) | 0.6% (1) |
| Food and beverage stores | 1.9% (7) | 1.0% (2) | 2.9% (5) |
| Printing and related support activities | 1.6% (6) | 2.1% (4) | 1.1% (2) |
| Metal and metal products | 1.6% (6) | 3.1% (6) | 0.0% (0) |
| Furniture and home furnishings, and household appliance stores | 1.6% (6) | 2.1% (4) | 1.1% (2) |
| Machinery, equipment, and supplies merchant wholesalers | 1.1% (4) | 1.0% (2) | 1.1% (2) |
| Truck transportation | 1.1% (4) | 2.1% (4) | 0.0% (0) |
| Utilities | 1.1% (4) | 2.1% (4) | 0.0% (0) |
| Rail transportation | 1.1% (4) | 0.0% (0) | 2.3% (4) |
| Pharmacies and drug stores | 1.1% (4) | 0.0% (0) | 2.3% (4) |
| Miscellaneous manufacturing | 1.1% (4) | 1.0% (2) | 1.1% (2) |
| Arts, entertainment, and recreation | 1.1% (4) | 0.0% (0) | 2.3% (4) |
| Building material and garden equipment and supplies dealers | 0.8% (3) | 1.0% (2) | 0.6% (1) |
| Other direct selling establishments | 0.8% (3) | 0.5% (1) | 1.1% (2) |
| Chemicals | 0.8% (3) | 0.0% (0) | 1.7% (3) |
| Paper | 0.5% (2) | 1.0% (2) | 0.0% (0) |
| Transportation equipment | 0.5% (2) | 1.0% (2) | 0.0% (0) |
| Miscellaneous nondurable goods merchant wholesalers | 0.5% (2) | 1.0% (2) | 0.0% (0) |
| Machinery | 0.5% (2) | 1.0% (2) | 0.0% (0) |
| Computer and electronic products | 0.5% (2) | 1.0% (2) | 0.0% (0) |
| Office supplies and stationery stores | 0.5% (2) | 0.0% (0) | 1.1% (2) |
| Air transportation | 0.5% (2) | 1.0% (2) | 0.0% (0) |
| Religious, grantmaking, civic, professional, and similar organizations | 0.5% (2) | 0.0% (0) | 1.1% (2) |
| Food | 0.3% (1) | 0.0% (0) | 0.6% (1) |
| Mining, quarrying, and oil and gas extraction | 0.3% (1) | 0.5% (1) | 0.0% (0) |
Unemployment in Knightsen
- Unemployment by race in 2022
- Unemployment rate for White non-Hispanic residents
- 9.2%Males
- Unemployment rate for Asian residents
- 30.2%Males
- 57.8%Females
- Unemployment by race in 2000
- Unemployment rate for White non-Hispanic residents
- 7.6%Males
- 7.9%Females
- Unemployment rate for other race residents
- 28.6%Females
- Unemployment rate for two or more race residents
- 5.0%Females
- Unemployment rate for Hispanic or Latino residents
- 7.8%Males
- 19.1%Females
Time leaving home to go to work

12:00 a.m. to 4:59 a.m.:
| Knightsen: | 6.2% (35) |
| California: | 6.8% (1,050,902) |
5:30 a.m. to 5:59 a.m.:
| Knightsen: | 4.9% (27) |
| California: | 4.3% (665,475) |
6:30 a.m. to 6:59 a.m.:
| Knightsen: | 2.1% (12) |
| California: | 7.5% (1,156,338) |
7:00 a.m. to 7:29 a.m.:
| Knightsen: | 17.4% (97) |
| California: | 13.2% (2,027,702) |
7:30 a.m. to 7:59 a.m.:
| Knightsen: | 28.6% (159) |
| California: | 10.1% (1,550,402) |
8:00 a.m. to 8:29 a.m.:
| Knightsen: | 3.0% (17) |
| California: | 12.7% (1,953,986) |
8:30 a.m. to 8:59 a.m.:
| Knightsen: | 6.6% (37) |
| California: | 5.8% (890,950) |
9:00 a.m. to 9:59 a.m.:
| Knightsen: | 9.9% (55) |
| California: | 8.4% (1,288,499) |
12:00 p.m. to 3:59 p.m.:
| Knightsen: | 11.6% (65) |
| California: | 7.0% (1,075,505) |
4:00 p.m. to 11:59 p.m.:
| Knightsen: | 10.9% (61) |
| California: | 5.8% (891,240) |

<5am:
| Knightsen: | 7.6% (27) |
| California: | 4.2% (606,086) |
5:30am:
| Knightsen: | 5.1% (18) |
| California: | 3.6% (523,209) |
6am:
| Knightsen: | 8.7% (31) |
| California: | 4.8% (692,256) |
6:30am:
| Knightsen: | 16.1% (57) |
| California: | 8.4% (1,216,867) |
7am:
| Knightsen: | 3.9% (14) |
| California: | 9.4% (1,362,830) |
7:30am:
| Knightsen: | 13.8% (49) |
| California: | 13.8% (2,006,950) |
8am:
| Knightsen: | 9.6% (34) |
| California: | 13.7% (1,986,831) |
8:30am:
| Knightsen: | 7.3% (26) |
| California: | 10.9% (1,577,815) |
9am:
| Knightsen: | 5.6% (20) |
| California: | 5.4% (778,152) |
10am:
| Knightsen: | 2.5% (9) |
| California: | 6.7% (972,355) |
11am:
| Knightsen: | 2.0% (7) |
| California: | 2.9% (414,479) |
12pm:
| Knightsen: | 1.7% (6) |
| California: | 1.3% (189,005) |
4pm:
| Knightsen: | 3.9% (14) |
| California: | 6.0% (865,284) |
>4pm:
| Knightsen: | 3.7% (13) |
| California: | 5.3% (776,167) |

12:00 a.m. to 4:59 a.m. - Males:
| Knightsen: | 8.4% (35) |
| California: | 8.7% (747,612) |
5:30 a.m. to 5:59 a.m. - Males:
| Knightsen: | 6.4% (27) |
| California: | 5.2% (448,269) |
6:30 a.m. to 6:59 a.m. - Males:
| Knightsen: | 3.0% (12) |
| California: | 7.7% (657,557) |
7:00 a.m. to 7:29 a.m. - Males:
| Knightsen: | 18.1% (75) |
| California: | 12.4% (1,058,532) |
7:30 a.m. to 7:59 a.m. - Males:
| Knightsen: | 30.9% (128) |
| California: | 8.2% (702,727) |
8:00 a.m. to 8:29 a.m. - Males:
| Knightsen: | 4.0% (17) |
| California: | 11.5% (984,538) |
8:30 a.m. to 8:59 a.m. - Males:
| Knightsen: | 10.0% (42) |
| California: | 4.8% (414,815) |
12:00 p.m. to 3:59 p.m. - Males:
| Knightsen: | 6.0% (25) |
| California: | 7.0% (594,847) |
4:00 p.m. to 11:59 p.m. - Males:
| Knightsen: | 16.2% (68) |
| California: | 5.8% (499,471) |

7:00 a.m. to 7:29 a.m. - Females:
| Knightsen: | 15.4% (22) |
| California: | 14.1% (969,170) |
7:30 a.m. to 7:59 a.m. - Females:
| Knightsen: | 22.0% (32) |
| California: | 12.4% (847,675) |
9:00 a.m. to 9:59 a.m. - Females:
| Knightsen: | 40.3% (58) |
| California: | 9.2% (633,461) |
12:00 p.m. to 3:59 p.m. - Females:
| Knightsen: | 26.5% (38) |
| California: | 7.0% (480,658) |
Travel time to work
Percentage of workers working in this county: 82.7%
Number of people working at home: 115 (16.5% of all workers)
Number of people working at home: 115 (16.5% of all workers)


Less than 5 minutes:
| Knightsen: | 6.2% (22) |
| California: | 2.2% (324,703) |
5 to 9 minutes:
| Knightsen: | 7.6% (27) |
| California: | 8.8% (1,280,443) |
10 to 14 minutes:
| Knightsen: | 11.8% (42) |
| California: | 13.3% (1,930,263) |
15 to 19 minutes:
| Knightsen: | 6.8% (24) |
| California: | 14.9% (2,157,970) |
20 to 24 minutes:
| Knightsen: | 8.7% (31) |
| California: | 13.8% (2,004,060) |
25 to 29 minutes:
| Knightsen: | 2.0% (7) |
| California: | 5.4% (782,241) |
30 to 34 minutes:
| Knightsen: | 6.5% (23) |
| California: | 13.9% (2,025,657) |
35 to 39 minutes:
| Knightsen: | 2.5% (9) |
| California: | 2.5% (366,487) |
40 to 44 minutes:
| Knightsen: | 2.8% (10) |
| California: | 3.6% (528,043) |
45 to 59 minutes:
| Knightsen: | 10.4% (37) |
| California: | 7.9% (1,151,598) |
60 to 89 minutes:
| Knightsen: | 13.8% (49) |
| California: | 6.4% (933,123) |
90 or more minutes:
| Knightsen: | 12.4% (44) |
| California: | 3.3% (483,698) |
Means of transportation to work


Drove car alone:
| Knightsen: | 67.6% (240) |
| California: | 71.8% (10,432,462) |
Carpooled:
| Knightsen: | 18.9% (67) |
| California: | 14.5% (2,113,313) |
Railroad:
| Knightsen: | 0.8% (3) |
| California: | 0.3% (41,022) |
Walked:
| Knightsen: | 4.2% (15) |
| California: | 2.9% (414,581) |
Private vehicle occupancy

Drove alone:
| Knightsen: | 87.7% (485) |
| California: | 86.9% (12,187,486) |
In 2 person carpool:
| Knightsen: | 12.2% (67) |
| California: | 9.2% (1,295,561) |

Drove alone:
| Knightsen: | 78.2% (240) |
| California: | 83.2% (10,432,462) |
In 2 person carpool:
| Knightsen: | 15.3% (47) |
| California: | 12.5% (1,564,905) |
In 3 person carpool:
| Knightsen: | 5.9% (18) |
| California: | 2.6% (330,732) |
In 7+ person carpool:
| Knightsen: | 0.7% (2) |
| California: | 0.3% (41,276) |
Class of workers

Employee of private company:
| Knightsen: | 59.8% (453) |
| California: | 66.5% (12,596,030) |
Self-employed in own incorporated business:
| Knightsen: | 10.9% (83) |
| California: | 4.1% (784,709) |
Private not-for-profit wage and salary workers:
| Knightsen: | 13.1% (99) |
| California: | 7.5% (1,417,407) |
Local government workers:
| Knightsen: | 4.0% (30) |
| California: | 8.2% (1,547,056) |
Federal government workers:
| Knightsen: | 3.4% (26) |
| California: | 2.0% (369,858) |
Self-employed workers in own not incorporated business:
| Knightsen: | 6.6% (50) |
| California: | 7.4% (1,410,735) |
Unpaid family workers:
| Knightsen: | 2.2% (17) |
| California: | 0.2% (36,267) |

Employee of private company:
| Knightsen: | 65.2% (238) |
| California: | 68.0% (10,009,465) |
Self-employed in own incorporated business:
| Knightsen: | 0.8% (3) |
| California: | 2.7% (402,392) |
Private not-for-profit wage and salary workers:
| Knightsen: | 1.1% (4) |
| California: | 5.7% (845,536) |
Local government workers:
| Knightsen: | 11.8% (43) |
| California: | 8.3% (1,218,764) |
State government workers:
| Knightsen: | 2.5% (9) |
| California: | 4.0% (594,953) |
Federal government workers:
| Knightsen: | 0.8% (3) |
| California: | 2.3% (344,354) |
Self-employed workers in own not incorporated business:
| Knightsen: | 14.2% (52) |
| California: | 8.5% (1,249,530) |
Unpaid family workers:
| Knightsen: | 3.6% (13) |
| California: | 0.4% (53,934) |

Employee of private company - Males:
| Knightsen: | 72.6% (355) |
| California: | 70.3% (7,191,252) |
Self-employed in own incorporated business - Males:
| Knightsen: | 10.4% (51) |
| California: | 4.9% (504,764) |
Private not-for-profit wage and salary workers - Males:
| Knightsen: | 6.7% (33) |
| California: | 5.2% (529,122) |
Local government workers - Males:
| Knightsen: | 1.2% (6) |
| California: | 6.0% (610,331) |
Federal government workers - Males:
| Knightsen: | 5.3% (26) |
| California: | 2.1% (209,874) |
Self-employed workers in own not incorporated business - Males:
| Knightsen: | 3.7% (18) |
| California: | 8.1% (824,359) |

Employee of private company - Females:
| Knightsen: | 36.4% (98) |
| California: | 62.0% (5,404,778) |
Self-employed in own incorporated business - Females:
| Knightsen: | 11.9% (32) |
| California: | 3.2% (279,945) |
Private not-for-profit wage and salary workers - Females:
| Knightsen: | 24.5% (66) |
| California: | 10.2% (888,285) |
Local government workers - Females:
| Knightsen: | 8.9% (24) |
| California: | 10.8% (936,725) |
Self-employed workers in own not incorporated business - Females:
| Knightsen: | 11.9% (32) |
| California: | 6.7% (586,376) |
Unpaid family workers - Females:
| Knightsen: | 6.3% (17) |
| California: | 0.2% (18,345) |