Work and Jobs in La Porte, Texas (TX) Detailed Stats
Occupations, Industries, Unemployment, Workers, Commute
Settings
X


Recent posts about work in La Porte, Texas on our local forum with over 2,400,000 registered users:
 | La Porte vs Deer Park vs Pasadena vs Mont Belvieu vs Dayton vs Clear Lake (11 replies) |
| Why is Dallas so underrated for nightlife? (114 replies) |
| Relocating family -job in La Porte.. Where to live?! (6 replies) |
| Houston's economic diversity Thread .. (1255 replies) |
| How is commute fom Sugar Land to La Porte TX? (28 replies) |
| How far do you travel from home to work? (23 replies) |
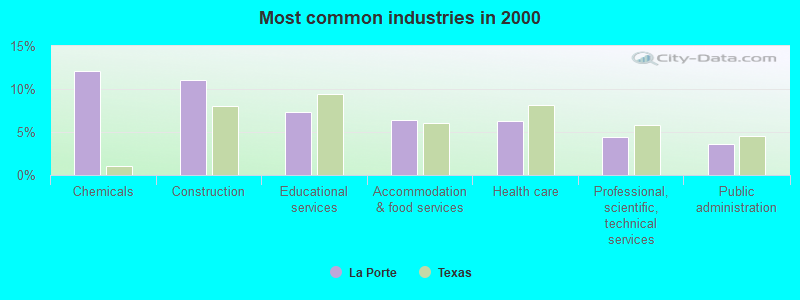
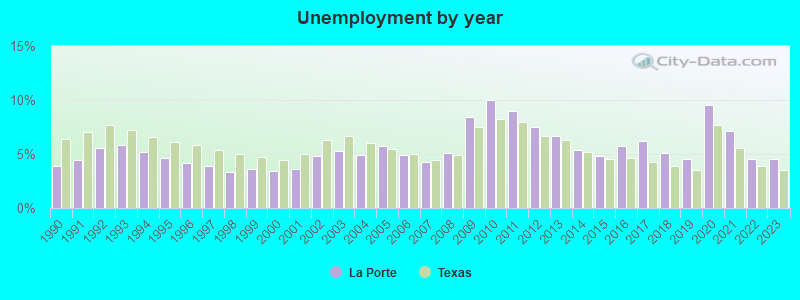
The unemployment rate in 2023 in La Porte, TX was 4.5%, which was 22.2% greater than the unemployment rate of 3.5% across the entire state of Texas. Compared to the unemployment rate of 6.7% in 2013, this represents a decrease of 48.9%. The most common industries in La Porte are: Chemicals (12.0% of civilian employees), Construction (11.1% of civilian employees), Educational services (7.3% of civilian employees). 92.0% of workers work in Harris County and 6.9% of all workers work at home. 75.5% of workers are employees of private companies, which is 7.8% greater than the rate of 69.6% across the entire state of Texas.
Whole page based on the data from 2000 / 2022 when the population of La Porte, Texas was 31,880 / 36,196
Whole page based on the data from 2000 / 2022 when the population of La Porte, Texas was 31,880 / 36,196
Most common industries
Most common industries | |||
|---|---|---|---|
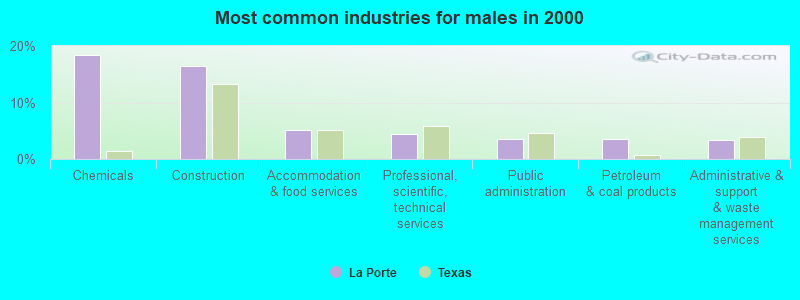
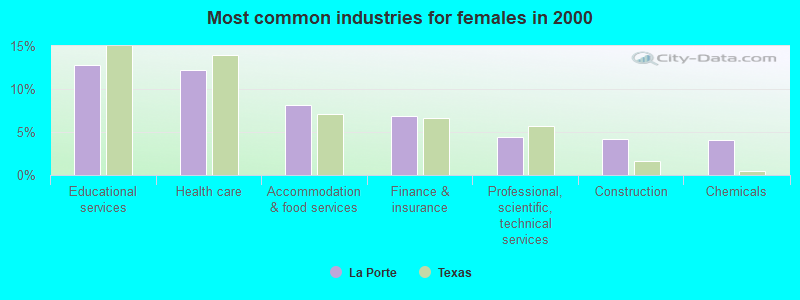
Industry | All | Males | Females |
| Chemicals | 12.0% (1,897) | 18.4% (1,610) | 4.1% (287) |
| Construction | 11.1% (1,740) | 16.5% (1,446) | 4.2% (294) |
| Educational services | 7.3% (1,145) | 2.9% (250) | 12.8% (895) |
| Accommodation and food services | 6.4% (1,011) | 5.1% (444) | 8.1% (567) |
| Health care | 6.3% (994) | 1.6% (144) | 12.2% (850) |
| Professional, scientific, and technical services | 4.4% (697) | 4.5% (392) | 4.4% (305) |
| Public administration | 3.6% (570) | 3.6% (315) | 3.7% (255) |
| Finance and insurance | 3.4% (538) | 0.7% (59) | 6.9% (479) |
| Administrative and support and waste management services | 3.4% (531) | 3.4% (302) | 3.3% (229) |
| Petroleum and coal products | 2.7% (428) | 3.5% (304) | 1.8% (124) |
| Truck transportation | 2.2% (347) | 3.0% (266) | 1.2% (81) |
| Other transportation, and support activities, and couriers | 2.0% (310) | 1.6% (140) | 2.4% (170) |
| Food and beverage stores | 2.0% (308) | 1.0% (89) | 3.1% (219) |
| Repair and maintenance | 1.9% (302) | 2.6% (225) | 1.1% (77) |
| Real estate and rental and leasing | 1.8% (290) | 1.9% (169) | 1.7% (121) |
| Metal and metal products | 1.8% (277) | 2.4% (206) | 1.0% (71) |
| Motor vehicle and parts dealers | 1.8% (277) | 2.7% (233) | 0.6% (44) |
| Machinery | 1.7% (269) | 2.3% (200) | 1.0% (69) |
| Utilities | 1.4% (228) | 2.0% (171) | 0.8% (57) |
| Plastics and rubber products | 1.4% (226) | 1.9% (169) | 0.8% (57) |
| Mining, quarrying, and oil and gas extraction | 1.3% (205) | 1.5% (131) | 1.1% (74) |
| Religious, grantmaking, civic, professional, and similar organizations | 1.2% (185) | 0.7% (61) | 1.8% (124) |
| Social assistance | 1.1% (180) | 0.2% (20) | 2.3% (160) |
| Machinery, equipment, and supplies merchant wholesalers | 1.1% (169) | 1.0% (88) | 1.2% (81) |
| Transportation equipment | 0.9% (148) | 1.4% (121) | 0.4% (27) |
| Miscellaneous manufacturing | 0.8% (133) | 1.0% (84) | 0.7% (49) |
| Electrical and electronic goods merchant wholesalers | 0.7% (114) | 0.8% (67) | 0.7% (47) |
| Arts, entertainment, and recreation | 0.7% (109) | 0.6% (56) | 0.8% (53) |
| U. S. Postal service | 0.7% (106) | 0.9% (75) | 0.4% (31) |
| Department and other general merchandise stores | 0.7% (104) | 0.3% (22) | 1.2% (82) |
| Personal and laundry services | 0.7% (104) | 0.2% (19) | 1.2% (85) |
| Building material and garden equipment and supplies dealers | 0.7% (104) | 0.7% (59) | 0.6% (45) |
| Broadcasting and telecommunications | 0.6% (95) | 0.4% (35) | 0.9% (60) |
| Clothing and accessories, including shoe, stores | 0.6% (87) | 0.3% (27) | 0.9% (60) |
| Metals and minerals, except petroleum, merchant wholesalers | 0.5% (83) | 0.3% (29) | 0.8% (54) |
| Warehousing and storage | 0.5% (81) | 0.5% (48) | 0.5% (33) |
| Computer and electronic products | 0.5% (77) | 0.3% (22) | 0.8% (55) |
| Pharmacies and drug stores | 0.4% (69) | 0.1% (7) | 0.9% (62) |
| Radio, TV, and computer stores | 0.4% (66) | 0.6% (50) | 0.2% (16) |
| Publishing, and motion picture and sound recording industries | 0.4% (64) | 0.3% (23) | 0.6% (41) |
| Used merchandise, gift, novelty, and souvenir, and other miscellaneous stores | 0.4% (64) | 0.3% (26) | 0.5% (38) |
| Other direct selling establishments | 0.4% (57) | 0.4% (31) | 0.4% (26) |
| Furniture and home furnishings, and household appliance stores | 0.4% (56) | 0.4% (34) | 0.3% (22) |
| Electrical equipment, appliances, and components | 0.3% (54) | 0.3% (29) | 0.4% (25) |
| Sporting goods, camera, and hobby and toy stores | 0.3% (53) | 0.3% (29) | 0.3% (24) |
| Nonmetallic mineral products | 0.3% (51) | 0.5% (44) | 0.1% (7) |
| Food | 0.3% (49) | 0.5% (41) | 0.1% (8) |
| Gasoline stations | 0.3% (45) | 0.1% (13) | 0.5% (32) |
| Air transportation | 0.3% (45) | 0.4% (31) | 0.2% (14) |
| Private households | 0.3% (42) | 0.0% (0) | 0.6% (42) |
| Water transportation | 0.3% (42) | 0.4% (33) | 0.1% (9) |
| Petroleum and petroleum products merchant wholesalers | 0.3% (40) | 0.4% (35) | 0.1% (5) |
| Miscellaneous durable goods merchant wholesalers | 0.2% (38) | 0.1% (11) | 0.4% (27) |
| Miscellaneous nondurable goods merchant wholesalers | 0.2% (37) | 0.3% (28) | 0.1% (9) |
| Groceries and related products merchant wholesalers | 0.2% (36) | 0.4% (36) | 0.0% (0) |
| Beverage and tobacco products | 0.2% (33) | 0.3% (27) | 0.1% (6) |
| Rail transportation | 0.2% (30) | 0.3% (30) | 0.0% (0) |
| Drugs, sundries, and chemical and allied products merchant wholesalers | 0.2% (30) | 0.3% (24) | 0.1% (6) |
| Data processing, libraries, and other information services | 0.2% (25) | 0.1% (10) | 0.2% (15) |
| Retail florists | 0.2% (25) | 0.0% (0) | 0.4% (25) |
| Music stores | 0.1% (19) | 0.1% (10) | 0.1% (9) |
| Health and personal care, except drug, stores | 0.1% (18) | 0.0% (0) | 0.3% (18) |
| Paper and paper products merchant wholesalers | 0.1% (16) | 0.1% (9) | 0.1% (7) |
| Textile mills and textile products | 0.1% (16) | 0.1% (6) | 0.1% (10) |
Unemployment in La Porte
- Unemployment by race in 2022
- Unemployment rate for White non-Hispanic residents
- 4.5%Males
- 3.8%Females
- Unemployment rate for Black residents
- 5.8%Males
- Unemployment rate for American Indian and Alaska Native residents
- 3.5%Females
- Unemployment rate for other race residents
- 3.6%Females
- Unemployment rate for two or more race residents
- 3.2%Males
- 6.7%Females
- Unemployment rate for Hispanic or Latino residents
- 6.5%Males
- 4.8%Females
- Unemployment by race in 2000
- Unemployment rate for White non-Hispanic residents
- 3.3%Males
- 6.2%Females
- Unemployment rate for Black residents
- 9.0%Males
- 12.3%Females
- Unemployment rate for American Indian and Alaska Native residents
- 12.7%Females
- Unemployment rate for other race residents
- 3.5%Males
- 10.1%Females
- Unemployment rate for two or more race residents
- 3.5%Females
- Unemployment rate for Hispanic or Latino residents
- 4.3%Males
- 7.6%Females
Unemployment in 2023:
| La Porte: | 4.5% |
| Texas: | 3.5% |
Unemployment in 2022:
| La Porte: | 4.5% |
| Texas: | 3.9% |
Unemployment in 2021:
| La Porte: | 7.1% |
| Texas: | 5.6% |
Unemployment in 2020:
| La Porte: | 9.5% |
| Texas: | 7.7% |
Unemployment in 2019:
| La Porte: | 4.5% |
| Texas: | 3.5% |
Unemployment in 2018:
| La Porte: | 5.1% |
| Texas: | 3.9% |
Unemployment in 2017:
| La Porte: | 6.2% |
| Texas: | 4.3% |
Unemployment in 2016:
| La Porte: | 5.7% |
| Texas: | 4.6% |
Unemployment in 2015:
| La Porte: | 4.8% |
| Texas: | 4.5% |
Unemployment in 2014:
| La Porte: | 5.4% |
| Texas: | 5.2% |
Unemployment in 2013:
| La Porte: | 6.7% |
| Texas: | 6.3% |
Unemployment in 2012:
| La Porte: | 7.5% |
| Texas: | 6.7% |
Unemployment in 2011:
| La Porte: | 9.0% |
| Texas: | 8.0% |
Unemployment in 2010:
| La Porte: | 10.0% |
| Texas: | 8.2% |
Unemployment in 2009:
| La Porte: | 8.4% |
| Texas: | 7.5% |
Unemployment in 2008:
| La Porte: | 5.1% |
| Texas: | 4.9% |
Unemployment in 2007:
| La Porte: | 4.3% |
| Texas: | 4.4% |
Unemployment in 2006:
| La Porte: | 4.9% |
| Texas: | 5.0% |
Unemployment in 2005:
| La Porte: | 5.7% |
| Texas: | 5.5% |
Unemployment in 2004:
| La Porte: | 4.9% |
| Texas: | 6.0% |
Unemployment in 2003:
| La Porte: | 5.3% |
| Texas: | 6.7% |
Unemployment in 2002:
| La Porte: | 4.8% |
| Texas: | 6.3% |
Unemployment in 2001:
| La Porte: | 3.6% |
| Texas: | 5.0% |
Unemployment in 2000:
| La Porte: | 3.4% |
| Texas: | 4.4% |
Unemployment in 1999:
| La Porte: | 3.6% |
| Texas: | 4.7% |
Unemployment in 1998:
| La Porte: | 3.3% |
| Texas: | 5.0% |
Unemployment in 1997:
| La Porte: | 3.9% |
| Texas: | 5.4% |
Unemployment in 1996:
| La Porte: | 4.2% |
| Texas: | 5.8% |
Unemployment in 1995:
| La Porte: | 4.6% |
| Texas: | 6.1% |
Unemployment in 1994:
| La Porte: | 5.2% |
| Texas: | 6.6% |
Unemployment in 1993:
| La Porte: | 5.8% |
| Texas: | 7.2% |
Unemployment in 1992:
| La Porte: | 5.6% |
| Texas: | 7.7% |
Unemployment in 1991:
| La Porte: | 4.4% |
| Texas: | 7.0% |
Unemployment in 1990:
| La Porte: | 3.9% |
| Texas: | 6.4% |
Time leaving home to go to work

12:00 a.m. to 4:59 a.m.:
| La Porte: | 8.9% (1,350) |
| Texas: | 5.5% (678,264) |
5:00 a.m. to 5:29 a.m.:
| La Porte: | 7.8% (1,182) |
| Texas: | 4.3% (525,841) |
5:30 a.m. to 5:59 a.m.:
| La Porte: | 6.3% (954) |
| Texas: | 4.9% (603,953) |
6:00 a.m. to 6:29 a.m.:
| La Porte: | 12.3% (1,871) |
| Texas: | 9.4% (1,155,020) |
6:30 a.m. to 6:59 a.m.:
| La Porte: | 11.3% (1,723) |
| Texas: | 9.3% (1,152,822) |
7:00 a.m. to 7:29 a.m.:
| La Porte: | 13.7% (2,084) |
| Texas: | 15.3% (1,885,477) |
7:30 a.m. to 7:59 a.m.:
| La Porte: | 11.9% (1,812) |
| Texas: | 11.9% (1,469,628) |
8:00 a.m. to 8:29 a.m.:
| La Porte: | 7.4% (1,125) |
| Texas: | 11.3% (1,400,175) |
8:30 a.m. to 8:59 a.m.:
| La Porte: | 2.8% (422) |
| Texas: | 4.9% (599,574) |
9:00 a.m. to 9:59 a.m.:
| La Porte: | 4.1% (620) |
| Texas: | 6.7% (829,367) |
10:00 a.m. to 10:59 a.m.:
| La Porte: | 3.3% (496) |
| Texas: | 3.2% (390,354) |
11:00 a.m. to 11:59 a.m.:
| La Porte: | 1.3% (205) |
| Texas: | 1.3% (162,330) |
12:00 p.m. to 3:59 p.m.:
| La Porte: | 4.3% (660) |
| Texas: | 5.8% (720,594) |
4:00 p.m. to 11:59 p.m.:
| La Porte: | 4.3% (660) |
| Texas: | 6.3% (777,072) |

<5am:
| La Porte: | 5.2% (805) |
| Texas: | 3.1% (281,361) |
5:30am:
| La Porte: | 6.7% (1,039) |
| Texas: | 2.9% (262,060) |
6am:
| La Porte: | 6.1% (955) |
| Texas: | 4.4% (403,423) |
6:30am:
| La Porte: | 13.6% (2,107) |
| Texas: | 8.8% (808,876) |
7am:
| La Porte: | 14.1% (2,193) |
| Texas: | 10.7% (976,557) |
7:30am:
| La Porte: | 16.0% (2,478) |
| Texas: | 16.4% (1,500,904) |
8am:
| La Porte: | 11.0% (1,702) |
| Texas: | 16.8% (1,536,308) |
8:30am:
| La Porte: | 6.3% (980) |
| Texas: | 10.0% (913,601) |
9am:
| La Porte: | 2.9% (454) |
| Texas: | 4.4% (398,656) |
10am:
| La Porte: | 3.0% (467) |
| Texas: | 5.2% (472,592) |
11am:
| La Porte: | 1.8% (285) |
| Texas: | 2.2% (197,844) |
12pm:
| La Porte: | 0.6% (97) |
| Texas: | 0.9% (86,997) |
4pm:
| La Porte: | 4.6% (715) |
| Texas: | 5.5% (503,565) |
>4pm:
| La Porte: | 6.8% (1,062) |
| Texas: | 6.1% (563,107) |

12:00 a.m. to 4:59 a.m. - Males:
| La Porte: | 14.3% (1,164) |
| Texas: | 7.0% (477,284) |
5:00 a.m. to 5:29 a.m. - Males:
| La Porte: | 13.7% (1,115) |
| Texas: | 5.8% (394,876) |
5:30 a.m. to 5:59 a.m. - Males:
| La Porte: | 7.8% (634) |
| Texas: | 5.9% (402,788) |
6:00 a.m. to 6:29 a.m. - Males:
| La Porte: | 10.5% (850) |
| Texas: | 10.9% (751,118) |
6:30 a.m. to 6:59 a.m. - Males:
| La Porte: | 9.3% (759) |
| Texas: | 9.5% (652,306) |
7:00 a.m. to 7:29 a.m. - Males:
| La Porte: | 11.0% (893) |
| Texas: | 14.1% (970,598) |
7:30 a.m. to 7:59 a.m. - Males:
| La Porte: | 9.0% (731) |
| Texas: | 10.2% (696,429) |
8:00 a.m. to 8:29 a.m. - Males:
| La Porte: | 4.5% (366) |
| Texas: | 10.6% (729,041) |
8:30 a.m. to 8:59 a.m. - Males:
| La Porte: | 2.7% (220) |
| Texas: | 4.1% (281,762) |
9:00 a.m. to 9:59 a.m. - Males:
| La Porte: | 4.4% (355) |
| Texas: | 5.8% (401,071) |
10:00 a.m. to 10:59 a.m. - Males:
| La Porte: | 3.0% (246) |
| Texas: | 2.7% (186,469) |
11:00 a.m. to 11:59 a.m. - Males:
| La Porte: | 0.9% (74) |
| Texas: | 1.2% (82,242) |
12:00 p.m. to 3:59 p.m. - Males:
| La Porte: | 3.6% (292) |
| Texas: | 5.8% (397,795) |
4:00 p.m. to 11:59 p.m. - Males:
| La Porte: | 4.7% (381) |
| Texas: | 6.4% (435,950) |

12:00 a.m. to 4:59 a.m. - Females:
| La Porte: | 2.8% (199) |
| Texas: | 3.7% (200,980) |
5:00 a.m. to 5:29 a.m. - Females:
| La Porte: | 1.2% (87) |
| Texas: | 2.4% (130,965) |
5:30 a.m. to 5:59 a.m. - Females:
| La Porte: | 4.5% (319) |
| Texas: | 3.7% (201,165) |
6:00 a.m. to 6:29 a.m. - Females:
| La Porte: | 14.4% (1,025) |
| Texas: | 7.4% (403,902) |
6:30 a.m. to 6:59 a.m. - Females:
| La Porte: | 13.2% (939) |
| Texas: | 9.1% (500,516) |
7:00 a.m. to 7:29 a.m. - Females:
| La Porte: | 16.8% (1,195) |
| Texas: | 16.7% (914,879) |
7:30 a.m. to 7:59 a.m. - Females:
| La Porte: | 15.2% (1,079) |
| Texas: | 14.1% (773,199) |
8:00 a.m. to 8:29 a.m. - Females:
| La Porte: | 10.7% (759) |
| Texas: | 12.2% (671,134) |
8:30 a.m. to 8:59 a.m. - Females:
| La Porte: | 2.7% (193) |
| Texas: | 5.8% (317,812) |
9:00 a.m. to 9:59 a.m. - Females:
| La Porte: | 3.8% (269) |
| Texas: | 7.8% (428,296) |
10:00 a.m. to 10:59 a.m. - Females:
| La Porte: | 3.4% (244) |
| Texas: | 3.7% (203,885) |
11:00 a.m. to 11:59 a.m. - Females:
| La Porte: | 1.8% (125) |
| Texas: | 1.5% (80,088) |
12:00 p.m. to 3:59 p.m. - Females:
| La Porte: | 5.1% (359) |
| Texas: | 5.9% (322,799) |
4:00 p.m. to 11:59 p.m. - Females:
| La Porte: | 3.9% (275) |
| Texas: | 6.2% (341,122) |
Travel time to work
Percentage of workers working in this county: 92.0%
Number of people working at home: 1,157 (6.9% of all workers)
Daytime population change due to commuting: -3,043 (-9.5%)
Workers who live and work in this city: 3,239 (20.9%)
Number of people working at home: 1,157 (6.9% of all workers)
Daytime population change due to commuting: -3,043 (-9.5%)
Workers who live and work in this city: 3,239 (20.9%)

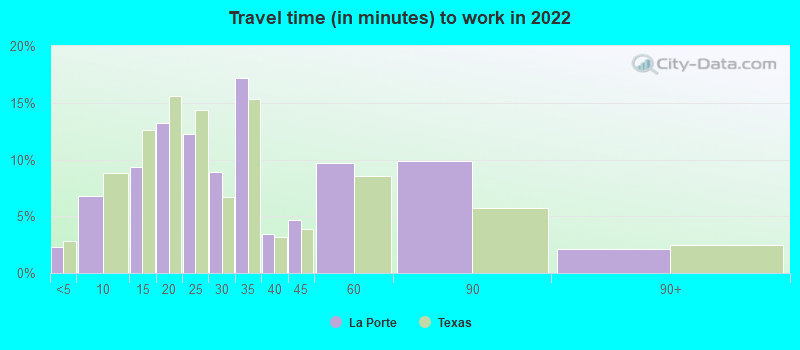

Less than 5 minutes:
| La Porte: | 2.3% (400) |
| Texas: | 2.8% (350,462) |
5 to 9 minutes:
| La Porte: | 6.8% (1,196) |
| Texas: | 8.8% (1,087,762) |
10 to 14 minutes:
| La Porte: | 9.3% (1,641) |
| Texas: | 12.6% (1,550,271) |
15 to 19 minutes:
| La Porte: | 13.2% (2,327) |
| Texas: | 15.6% (1,918,353) |
20 to 24 minutes:
| La Porte: | 12.3% (2,156) |
| Texas: | 14.4% (1,772,079) |
25 to 29 minutes:
| La Porte: | 8.9% (1,569) |
| Texas: | 6.7% (827,833) |
30 to 34 minutes:
| La Porte: | 17.2% (3,016) |
| Texas: | 15.3% (1,887,878) |
35 to 39 minutes:
| La Porte: | 3.5% (611) |
| Texas: | 3.2% (394,170) |
40 to 44 minutes:
| La Porte: | 4.7% (818) |
| Texas: | 3.9% (476,118) |
45 to 59 minutes:
| La Porte: | 9.7% (1,697) |
| Texas: | 8.6% (1,058,376) |
60 to 89 minutes:
| La Porte: | 9.9% (1,739) |
| Texas: | 5.7% (706,002) |
90 or more minutes:
| La Porte: | 2.1% (375) |
| Texas: | 2.4% (299,884) |


Less than 5 minutes:
| La Porte: | 2.4% (379) |
| Texas: | 3.0% (277,642) |
5 to 9 minutes:
| La Porte: | 10.8% (1,671) |
| Texas: | 10.3% (942,891) |
10 to 14 minutes:
| La Porte: | 15.5% (2,404) |
| Texas: | 14.4% (1,317,555) |
15 to 19 minutes:
| La Porte: | 16.8% (2,613) |
| Texas: | 16.0% (1,467,945) |
20 to 24 minutes:
| La Porte: | 14.1% (2,190) |
| Texas: | 13.9% (1,276,781) |
25 to 29 minutes:
| La Porte: | 5.3% (819) |
| Texas: | 5.3% (482,838) |
30 to 34 minutes:
| La Porte: | 14.1% (2,193) |
| Texas: | 14.3% (1,309,699) |
35 to 39 minutes:
| La Porte: | 2.4% (376) |
| Texas: | 2.4% (219,873) |
40 to 44 minutes:
| La Porte: | 3.0% (461) |
| Texas: | 3.1% (280,916) |
45 to 59 minutes:
| La Porte: | 8.8% (1,361) |
| Texas: | 7.6% (692,006) |
60 to 89 minutes:
| La Porte: | 4.3% (664) |
| Texas: | 4.6% (418,905) |
90 or more minutes:
| La Porte: | 1.3% (208) |
| Texas: | 2.4% (218,800) |

Less than 5 minutes - Males:
| La Porte: | 2.3% (301) |
| Texas: | 2.7% (181,937) |
5 to 9 minutes - Males:
| La Porte: | 5.0% (644) |
| Texas: | 7.6% (522,166) |
10 to 14 minutes - Males:
| La Porte: | 10.5% (1,359) |
| Texas: | 11.5% (785,572) |
15 to 19 minutes - Males:
| La Porte: | 12.6% (1,632) |
| Texas: | 14.6% (1,001,179) |
20 to 24 minutes - Males:
| La Porte: | 11.0% (1,432) |
| Texas: | 13.9% (950,043) |
25 to 29 minutes - Males:
| La Porte: | 9.3% (1,204) |
| Texas: | 6.7% (457,259) |
30 to 34 minutes - Males:
| La Porte: | 16.1% (2,083) |
| Texas: | 16.2% (1,110,357) |
35 to 39 minutes - Males:
| La Porte: | 3.2% (421) |
| Texas: | 3.3% (223,512) |
40 to 44 minutes - Males:
| La Porte: | 5.4% (700) |
| Texas: | 4.2% (289,434) |
45 to 59 minutes - Males:
| La Porte: | 10.0% (1,294) |
| Texas: | 9.3% (639,122) |
60 to 89 minutes - Males:
| La Porte: | 11.9% (1,549) |
| Texas: | 6.8% (467,154) |
90 or more minutes - Males:
| La Porte: | 2.7% (347) |
| Texas: | 3.1% (211,313) |

Less than 5 minutes - Females:
| La Porte: | 2.1% (96) |
| Texas: | 3.1% (168,525) |
5 to 9 minutes - Females:
| La Porte: | 11.9% (547) |
| Texas: | 10.3% (565,596) |
10 to 14 minutes - Females:
| La Porte: | 7.9% (365) |
| Texas: | 13.9% (764,699) |
15 to 19 minutes - Females:
| La Porte: | 15.1% (694) |
| Texas: | 16.7% (917,174) |
20 to 24 minutes - Females:
| La Porte: | 15.1% (697) |
| Texas: | 15.0% (822,036) |
25 to 29 minutes - Females:
| La Porte: | 7.9% (365) |
| Texas: | 6.7% (370,574) |
30 to 34 minutes - Females:
| La Porte: | 20.2% (930) |
| Texas: | 14.2% (777,521) |
35 to 39 minutes - Females:
| La Porte: | 3.7% (169) |
| Texas: | 3.1% (170,658) |
40 to 44 minutes - Females:
| La Porte: | 2.9% (134) |
| Texas: | 3.4% (186,684) |
45 to 59 minutes - Females:
| La Porte: | 9.0% (414) |
| Texas: | 7.6% (419,254) |
60 to 89 minutes - Females:
| La Porte: | 4.2% (194) |
| Texas: | 4.4% (238,848) |
90 or more minutes - Females:
| La Porte: | 0.4% (17) |
| Texas: | 1.6% (88,571) |
Means of transportation to work
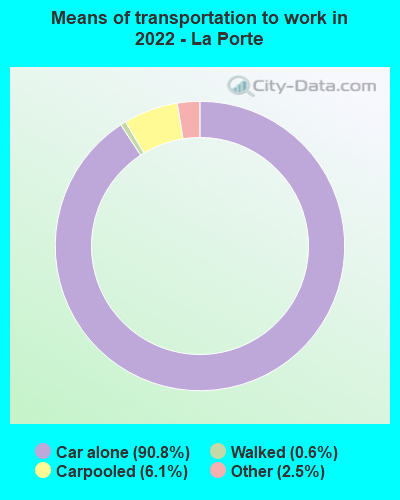

Drove car alone:
| La Porte: | 90.8% (16,368) |
| Texas: | 83.3% (4,557,023) |
Carpooled:
| La Porte: | 6.1% (1,102) |
| Texas: | 11.7% (674,818) |
Bicycle:
| La Porte: | 0.0% (1) |
| Texas: | 0.2% (7,954) |
Walked:
| La Porte: | 0.6% (106) |
| Texas: | 1.7% (99,911) |
Other means:
| La Porte: | 2.5% (451) |
| Texas: | 2.0% (95,481) |


Drove car alone:
| La Porte: | 86.1% (13,378) |
| Texas: | 77.7% (7,115,590) |
Carpooled:
| La Porte: | 9.7% (1,507) |
| Texas: | 14.5% (1,326,012) |
Bus or trolley bus:
| La Porte: | 0.3% (48) |
| Texas: | 1.7% (157,014) |
Ferryboat:
| La Porte: | 0.1% (11) |
| Texas: | 0.0% (738) |
Motorcycle:
| La Porte: | 0.5% (80) |
| Texas: | 0.1% (12,068) |
Bicycle:
| La Porte: | 0.2% (34) |
| Texas: | 0.2% (21,551) |
Walked:
| La Porte: | 1.1% (172) |
| Texas: | 1.9% (173,670) |
Other means:
| La Porte: | 0.7% (109) |
| Texas: | 0.9% (86,692) |


Drove car alone - Males:
| La Porte: | 91.7% (12,142) |
| Texas: | 83.6% (4,557,023) |
Carpooled - Males:
| La Porte: | 5.0% (668) |
| Texas: | 11.2% (674,818) |
Bicycle - Males:
| La Porte: | 0.0% (1) |
| Texas: | 0.3% (7,954) |
Walked - Males:
| La Porte: | 0.6% (75) |
| Texas: | 1.7% (99,911) |
Other means - Males:
| La Porte: | 2.7% (361) |
| Texas: | 2.2% (95,481) |


Drove car alone - Females:
| La Porte: | 88.4% (4,198) |
| Texas: | 83.0% (4,557,023) |
Carpooled - Females:
| La Porte: | 9.1% (434) |
| Texas: | 12.3% (674,818) |
Walked - Females:
| La Porte: | 0.6% (30) |
| Texas: | 1.8% (99,911) |
Other means - Females:
| La Porte: | 1.9% (89) |
| Texas: | 1.7% (95,481) |
Private vehicle occupancy

Drove alone:
| La Porte: | 88.3% (13,017) |
| Texas: | 87.6% (10,283,021) |
In 2 person carpool:
| La Porte: | 10.0% (1,481) |
| Texas: | 9.0% (1,052,595) |
In 3 person carpool:
| La Porte: | 0.7% (104) |
| Texas: | 2.1% (244,139) |
In 4 person carpool:
| La Porte: | 0.2% (26) |
| Texas: | 0.8% (92,732) |
In 5-6 person carpool:
| La Porte: | 0.5% (76) |
| Texas: | 0.4% (44,947) |

Drove alone:
| La Porte: | 89.9% (13,378) |
| Texas: | 84.3% (7,115,590) |
In 2 person carpool:
| La Porte: | 8.7% (1,298) |
| Texas: | 11.6% (982,994) |
In 3 person carpool:
| La Porte: | 0.8% (120) |
| Texas: | 2.4% (201,602) |
In 4 person carpool:
| La Porte: | 0.3% (44) |
| Texas: | 1.0% (83,518) |
In 5-6 person carpool:
| La Porte: | 0.3% (39) |
| Texas: | 0.5% (40,662) |
In 7+ person carpool:
| La Porte: | 0.0% (6) |
| Texas: | 0.2% (17,236) |
Class of workers

Employee of private company:
| La Porte: | 75.5% (12,936) |
| Texas: | 69.6% (10,139,666) |
Self-employed in own incorporated business:
| La Porte: | 2.7% (464) |
| Texas: | 3.5% (516,446) |
Private not-for-profit wage and salary workers:
| La Porte: | 4.7% (811) |
| Texas: | 6.0% (870,454) |
Local government workers:
| La Porte: | 8.0% (1,367) |
| Texas: | 7.6% (1,109,799) |
State government workers:
| La Porte: | 3.5% (601) |
| Texas: | 3.8% (558,618) |
Federal government workers:
| La Porte: | 1.0% (166) |
| Texas: | 2.5% (357,298) |
Self-employed workers in own not incorporated business:
| La Porte: | 4.6% (790) |
| Texas: | 6.8% (998,270) |
Unpaid family workers:
| La Porte: | 0.0% (7) |
| Texas: | 0.2% (27,882) |

Employee of private company:
| La Porte: | 79.5% (12,519) |
| Texas: | 69.6% (6,425,274) |
Self-employed in own incorporated business:
| La Porte: | 1.8% (290) |
| Texas: | 2.7% (250,864) |
Private not-for-profit wage and salary workers:
| La Porte: | 3.6% (564) |
| Texas: | 5.7% (526,631) |
Local government workers:
| La Porte: | 6.9% (1,083) |
| Texas: | 6.6% (608,479) |
State government workers:
| La Porte: | 3.4% (538) |
| Texas: | 5.4% (501,082) |
Federal government workers:
| La Porte: | 1.6% (249) |
| Texas: | 2.6% (237,177) |
Self-employed workers in own not incorporated business:
| La Porte: | 3.0% (474) |
| Texas: | 7.1% (653,527) |
Unpaid family workers:
| La Porte: | 0.2% (29) |
| Texas: | 0.3% (31,338) |

Employee of private company - Males:
| La Porte: | 79.2% (7,266) |
| Texas: | 73.1% (5,788,450) |
Self-employed in own incorporated business - Males:
| La Porte: | 3.2% (291) |
| Texas: | 4.2% (332,655) |
Private not-for-profit wage and salary workers - Males:
| La Porte: | 2.6% (237) |
| Texas: | 4.1% (323,476) |
Local government workers - Males:
| La Porte: | 5.3% (491) |
| Texas: | 5.1% (405,467) |
State government workers - Males:
| La Porte: | 2.8% (253) |
| Texas: | 3.0% (236,706) |
Federal government workers - Males:
| La Porte: | 1.4% (125) |
| Texas: | 2.7% (211,629) |
Self-employed workers in own not incorporated business - Males:
| La Porte: | 5.6% (510) |
| Texas: | 7.7% (609,246) |

Employee of private company - Females:
| La Porte: | 71.1% (5,670) |
| Texas: | 65.4% (4,351,216) |
Self-employed in own incorporated business - Females:
| La Porte: | 2.2% (173) |
| Texas: | 2.8% (183,791) |
Private not-for-profit wage and salary workers - Females:
| La Porte: | 7.2% (574) |
| Texas: | 8.2% (546,978) |
Local government workers - Females:
| La Porte: | 11.0% (876) |
| Texas: | 10.6% (704,332) |
State government workers - Females:
| La Porte: | 4.4% (348) |
| Texas: | 4.8% (321,912) |
Federal government workers - Females:
| La Porte: | 0.5% (41) |
| Texas: | 2.2% (145,669) |
Self-employed workers in own not incorporated business - Females:
| La Porte: | 3.5% (279) |
| Texas: | 5.8% (389,024) |
Unpaid family workers - Females:
| La Porte: | 0.1% (7) |
| Texas: | 0.2% (15,276) |