Work and Jobs in Lexington, New York (NY) Detailed Stats
Occupations, Industries, Unemployment, Workers, Commute

Recent posts about work in Lexington, New York on our local forum with over 2,400,000 registered users:
 | Why Black Workers in NYC Are Unemployed at Critical Levels (119 replies) |
| Buffalo-Boom/Bust II (619 replies) |
| When Were Privately Owned Public Spaces in Office Building Lobbies Reopened to the Public? (0 replies) |
| Penn Access Metronorth work beginning? (104 replies) |
| Is White Plains growing or in decline? (44 replies) |
| Former Tesla workers describe hostile workplace at Buffalo facility (18 replies) |
Latest news about work in Lexington, NY collected exclusively by city-data.com from local newspapers, TV, and radio stations
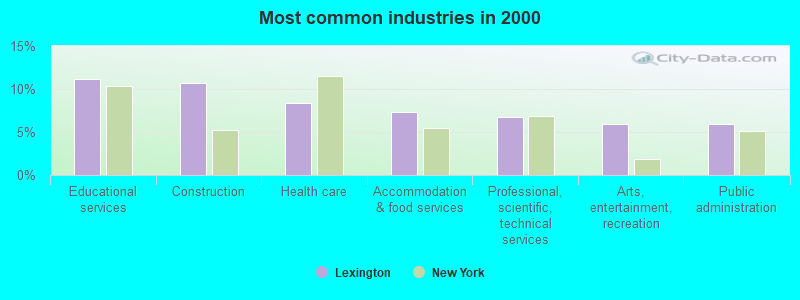
The most common industries in Lexington are: Educational services (11.2% of civilian employees), Construction (10.6% of civilian employees), Health care (8.4% of civilian employees). 49.6% of workers are employees of private companies, which is 28.5% less than the rate of 63.7% across the entire state of New York.
Most common industries
Most common industries | |||
|---|---|---|---|
Industry | All | Males | Females |
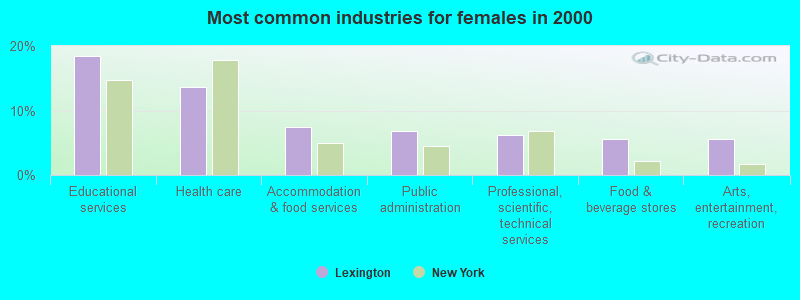
| Educational services | 11.2% (40) | 5.1% (10) | 18.5% (30) |
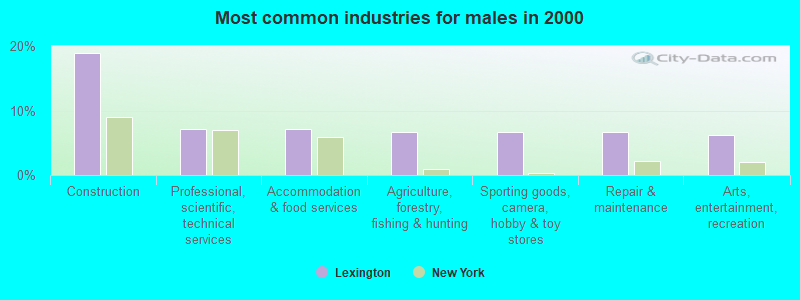
| Construction | 10.6% (38) | 19.0% (37) | 0.6% (1) |
| Health care | 8.4% (30) | 4.1% (8) | 13.6% (22) |
| Accommodation and food services | 7.3% (26) | 7.2% (14) | 7.4% (12) |
| Professional, scientific, and technical services | 6.7% (24) | 7.2% (14) | 6.2% (10) |
| Arts, entertainment, and recreation | 5.9% (21) | 6.2% (12) | 5.6% (9) |
| Public administration | 5.9% (21) | 5.1% (10) | 6.8% (11) |
| Sporting goods, camera, and hobby and toy stores | 4.8% (17) | 6.7% (13) | 2.5% (4) |
| Repair and maintenance | 4.2% (15) | 6.7% (13) | 1.2% (2) |
| Agriculture, forestry, fishing and hunting | 3.9% (14) | 6.7% (13) | 0.6% (1) |
| Administrative and support and waste management services | 3.6% (13) | 3.6% (7) | 3.7% (6) |
| Building material and garden equipment and supplies dealers | 2.5% (9) | 3.6% (7) | 1.2% (2) |
| Food and beverage stores | 2.5% (9) | 0.0% (0) | 5.6% (9) |
| Used merchandise, gift, novelty, and souvenir, and other miscellaneous stores | 2.5% (9) | 2.6% (5) | 2.5% (4) |
| Religious, grantmaking, civic, professional, and similar organizations | 2.2% (8) | 1.5% (3) | 3.1% (5) |
| Real estate and rental and leasing | 2.0% (7) | 2.6% (5) | 1.2% (2) |
| Mining, quarrying, and oil and gas extraction | 1.7% (6) | 3.1% (6) | 0.0% (0) |
| Finance and insurance | 1.7% (6) | 0.0% (0) | 3.7% (6) |
| Publishing, and motion picture and sound recording industries | 1.4% (5) | 0.0% (0) | 3.1% (5) |
| Private households | 1.1% (4) | 1.0% (2) | 1.2% (2) |
| Pharmacies and drug stores | 0.8% (3) | 1.5% (3) | 0.0% (0) |
| Hardware, plumbing and heating equipment, and supplies merchant wholesalers | 0.8% (3) | 1.5% (3) | 0.0% (0) |
| Miscellaneous nondurable goods merchant wholesalers | 0.8% (3) | 0.0% (0) | 1.9% (3) |
| Other direct selling establishments | 0.8% (3) | 0.0% (0) | 1.9% (3) |
| Fuel dealers | 0.6% (2) | 0.0% (0) | 1.2% (2) |
| U. S. Postal service | 0.6% (2) | 0.0% (0) | 1.2% (2) |
| Warehousing and storage | 0.6% (2) | 0.0% (0) | 1.2% (2) |
| Utilities | 0.6% (2) | 1.0% (2) | 0.0% (0) |
| Motor vehicle and parts dealers | 0.6% (2) | 1.0% (2) | 0.0% (0) |
| Apparel, fabrics, and notions merchant wholesalers | 0.6% (2) | 0.0% (0) | 1.2% (2) |
| Lumber and other construction materials merchant wholesalers | 0.6% (2) | 1.0% (2) | 0.0% (0) |
| Metal and metal products | 0.6% (2) | 1.0% (2) | 0.0% (0) |
| Apparel | 0.6% (2) | 0.0% (0) | 1.2% (2) |
| Beverage and tobacco products | 0.6% (2) | 0.0% (0) | 1.2% (2) |
| Rail transportation | 0.6% (2) | 1.0% (2) | 0.0% (0) |
| Machinery | 0.3% (1) | 0.0% (0) | 0.6% (1) |
Unemployment in Lexington
- Unemployment by race in 2000
- Unemployment rate for White non-Hispanic residents
- 2.6%Males
- 3.2%Females
Time leaving home to go to work

<5am:
| Lexington: | 4.3% (15) |
| New York: | 2.4% (194,562) |
5:30am:
| Lexington: | 4.0% (14) |
| New York: | 2.1% (174,328) |
6am:
| Lexington: | 5.7% (20) |
| New York: | 3.1% (253,826) |
6:30am:
| Lexington: | 6.2% (22) |
| New York: | 7.0% (573,349) |
7am:
| Lexington: | 7.7% (27) |
| New York: | 8.6% (706,982) |
7:30am:
| Lexington: | 21.9% (77) |
| New York: | 14.0% (1,147,579) |
8am:
| Lexington: | 9.1% (32) |
| New York: | 14.8% (1,213,706) |
8:30am:
| Lexington: | 9.4% (33) |
| New York: | 13.9% (1,144,298) |
9am:
| Lexington: | 8.5% (30) |
| New York: | 7.5% (614,475) |
10am:
| Lexington: | 6.5% (23) |
| New York: | 7.2% (593,377) |
11am:
| Lexington: | 2.8% (10) |
| New York: | 2.7% (224,011) |
12pm:
| Lexington: | 0.6% (2) |
| New York: | 1.3% (105,049) |
4pm:
| Lexington: | 2.8% (10) |
| New York: | 6.3% (517,309) |
>4pm:
| Lexington: | 3.1% (11) |
| New York: | 6.1% (501,196) |
Travel time to work


Less than 5 minutes:
| Lexington: | 8.8% (31) |
| New York: | 2.7% (219,036) |
5 to 9 minutes:
| Lexington: | 4.0% (14) |
| New York: | 8.3% (680,270) |
10 to 14 minutes:
| Lexington: | 9.4% (33) |
| New York: | 11.6% (956,590) |
15 to 19 minutes:
| Lexington: | 8.8% (31) |
| New York: | 12.4% (1,020,084) |
20 to 24 minutes:
| Lexington: | 12.8% (45) |
| New York: | 12.3% (1,013,757) |
25 to 29 minutes:
| Lexington: | 10.2% (36) |
| New York: | 4.9% (399,384) |
30 to 34 minutes:
| Lexington: | 8.5% (30) |
| New York: | 12.9% (1,058,688) |
35 to 39 minutes:
| Lexington: | 0.6% (2) |
| New York: | 2.5% (203,722) |
40 to 44 minutes:
| Lexington: | 2.8% (10) |
| New York: | 4.1% (340,311) |
45 to 59 minutes:
| Lexington: | 6.2% (22) |
| New York: | 9.8% (806,556) |
60 to 89 minutes:
| Lexington: | 6.2% (22) |
| New York: | 10.3% (848,185) |
90 or more minutes:
| Lexington: | 14.2% (50) |
| New York: | 5.1% (417,464) |
Means of transportation to work


Drove car alone:
| Lexington: | 73.6% (259) |
| New York: | 56.3% (4,620,178) |
Carpooled:
| Lexington: | 12.2% (43) |
| New York: | 9.2% (756,918) |
Bus or trolley bus:
| Lexington: | 0.6% (2) |
| New York: | 5.8% (475,389) |
Subway or elevated:
| Lexington: | 0.6% (2) |
| New York: | 14.8% (1,217,009) |
Railroad:
| Lexington: | 1.7% (6) |
| New York: | 2.8% (228,215) |
Walked:
| Lexington: | 3.1% (11) |
| New York: | 6.2% (511,721) |
Other means:
| Lexington: | 0.9% (3) |
| New York: | 0.5% (40,375) |
Private vehicle occupancy

Drove alone:
| Lexington: | 85.8% (259) |
| New York: | 85.9% (4,620,178) |
In 2 person carpool:
| Lexington: | 13.6% (41) |
| New York: | 11.0% (590,255) |
In 5-6 person carpool:
| Lexington: | 0.7% (2) |
| New York: | 0.3% (16,644) |
Class of workers

Employee of private company:
| Lexington: | 49.6% (177) |
| New York: | 63.7% (5,340,134) |
Self-employed in own incorporated business:
| Lexington: | 3.9% (14) |
| New York: | 3.4% (283,619) |
Private not-for-profit wage and salary workers:
| Lexington: | 7.6% (27) |
| New York: | 9.7% (810,356) |
Local government workers:
| Lexington: | 14.0% (50) |
| New York: | 10.2% (858,120) |
State government workers:
| Lexington: | 5.6% (20) |
| New York: | 4.6% (383,673) |
Federal government workers:
| Lexington: | 0.6% (2) |
| New York: | 2.2% (185,100) |
Self-employed workers in own not incorporated business:
| Lexington: | 18.8% (67) |
| New York: | 6.0% (501,068) |

Employee of private company - Males:
| Lexington: | 46.7% (91) |
| New York: | 66.2% (2,902,064) |
Self-employed in own incorporated business - Males:
| Lexington: | 5.6% (11) |
| New York: | 4.9% (215,651) |
Private not-for-profit wage and salary workers - Males:
| Lexington: | 5.1% (10) |
| New York: | 6.3% (277,787) |
Local government workers - Males:
| Lexington: | 9.2% (18) |
| New York: | 8.7% (380,426) |
State government workers - Males:
| Lexington: | 8.2% (16) |
| New York: | 4.1% (181,784) |
Self-employed workers in own not incorporated business - Males:
| Lexington: | 25.1% (49) |
| New York: | 7.1% (312,497) |

Employee of private company - Females:
| Lexington: | 53.1% (86) |
| New York: | 60.9% (2,438,070) |
Self-employed in own incorporated business - Females:
| Lexington: | 1.9% (3) |
| New York: | 1.7% (67,968) |
Private not-for-profit wage and salary workers - Females:
| Lexington: | 10.5% (17) |
| New York: | 13.3% (532,569) |
Local government workers - Females:
| Lexington: | 19.8% (32) |
| New York: | 11.9% (477,694) |
State government workers - Females:
| Lexington: | 2.5% (4) |
| New York: | 5.0% (201,889) |
Federal government workers - Females:
| Lexington: | 1.2% (2) |
| New York: | 2.1% (82,453) |
Self-employed workers in own not incorporated business - Females:
| Lexington: | 11.1% (18) |
| New York: | 4.7% (188,571) |