Work and Jobs in Loveland, Colorado (CO) Detailed Stats
Occupations, Industries, Unemployment, Workers, Commute
Settings
X


Recent posts about work in Loveland, Colorado on our local forum with over 2,400,000 registered users:
 | Future Population Explosion In Loveland? (59 replies) |
| Colorado Springs vs. Loveland (5 replies) |
| How is the Commute from Loveland to Longmont? (43 replies) |
| Planning Loveland 2018 Trip (190 replies) |
| Loveland/FoCo for a young family? (4 replies) |
| Where to sightsee; where to live in Ft. Collins, Loveland, or a neighborhood within 20 minutes from Trader Joe's (28 replies) |
Latest news about work in Loveland, CO collected exclusively by city-data.com from local newspapers, TV, and radio stations
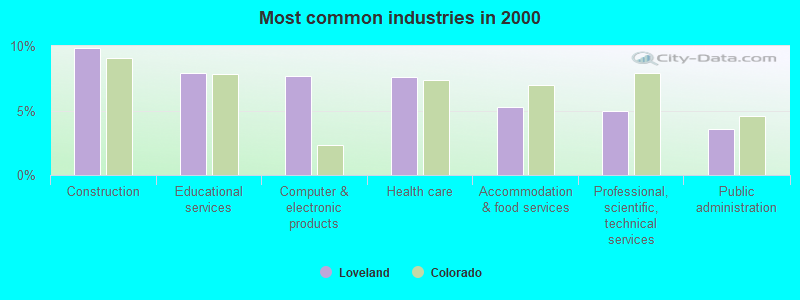
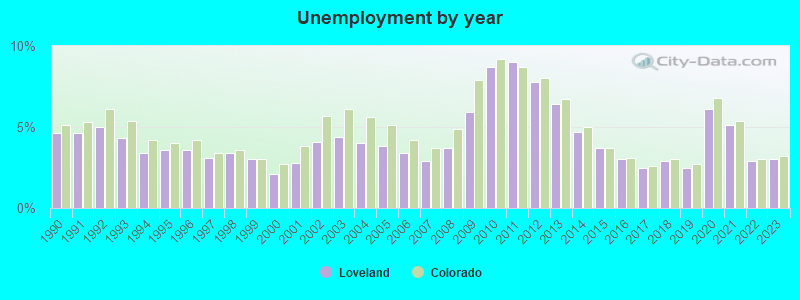
The unemployment rate in 2023 in Loveland, CO was 3.0%, which was 6.7% less than the unemployment rate of 3.2% across the entire state of Colorado. Compared to the unemployment rate of 6.4% in 2013, this represents a decrease of 113.3%. The most common industries in Loveland are: Construction (9.9% of civilian employees), Educational services (7.9% of civilian employees), Computer & electronic products (7.6% of civilian employees). 80.0% of workers work in Larimer County and 15.5% of all workers work at home. 69.6% of workers are employees of private companies, which is 4.3% greater than the rate of 66.6% across the entire state of Colorado.
Whole page based on the data from 2000 / 2022 when the population of Loveland, Colorado was 50,608 / 77,890
Whole page based on the data from 2000 / 2022 when the population of Loveland, Colorado was 50,608 / 77,890
Most common industries
Most common industries | |||
|---|---|---|---|
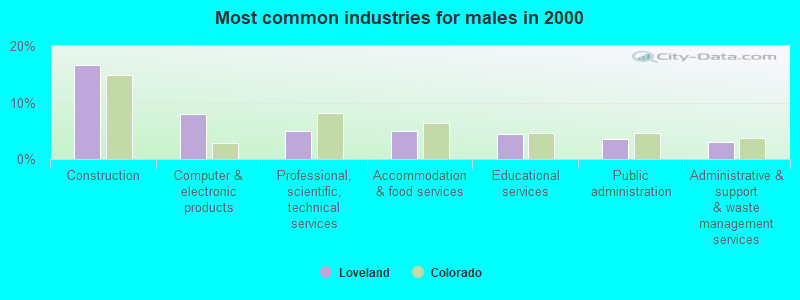
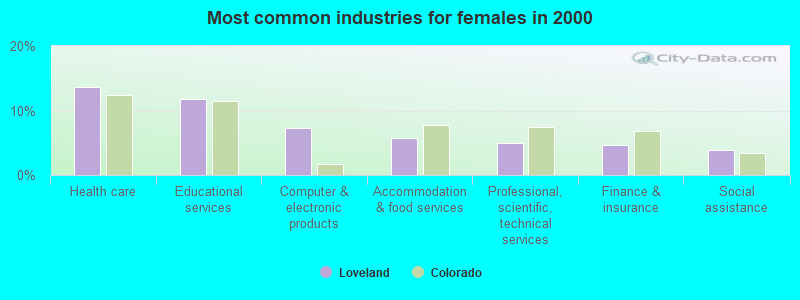
Industry | All | Males | Females |
| Construction | 9.9% (2,584) | 16.7% (2,330) | 2.1% (254) |
| Educational services | 7.9% (2,069) | 4.5% (626) | 11.8% (1,443) |
| Computer and electronic products | 7.6% (2,000) | 7.9% (1,100) | 7.4% (900) |
| Health care | 7.6% (1,981) | 2.2% (306) | 13.7% (1,675) |
| Accommodation and food services | 5.3% (1,383) | 4.9% (680) | 5.7% (703) |
| Professional, scientific, and technical services | 5.0% (1,300) | 4.9% (685) | 5.0% (615) |
| Public administration | 3.6% (935) | 3.5% (482) | 3.7% (453) |
| Administrative and support and waste management services | 3.3% (854) | 3.1% (426) | 3.5% (428) |
| Finance and insurance | 3.2% (843) | 2.0% (279) | 4.6% (564) |
| Food and beverage stores | 3.2% (841) | 3.0% (413) | 3.5% (428) |
| Department and other general merchandise stores | 2.8% (741) | 2.6% (368) | 3.0% (373) |
| Real estate and rental and leasing | 2.3% (604) | 1.7% (235) | 3.0% (369) |
| Publishing, and motion picture and sound recording industries | 2.1% (557) | 1.6% (217) | 2.8% (340) |
| Social assistance | 1.9% (494) | 0.2% (28) | 3.8% (466) |
| Arts, entertainment, and recreation | 1.7% (446) | 1.5% (203) | 2.0% (243) |
| Repair and maintenance | 1.7% (437) | 2.8% (396) | 0.3% (41) |
| Building material and garden equipment and supplies dealers | 1.6% (421) | 2.3% (322) | 0.8% (99) |
| Miscellaneous manufacturing | 1.5% (383) | 1.3% (178) | 1.7% (205) |
| Motor vehicle and parts dealers | 1.4% (377) | 2.2% (302) | 0.6% (75) |
| Radio, TV, and computer stores | 1.4% (366) | 1.8% (252) | 0.9% (114) |
| Religious, grantmaking, civic, professional, and similar organizations | 1.4% (358) | 1.2% (174) | 1.5% (184) |
| Chemicals | 1.3% (334) | 2.0% (275) | 0.5% (59) |
| Metal and metal products | 1.2% (325) | 1.6% (222) | 0.8% (103) |
| Machinery | 1.2% (302) | 1.5% (211) | 0.7% (91) |
| Personal and laundry services | 1.1% (282) | 0.6% (89) | 1.6% (193) |
| Used merchandise, gift, novelty, and souvenir, and other miscellaneous stores | 1.0% (256) | 0.7% (93) | 1.3% (163) |
| Printing and related support activities | 1.0% (255) | 1.2% (174) | 0.7% (81) |
| Broadcasting and telecommunications | 0.9% (242) | 1.2% (161) | 0.7% (81) |
| Plastics and rubber products | 0.9% (237) | 1.0% (138) | 0.8% (99) |
| Utilities | 0.9% (226) | 1.3% (177) | 0.4% (49) |
| Furniture and related product manufacturing | 0.8% (204) | 0.9% (130) | 0.6% (74) |
| Agriculture, forestry, fishing and hunting | 0.8% (203) | 1.1% (158) | 0.4% (45) |
| Data processing, libraries, and other information services | 0.6% (168) | 0.6% (83) | 0.7% (85) |
| Groceries and related products merchant wholesalers | 0.6% (165) | 1.0% (133) | 0.3% (32) |
| Other transportation, and support activities, and couriers | 0.6% (152) | 1.0% (133) | 0.2% (19) |
| Food | 0.6% (144) | 0.8% (108) | 0.3% (36) |
| Furniture and home furnishings, and household appliance stores | 0.5% (140) | 0.7% (100) | 0.3% (40) |
| Transportation equipment | 0.5% (139) | 0.8% (115) | 0.2% (24) |
| Other direct selling establishments | 0.5% (139) | 0.1% (17) | 1.0% (122) |
| Clothing and accessories, including shoe, stores | 0.5% (132) | 0.4% (50) | 0.7% (82) |
| U. S. Postal service | 0.5% (128) | 0.7% (93) | 0.3% (35) |
| Air transportation | 0.5% (125) | 0.7% (100) | 0.2% (25) |
| Electrical equipment, appliances, and components | 0.5% (122) | 0.7% (100) | 0.2% (22) |
| Pharmacies and drug stores | 0.4% (116) | 0.2% (24) | 0.8% (92) |
| Private households | 0.4% (115) | 0.1% (18) | 0.8% (97) |
| Miscellaneous nondurable goods merchant wholesalers | 0.4% (106) | 0.2% (30) | 0.6% (76) |
| Machinery, equipment, and supplies merchant wholesalers | 0.4% (102) | 0.7% (94) | 0.1% (8) |
| Truck transportation | 0.4% (94) | 0.6% (86) | 0.1% (8) |
| Gasoline stations | 0.3% (90) | 0.3% (47) | 0.4% (43) |
| Mining, quarrying, and oil and gas extraction | 0.3% (78) | 0.5% (64) | 0.1% (14) |
| Electrical and electronic goods merchant wholesalers | 0.3% (74) | 0.5% (65) | 0.1% (9) |
| Professional and commercial equipment and supplies merchant wholesalers | 0.3% (71) | 0.4% (49) | 0.2% (22) |
| Sporting goods, camera, and hobby and toy stores | 0.3% (69) | 0.3% (38) | 0.3% (31) |
| Warehousing and storage | 0.3% (69) | 0.4% (62) | 0.1% (7) |
| Wood products | 0.3% (69) | 0.4% (57) | 0.1% (12) |
| Nonmetallic mineral products | 0.3% (69) | 0.4% (49) | 0.2% (20) |
| Miscellaneous durable goods merchant wholesalers | 0.3% (67) | 0.3% (40) | 0.2% (27) |
| Office supplies and stationery stores | 0.2% (57) | 0.3% (47) | 0.1% (10) |
| Hardware, plumbing and heating equipment, and supplies merchant wholesalers | 0.2% (55) | 0.3% (37) | 0.1% (18) |
| Motor vehicles, parts and supplies merchant wholesalers | 0.2% (50) | 0.3% (35) | 0.1% (15) |
| Music stores | 0.1% (39) | 0.2% (23) | 0.1% (16) |
| Beverage and tobacco products | 0.1% (36) | 0.1% (14) | 0.2% (22) |
| Health and personal care, except drug, stores | 0.1% (36) | 0.1% (15) | 0.2% (21) |
| Lumber and other construction materials merchant wholesalers | 0.1% (35) | 0.2% (30) | 0.0% (5) |
| Rail transportation | 0.1% (33) | 0.2% (33) | 0.0% (0) |
| Book stores and news dealers | 0.1% (29) | 0.0% (6) | 0.2% (23) |
| Recyclable material merchant wholesalers | 0.1% (26) | 0.2% (26) | 0.0% (0) |
| Furniture and home furnishing merchant wholesalers | 0.1% (17) | 0.1% (17) | 0.0% (0) |
| Textile mills and textile products | 0.1% (17) | 0.1% (17) | 0.0% (0) |
Unemployment in Loveland
- Unemployment by race in 2022
- Unemployment rate for White non-Hispanic residents
- 3.1%Males
- 6.9%Females
- Unemployment rate for American Indian and Alaska Native residents
- 7.4%Males
- Unemployment rate for other race residents
- 0.9%Males
- 6.4%Females
- Unemployment rate for two or more race residents
- 3.8%Males
- 3.2%Females
- Unemployment rate for Hispanic or Latino residents
- 1.7%Males
- 6.7%Females
- Unemployment by race in 2000
- Unemployment rate for White non-Hispanic residents
- 2.7%Males
- 2.5%Females
- Unemployment rate for Asian residents
- 35.6%Females
- Unemployment rate for other race residents
- 10.1%Males
- 7.2%Females
- Unemployment rate for two or more race residents
- 3.6%Males
- 3.1%Females
- Unemployment rate for Hispanic or Latino residents
- 5.9%Males
- 13.7%Females
Unemployment in 2023:
| Loveland: | 3.0% |
| Colorado: | 3.2% |
Unemployment in 2022:
| Loveland: | 2.9% |
| Colorado: | 3.0% |
Unemployment in 2021:
| Loveland: | 5.1% |
| Colorado: | 5.4% |
Unemployment in 2020:
| Loveland: | 6.1% |
| Colorado: | 6.8% |
Unemployment in 2019:
| Loveland: | 2.5% |
| Colorado: | 2.7% |
Unemployment in 2018:
| Loveland: | 2.9% |
| Colorado: | 3.0% |
Unemployment in 2017:
| Loveland: | 2.5% |
| Colorado: | 2.6% |
Unemployment in 2016:
| Loveland: | 3.0% |
| Colorado: | 3.1% |
Unemployment in 2015:
| Loveland: | 3.7% |
| Colorado: | 3.7% |
Unemployment in 2014:
| Loveland: | 4.7% |
| Colorado: | 5.0% |
Unemployment in 2013:
| Loveland: | 6.4% |
| Colorado: | 6.7% |
Unemployment in 2012:
| Loveland: | 7.8% |
| Colorado: | 8.0% |
Unemployment in 2011:
| Loveland: | 9.0% |
| Colorado: | 8.7% |
Unemployment in 2010:
| Loveland: | 8.7% |
| Colorado: | 9.2% |
Unemployment in 2009:
| Loveland: | 5.9% |
| Colorado: | 7.9% |
Unemployment in 2008:
| Loveland: | 3.7% |
| Colorado: | 4.9% |
Unemployment in 2007:
| Loveland: | 2.9% |
| Colorado: | 3.7% |
Unemployment in 2006:
| Loveland: | 3.4% |
| Colorado: | 4.2% |
Unemployment in 2005:
| Loveland: | 3.8% |
| Colorado: | 5.1% |
Unemployment in 2004:
| Loveland: | 4.0% |
| Colorado: | 5.6% |
Unemployment in 2003:
| Loveland: | 4.4% |
| Colorado: | 6.1% |
Unemployment in 2002:
| Loveland: | 4.1% |
| Colorado: | 5.7% |
Unemployment in 2001:
| Loveland: | 2.8% |
| Colorado: | 3.8% |
Unemployment in 2000:
| Loveland: | 2.1% |
| Colorado: | 2.7% |
Unemployment in 1999:
| Loveland: | 3.0% |
| Colorado: | 3.0% |
Unemployment in 1998:
| Loveland: | 3.4% |
| Colorado: | 3.6% |
Unemployment in 1997:
| Loveland: | 3.1% |
| Colorado: | 3.4% |
Unemployment in 1996:
| Loveland: | 3.6% |
| Colorado: | 4.2% |
Unemployment in 1995:
| Loveland: | 3.6% |
| Colorado: | 4.0% |
Unemployment in 1994:
| Loveland: | 3.4% |
| Colorado: | 4.2% |
Unemployment in 1993:
| Loveland: | 4.3% |
| Colorado: | 5.4% |
Unemployment in 1992:
| Loveland: | 5.0% |
| Colorado: | 6.1% |
Unemployment in 1991:
| Loveland: | 4.6% |
| Colorado: | 5.3% |
Unemployment in 1990:
| Loveland: | 4.6% |
| Colorado: | 5.1% |
Time leaving home to go to work

12:00 a.m. to 4:59 a.m.:
| Loveland: | 7.6% (2,626) |
| Colorado: | 4.7% (115,593) |
5:00 a.m. to 5:29 a.m.:
| Loveland: | 5.1% (1,769) |
| Colorado: | 3.8% (92,435) |
5:30 a.m. to 5:59 a.m.:
| Loveland: | 5.0% (1,731) |
| Colorado: | 5.0% (123,851) |
6:00 a.m. to 6:29 a.m.:
| Loveland: | 10.4% (3,622) |
| Colorado: | 8.6% (210,736) |
6:30 a.m. to 6:59 a.m.:
| Loveland: | 11.4% (3,953) |
| Colorado: | 10.2% (250,710) |
7:00 a.m. to 7:29 a.m.:
| Loveland: | 15.4% (5,323) |
| Colorado: | 14.7% (362,963) |
7:30 a.m. to 7:59 a.m.:
| Loveland: | 12.0% (4,174) |
| Colorado: | 12.7% (311,366) |
8:00 a.m. to 8:29 a.m.:
| Loveland: | 8.4% (2,920) |
| Colorado: | 12.3% (302,330) |
8:30 a.m. to 8:59 a.m.:
| Loveland: | 7.9% (2,729) |
| Colorado: | 5.4% (131,963) |
9:00 a.m. to 9:59 a.m.:
| Loveland: | 4.4% (1,512) |
| Colorado: | 7.2% (175,993) |
10:00 a.m. to 10:59 a.m.:
| Loveland: | 2.7% (924) |
| Colorado: | 3.2% (78,921) |
11:00 a.m. to 11:59 a.m.:
| Loveland: | 1.2% (407) |
| Colorado: | 1.4% (35,132) |
12:00 p.m. to 3:59 p.m.:
| Loveland: | 3.6% (1,251) |
| Colorado: | 5.8% (141,725) |
4:00 p.m. to 11:59 p.m.:
| Loveland: | 5.0% (1,726) |
| Colorado: | 5.2% (127,420) |

<5am:
| Loveland: | 2.9% (738) |
| Colorado: | 2.9% (62,865) |
5:30am:
| Loveland: | 2.7% (706) |
| Colorado: | 2.6% (57,037) |
6am:
| Loveland: | 5.3% (1,360) |
| Colorado: | 4.6% (100,940) |
6:30am:
| Loveland: | 9.4% (2,438) |
| Colorado: | 9.0% (197,321) |
7am:
| Loveland: | 12.0% (3,094) |
| Colorado: | 11.3% (246,749) |
7:30am:
| Loveland: | 16.3% (4,196) |
| Colorado: | 15.4% (336,717) |
8am:
| Loveland: | 13.6% (3,520) |
| Colorado: | 15.0% (329,151) |
8:30am:
| Loveland: | 11.0% (2,843) |
| Colorado: | 10.0% (219,216) |
9am:
| Loveland: | 4.5% (1,149) |
| Colorado: | 4.8% (105,802) |
10am:
| Loveland: | 4.0% (1,026) |
| Colorado: | 5.2% (114,870) |
11am:
| Loveland: | 2.0% (518) |
| Colorado: | 2.2% (48,948) |
12pm:
| Loveland: | 0.7% (181) |
| Colorado: | 1.0% (22,224) |
4pm:
| Loveland: | 6.1% (1,585) |
| Colorado: | 5.6% (122,019) |
>4pm:
| Loveland: | 5.5% (1,430) |
| Colorado: | 5.5% (119,635) |

12:00 a.m. to 4:59 a.m. - Males:
| Loveland: | 10.6% (2,173) |
| Colorado: | 5.9% (79,881) |
5:00 a.m. to 5:29 a.m. - Males:
| Loveland: | 7.1% (1,465) |
| Colorado: | 5.0% (68,145) |
5:30 a.m. to 5:59 a.m. - Males:
| Loveland: | 6.1% (1,262) |
| Colorado: | 6.5% (88,204) |
6:00 a.m. to 6:29 a.m. - Males:
| Loveland: | 12.6% (2,605) |
| Colorado: | 10.5% (143,601) |
6:30 a.m. to 6:59 a.m. - Males:
| Loveland: | 12.5% (2,564) |
| Colorado: | 10.4% (141,916) |
7:00 a.m. to 7:29 a.m. - Males:
| Loveland: | 15.9% (3,272) |
| Colorado: | 14.3% (194,350) |
7:30 a.m. to 7:59 a.m. - Males:
| Loveland: | 8.2% (1,690) |
| Colorado: | 10.6% (144,090) |
8:00 a.m. to 8:29 a.m. - Males:
| Loveland: | 10.5% (2,164) |
| Colorado: | 11.5% (157,061) |
8:30 a.m. to 8:59 a.m. - Males:
| Loveland: | 2.6% (530) |
| Colorado: | 4.6% (62,737) |
9:00 a.m. to 9:59 a.m. - Males:
| Loveland: | 3.2% (669) |
| Colorado: | 6.2% (84,699) |
10:00 a.m. to 10:59 a.m. - Males:
| Loveland: | 2.5% (505) |
| Colorado: | 2.7% (36,864) |
11:00 a.m. to 11:59 a.m. - Males:
| Loveland: | 1.3% (260) |
| Colorado: | 1.3% (17,686) |
12:00 p.m. to 3:59 p.m. - Males:
| Loveland: | 3.4% (707) |
| Colorado: | 5.3% (72,846) |
4:00 p.m. to 11:59 p.m. - Males:
| Loveland: | 3.5% (727) |
| Colorado: | 5.1% (69,925) |

12:00 a.m. to 4:59 a.m. - Females:
| Loveland: | 3.2% (453) |
| Colorado: | 3.2% (35,712) |
5:00 a.m. to 5:29 a.m. - Females:
| Loveland: | 2.2% (304) |
| Colorado: | 2.2% (24,290) |
5:30 a.m. to 5:59 a.m. - Females:
| Loveland: | 3.3% (469) |
| Colorado: | 3.2% (35,647) |
6:00 a.m. to 6:29 a.m. - Females:
| Loveland: | 7.2% (1,017) |
| Colorado: | 6.1% (67,135) |
6:30 a.m. to 6:59 a.m. - Females:
| Loveland: | 9.9% (1,389) |
| Colorado: | 9.9% (108,794) |
7:00 a.m. to 7:29 a.m. - Females:
| Loveland: | 14.6% (2,051) |
| Colorado: | 15.3% (168,613) |
7:30 a.m. to 7:59 a.m. - Females:
| Loveland: | 17.6% (2,484) |
| Colorado: | 15.2% (167,276) |
8:00 a.m. to 8:29 a.m. - Females:
| Loveland: | 5.4% (756) |
| Colorado: | 13.2% (145,269) |
8:30 a.m. to 8:59 a.m. - Females:
| Loveland: | 15.6% (2,199) |
| Colorado: | 6.3% (69,226) |
9:00 a.m. to 9:59 a.m. - Females:
| Loveland: | 6.0% (843) |
| Colorado: | 8.3% (91,294) |
10:00 a.m. to 10:59 a.m. - Females:
| Loveland: | 3.0% (419) |
| Colorado: | 3.8% (42,057) |
11:00 a.m. to 11:59 a.m. - Females:
| Loveland: | 1.0% (147) |
| Colorado: | 1.6% (17,446) |
12:00 p.m. to 3:59 p.m. - Females:
| Loveland: | 3.9% (544) |
| Colorado: | 6.3% (68,879) |
4:00 p.m. to 11:59 p.m. - Females:
| Loveland: | 7.1% (999) |
| Colorado: | 5.2% (57,495) |
Travel time to work
Percentage of workers working in this county: 80.0%
Number of people working at home: 6,076 (15.5% of all workers)
Daytime population change due to commuting: -659 (-1.3%)
Workers who live and work in this city: 11,939 (46.3%)
Number of people working at home: 6,076 (15.5% of all workers)
Daytime population change due to commuting: -659 (-1.3%)
Workers who live and work in this city: 11,939 (46.3%)

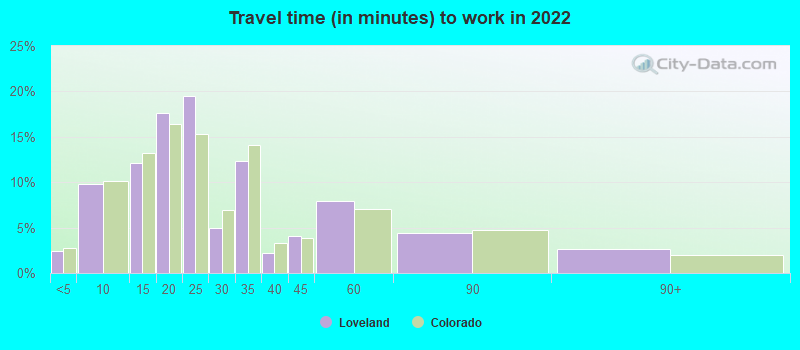

Less than 5 minutes:
| Loveland: | 2.4% (760) |
| Colorado: | 2.8% (68,148) |
5 to 9 minutes:
| Loveland: | 9.8% (3,136) |
| Colorado: | 10.2% (249,977) |
10 to 14 minutes:
| Loveland: | 12.2% (3,878) |
| Colorado: | 13.2% (325,799) |
15 to 19 minutes:
| Loveland: | 17.6% (5,606) |
| Colorado: | 16.4% (403,900) |
20 to 24 minutes:
| Loveland: | 19.5% (6,220) |
| Colorado: | 15.3% (377,005) |
25 to 29 minutes:
| Loveland: | 5.0% (1,591) |
| Colorado: | 7.0% (171,926) |
30 to 34 minutes:
| Loveland: | 12.3% (3,930) |
| Colorado: | 14.1% (347,229) |
35 to 39 minutes:
| Loveland: | 2.2% (695) |
| Colorado: | 3.4% (82,490) |
40 to 44 minutes:
| Loveland: | 4.1% (1,309) |
| Colorado: | 3.9% (96,028) |
45 to 59 minutes:
| Loveland: | 7.9% (2,528) |
| Colorado: | 7.0% (172,768) |
60 to 89 minutes:
| Loveland: | 4.4% (1,389) |
| Colorado: | 4.8% (117,152) |
90 or more minutes:
| Loveland: | 2.7% (859) |
| Colorado: | 2.0% (49,250) |


Less than 5 minutes:
| Loveland: | 3.1% (788) |
| Colorado: | 3.3% (72,206) |
5 to 9 minutes:
| Loveland: | 14.5% (3,735) |
| Colorado: | 10.8% (235,913) |
10 to 14 minutes:
| Loveland: | 17.9% (4,616) |
| Colorado: | 14.5% (318,642) |
15 to 19 minutes:
| Loveland: | 13.4% (3,456) |
| Colorado: | 15.2% (333,306) |
20 to 24 minutes:
| Loveland: | 12.4% (3,206) |
| Colorado: | 14.3% (313,409) |
25 to 29 minutes:
| Loveland: | 5.1% (1,324) |
| Colorado: | 5.7% (125,679) |
30 to 34 minutes:
| Loveland: | 13.0% (3,367) |
| Colorado: | 12.8% (281,268) |
35 to 39 minutes:
| Loveland: | 2.1% (534) |
| Colorado: | 2.6% (56,816) |
40 to 44 minutes:
| Loveland: | 2.5% (651) |
| Colorado: | 3.3% (71,983) |
45 to 59 minutes:
| Loveland: | 6.2% (1,597) |
| Colorado: | 6.6% (145,592) |
60 to 89 minutes:
| Loveland: | 4.0% (1,039) |
| Colorado: | 3.9% (85,337) |
90 or more minutes:
| Loveland: | 1.8% (471) |
| Colorado: | 2.0% (43,343) |

Less than 5 minutes - Males:
| Loveland: | 0.9% (156) |
| Colorado: | 2.5% (34,040) |
5 to 9 minutes - Males:
| Loveland: | 9.8% (1,730) |
| Colorado: | 8.8% (120,289) |
10 to 14 minutes - Males:
| Loveland: | 10.4% (1,824) |
| Colorado: | 12.1% (165,016) |
15 to 19 minutes - Males:
| Loveland: | 17.4% (3,068) |
| Colorado: | 16.1% (219,838) |
20 to 24 minutes - Males:
| Loveland: | 23.4% (4,120) |
| Colorado: | 14.9% (202,357) |
25 to 29 minutes - Males:
| Loveland: | 4.8% (838) |
| Colorado: | 7.1% (96,086) |
30 to 34 minutes - Males:
| Loveland: | 9.0% (1,589) |
| Colorado: | 14.8% (201,235) |
35 to 39 minutes - Males:
| Loveland: | 2.1% (378) |
| Colorado: | 3.6% (49,196) |
40 to 44 minutes - Males:
| Loveland: | 2.7% (474) |
| Colorado: | 4.0% (54,096) |
45 to 59 minutes - Males:
| Loveland: | 9.0% (1,586) |
| Colorado: | 8.0% (108,737) |
60 to 89 minutes - Males:
| Loveland: | 5.6% (990) |
| Colorado: | 5.9% (80,004) |
90 or more minutes - Males:
| Loveland: | 4.9% (859) |
| Colorado: | 2.3% (31,393) |

Less than 5 minutes - Females:
| Loveland: | 4.2% (604) |
| Colorado: | 3.1% (34,108) |
5 to 9 minutes - Females:
| Loveland: | 9.8% (1,406) |
| Colorado: | 11.8% (129,688) |
10 to 14 minutes - Females:
| Loveland: | 14.4% (2,054) |
| Colorado: | 14.6% (160,783) |
15 to 19 minutes - Females:
| Loveland: | 17.8% (2,538) |
| Colorado: | 16.7% (184,062) |
20 to 24 minutes - Females:
| Loveland: | 14.7% (2,100) |
| Colorado: | 15.9% (174,648) |
25 to 29 minutes - Females:
| Loveland: | 5.3% (753) |
| Colorado: | 6.9% (75,840) |
30 to 34 minutes - Females:
| Loveland: | 16.4% (2,341) |
| Colorado: | 13.3% (145,994) |
35 to 39 minutes - Females:
| Loveland: | 2.2% (317) |
| Colorado: | 3.0% (33,294) |
40 to 44 minutes - Females:
| Loveland: | 5.8% (835) |
| Colorado: | 3.8% (41,932) |
45 to 59 minutes - Females:
| Loveland: | 6.6% (942) |
| Colorado: | 5.8% (64,031) |
60 to 89 minutes - Females:
| Loveland: | 2.8% (399) |
| Colorado: | 3.4% (37,148) |
Means of transportation to work
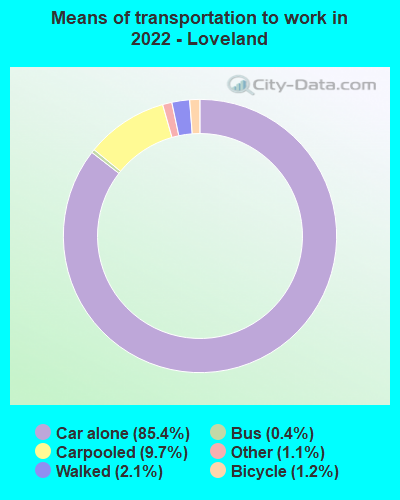
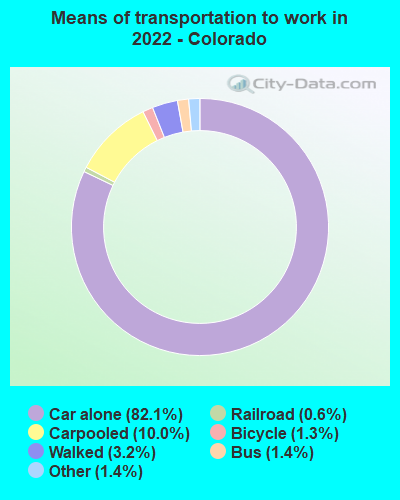
Drove car alone:
| Loveland: | 85.4% (30,363) |
| Colorado: | 82.1% (894,536) |
Carpooled:
| Loveland: | 9.7% (3,444) |
| Colorado: | 10.0% (123,758) |
Bus:
| Loveland: | 0.4% (150) |
| Colorado: | 1.4% (16,474) |
Long-distance train or commuter rail:
| Loveland: | 0.0% (2) |
| Colorado: | 0.1% (667) |
Ferryboat:
| Loveland: | 0.1% (24) |
| Colorado: | 0.0% (48) |
Bicycle:
| Loveland: | 1.2% (440) |
| Colorado: | 1.3% (11,214) |
Walked:
| Loveland: | 2.1% (755) |
| Colorado: | 3.2% (34,582) |
Other means:
| Loveland: | 1.1% (388) |
| Colorado: | 1.4% (11,553) |

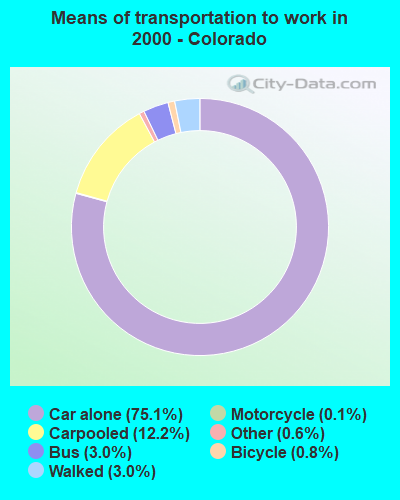
Drove car alone:
| Loveland: | 82.5% (21,293) |
| Colorado: | 75.1% (1,646,454) |
Carpooled:
| Loveland: | 10.8% (2,775) |
| Colorado: | 12.2% (268,168) |
Bus or trolley bus:
| Loveland: | 0.1% (23) |
| Colorado: | 3.0% (66,179) |
Streetcar or trolley car:
| Loveland: | 0.0% (11) |
| Colorado: | 0.0% (780) |
Motorcycle:
| Loveland: | 0.3% (65) |
| Colorado: | 0.1% (2,582) |
Bicycle:
| Loveland: | 0.4% (111) |
| Colorado: | 0.8% (16,905) |
Walked:
| Loveland: | 1.6% (411) |
| Colorado: | 3.0% (65,668) |
Other means:
| Loveland: | 0.4% (95) |
| Colorado: | 0.6% (14,202) |

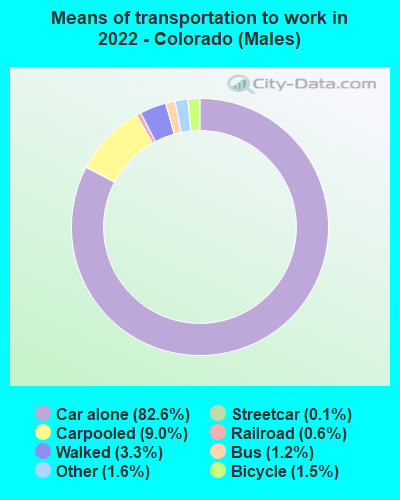
Drove car alone - Males:
| Loveland: | 84.2% (15,717) |
| Colorado: | 82.6% (894,536) |
Carpooled - Males:
| Loveland: | 9.7% (1,804) |
| Colorado: | 9.0% (123,758) |
Bus - Males:
| Loveland: | 0.8% (152) |
| Colorado: | 1.2% (16,474) |
Ferryboat - Males:
| Loveland: | 0.1% (24) |
| Colorado: | 0.0% (48) |
Bicycle - Males:
| Loveland: | 1.6% (299) |
| Colorado: | 1.5% (11,214) |
Walked - Males:
| Loveland: | 2.1% (383) |
| Colorado: | 3.3% (34,582) |
Other means - Males:
| Loveland: | 1.5% (281) |
| Colorado: | 1.6% (11,553) |

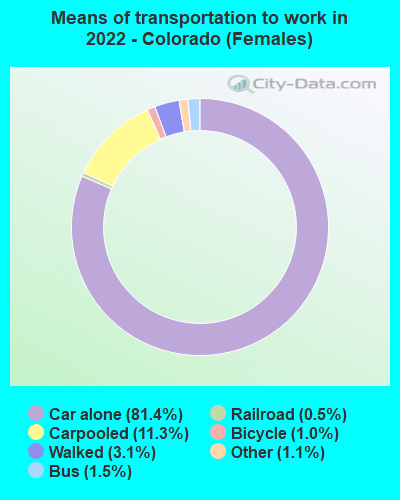
Drove car alone - Females:
| Loveland: | 86.6% (14,629) |
| Colorado: | 81.4% (894,536) |
Carpooled - Females:
| Loveland: | 9.7% (1,638) |
| Colorado: | 11.3% (123,758) |
Long-distance train or commuter rail - Females:
| Loveland: | 0.0% (2) |
| Colorado: | 0.1% (667) |
Bicycle - Females:
| Loveland: | 0.8% (142) |
| Colorado: | 1.0% (11,214) |
Walked - Females:
| Loveland: | 2.2% (371) |
| Colorado: | 3.1% (34,582) |
Other means - Females:
| Loveland: | 0.6% (109) |
| Colorado: | 1.1% (11,553) |
Private vehicle occupancy

Drove alone:
| Loveland: | 92.2% (28,882) |
| Colorado: | 89.1% (2,019,886) |
In 2 person carpool:
| Loveland: | 5.6% (1,746) |
| Colorado: | 8.0% (180,543) |
In 3 person carpool:
| Loveland: | 1.5% (468) |
| Colorado: | 1.8% (40,385) |
In 4 person carpool:
| Loveland: | 0.5% (162) |
| Colorado: | 0.7% (15,828) |
In 5-6 person carpool:
| Loveland: | 0.1% (22) |
| Colorado: | 0.3% (7,264) |
In 7+ person carpool:
| Loveland: | 0.1% (17) |
| Colorado: | 0.1% (2,223) |

Drove alone:
| Loveland: | 88.5% (21,293) |
| Colorado: | 86.0% (1,646,454) |
In 2 person carpool:
| Loveland: | 9.3% (2,245) |
| Colorado: | 11.0% (210,761) |
In 3 person carpool:
| Loveland: | 1.5% (358) |
| Colorado: | 2.0% (37,987) |
In 4 person carpool:
| Loveland: | 0.4% (95) |
| Colorado: | 0.6% (12,167) |
In 5-6 person carpool:
| Loveland: | 0.2% (41) |
| Colorado: | 0.3% (5,172) |
In 7+ person carpool:
| Loveland: | 0.1% (36) |
| Colorado: | 0.1% (2,081) |
Class of workers

Employee of private company:
| Loveland: | 69.6% (29,213) |
| Colorado: | 66.6% (2,085,890) |
Self-employed in own incorporated business:
| Loveland: | 3.4% (1,431) |
| Colorado: | 5.1% (159,992) |
Private not-for-profit wage and salary workers:
| Loveland: | 8.5% (3,557) |
| Colorado: | 8.1% (252,887) |
Local government workers:
| Loveland: | 7.9% (3,295) |
| Colorado: | 7.5% (236,118) |
State government workers:
| Loveland: | 3.1% (1,286) |
| Colorado: | 3.6% (111,796) |
Federal government workers:
| Loveland: | 1.3% (546) |
| Colorado: | 2.9% (90,089) |
Self-employed workers in own not incorporated business:
| Loveland: | 6.1% (2,576) |
| Colorado: | 6.1% (190,717) |
Unpaid family workers:
| Loveland: | 0.1% (51) |
| Colorado: | 0.1% (3,655) |

Employee of private company:
| Loveland: | 70.2% (18,368) |
| Colorado: | 67.3% (1,485,056) |
Self-employed in own incorporated business:
| Loveland: | 3.3% (854) |
| Colorado: | 4.4% (96,165) |
Private not-for-profit wage and salary workers:
| Loveland: | 5.6% (1,458) |
| Colorado: | 6.4% (141,129) |
Local government workers:
| Loveland: | 7.3% (1,922) |
| Colorado: | 6.9% (152,123) |
State government workers:
| Loveland: | 3.4% (886) |
| Colorado: | 3.9% (85,273) |
Federal government workers:
| Loveland: | 1.9% (501) |
| Colorado: | 3.1% (68,409) |
Self-employed workers in own not incorporated business:
| Loveland: | 8.1% (2,114) |
| Colorado: | 7.7% (169,415) |
Unpaid family workers:
| Loveland: | 0.2% (61) |
| Colorado: | 0.3% (7,624) |

Employee of private company - Males:
| Loveland: | 74.6% (18,445) |
| Colorado: | 70.8% (1,193,195) |
Self-employed in own incorporated business - Males:
| Loveland: | 3.9% (959) |
| Colorado: | 5.9% (99,311) |
Private not-for-profit wage and salary workers - Males:
| Loveland: | 7.7% (1,892) |
| Colorado: | 5.3% (89,431) |
Local government workers - Males:
| Loveland: | 4.7% (1,152) |
| Colorado: | 5.6% (94,710) |
State government workers - Males:
| Loveland: | 2.8% (699) |
| Colorado: | 3.1% (52,265) |
Federal government workers - Males:
| Loveland: | 0.9% (211) |
| Colorado: | 3.0% (50,317) |
Self-employed workers in own not incorporated business - Males:
| Loveland: | 5.5% (1,367) |
| Colorado: | 6.2% (104,355) |

Employee of private company - Females:
| Loveland: | 62.5% (10,768) |
| Colorado: | 61.8% (892,695) |
Self-employed in own incorporated business - Females:
| Loveland: | 2.7% (472) |
| Colorado: | 4.2% (60,681) |
Private not-for-profit wage and salary workers - Females:
| Loveland: | 9.7% (1,665) |
| Colorado: | 11.3% (163,456) |
Local government workers - Females:
| Loveland: | 12.4% (2,143) |
| Colorado: | 9.8% (141,408) |
State government workers - Females:
| Loveland: | 3.4% (587) |
| Colorado: | 4.1% (59,531) |
Federal government workers - Females:
| Loveland: | 1.9% (335) |
| Colorado: | 2.8% (39,772) |
Self-employed workers in own not incorporated business - Females:
| Loveland: | 7.0% (1,209) |
| Colorado: | 6.0% (86,362) |
Unpaid family workers - Females:
| Loveland: | 0.3% (51) |
| Colorado: | 0.1% (1,585) |