Work and Jobs in Nemacolin, Pennsylvania (PA) Detailed Stats
Occupations, Industries, Unemployment, Workers, Commute
Settings
X


Recent posts about work in Nemacolin, Pennsylvania on our local forum with over 2,400,000 registered users:
 | How is Altoona for retirement? (44 replies) |
| Where to live near nemacolin (11 replies) |
| the mon fayette expressway. is it gonna be beneficial or wasteful? (62 replies) |
| Mon Fayette Expressway Project Map UGH!!! (97 replies) |
| Is PA depressing? (665 replies) |
| Can anything be done to save the "Mon Towns?" (98 replies) |
Latest news about work in Nemacolin, PA collected exclusively by city-data.com from local newspapers, TV, and radio stations
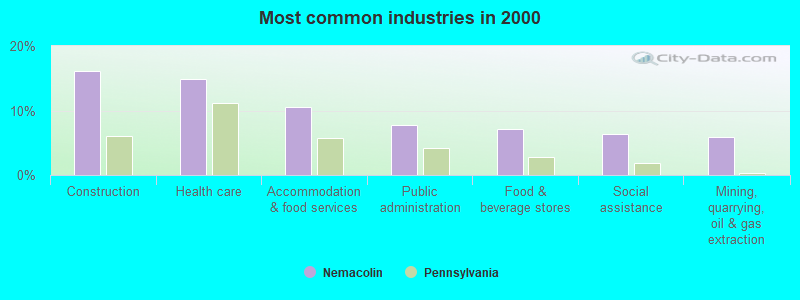
The most common industries in Nemacolin are: Construction (16.1% of civilian employees), Health care (15.0% of civilian employees), Accommodation & food services (10.5% of civilian employees). 84.1% of workers work in Greene County. 95.9% of workers are employees of private companies, which is 29.4% greater than the rate of 67.7% across the entire state of Pennsylvania.
Whole page based on the data from 2000 / 2022 when the population of Nemacolin, Pennsylvania was 1,034 / 942
Whole page based on the data from 2000 / 2022 when the population of Nemacolin, Pennsylvania was 1,034 / 942
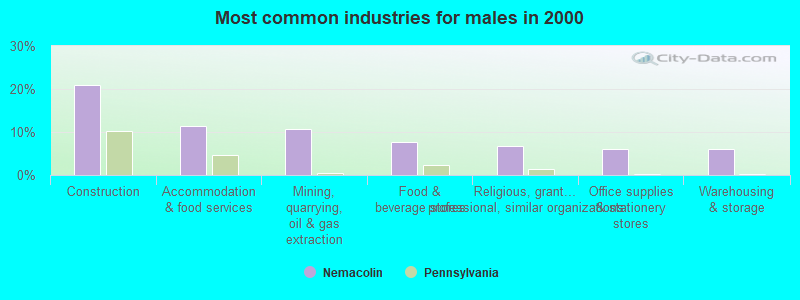
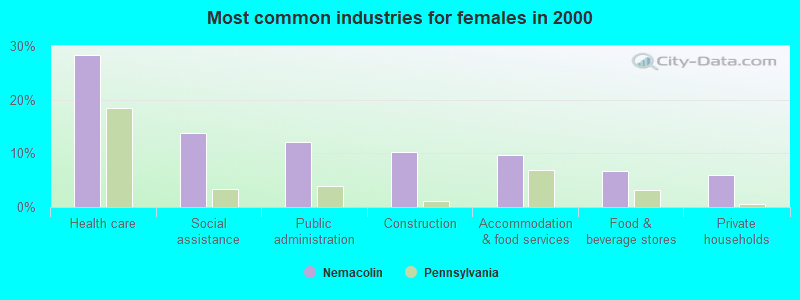
Most common industries
Most common industries | |||
|---|---|---|---|
Industry | All | Males | Females |
| Construction | 16.1% (58) | 21.0% (41) | 10.2% (17) |
| Health care | 15.0% (54) | 3.6% (7) | 28.3% (47) |
| Accommodation and food services | 10.5% (38) | 11.3% (22) | 9.6% (16) |
| Public administration | 7.8% (28) | 4.1% (8) | 12.0% (20) |
| Food and beverage stores | 7.2% (26) | 7.7% (15) | 6.6% (11) |
| Social assistance | 6.4% (23) | 0.0% (0) | 13.9% (23) |
| Mining, quarrying, and oil and gas extraction | 5.8% (21) | 10.8% (21) | 0.0% (0) |
| Warehousing and storage | 5.3% (19) | 6.2% (12) | 4.2% (7) |
| Religious, grantmaking, civic, professional, and similar organizations | 3.6% (13) | 6.7% (13) | 0.0% (0) |
| Office supplies and stationery stores | 3.3% (12) | 6.2% (12) | 0.0% (0) |
| Private households | 2.8% (10) | 0.0% (0) | 6.0% (10) |
| Truck transportation | 2.5% (9) | 4.6% (9) | 0.0% (0) |
| Plastics and rubber products | 2.2% (8) | 4.1% (8) | 0.0% (0) |
| Other direct selling establishments | 2.2% (8) | 0.0% (0) | 4.8% (8) |
| Other transportation, and support activities, and couriers | 2.2% (8) | 4.1% (8) | 0.0% (0) |
| Educational services | 1.9% (7) | 0.0% (0) | 4.2% (7) |
| Repair and maintenance | 1.9% (7) | 3.6% (7) | 0.0% (0) |
| Metal and metal products | 1.7% (6) | 3.1% (6) | 0.0% (0) |
| U. S. Postal service | 1.7% (6) | 3.1% (6) | 0.0% (0) |
Unemployment in Nemacolin
- Unemployment by race in 2000
- Unemployment rate for White non-Hispanic residents
- 15.9%Males
- 2.9%Females
Time leaving home to go to work

7:30 a.m. to 7:59 a.m.:
| Nemacolin: | 15.6% (44) |
| Pennsylvania: | 11.5% (611,627) |
8:00 a.m. to 8:29 a.m.:
| Nemacolin: | 34.5% (97) |
| Pennsylvania: | 11.0% (585,665) |
9:00 a.m. to 9:59 a.m.:
| Nemacolin: | 8.9% (25) |
| Pennsylvania: | 6.1% (324,576) |
12:00 p.m. to 3:59 p.m.:
| Nemacolin: | 11.4% (32) |
| Pennsylvania: | 7.6% (407,255) |
4:00 p.m. to 11:59 p.m.:
| Nemacolin: | 30.2% (85) |
| Pennsylvania: | 6.9% (369,524) |

<5am:
| Nemacolin: | 4.8% (16) |
| Pennsylvania: | 3.1% (172,304) |
5:30am:
| Nemacolin: | 6.6% (22) |
| Pennsylvania: | 2.7% (150,168) |
6am:
| Nemacolin: | 5.1% (17) |
| Pennsylvania: | 4.4% (245,004) |
6:30am:
| Nemacolin: | 15.6% (52) |
| Pennsylvania: | 8.6% (478,636) |
7am:
| Nemacolin: | 6.6% (22) |
| Pennsylvania: | 10.8% (599,808) |
7:30am:
| Nemacolin: | 10.8% (36) |
| Pennsylvania: | 13.7% (759,372) |
8am:
| Nemacolin: | 8.1% (27) |
| Pennsylvania: | 14.9% (826,968) |
8:30am:
| Nemacolin: | 13.8% (46) |
| Pennsylvania: | 10.6% (588,440) |
10am:
| Nemacolin: | 2.1% (7) |
| Pennsylvania: | 5.1% (280,812) |
4pm:
| Nemacolin: | 11.1% (37) |
| Pennsylvania: | 7.3% (404,775) |
>4pm:
| Nemacolin: | 15.6% (52) |
| Pennsylvania: | 7.3% (408,070) |

7:30 a.m. to 7:59 a.m. - Males:
| Nemacolin: | 3.5% (6) |
| Pennsylvania: | 9.5% (268,895) |
8:00 a.m. to 8:29 a.m. - Males:
| Nemacolin: | 32.4% (52) |
| Pennsylvania: | 9.7% (274,966) |
9:00 a.m. to 9:59 a.m. - Males:
| Nemacolin: | 15.5% (25) |
| Pennsylvania: | 5.1% (145,545) |
12:00 p.m. to 3:59 p.m. - Males:
| Nemacolin: | 20.3% (32) |
| Pennsylvania: | 7.4% (210,601) |
4:00 p.m. to 11:59 p.m. - Males:
| Nemacolin: | 29.6% (47) |
| Pennsylvania: | 7.1% (202,203) |

7:30 a.m. to 7:59 a.m. - Females:
| Nemacolin: | 31.7% (39) |
| Pennsylvania: | 13.7% (342,732) |
8:00 a.m. to 8:29 a.m. - Females:
| Nemacolin: | 37.2% (46) |
| Pennsylvania: | 12.4% (310,699) |
4:00 p.m. to 11:59 p.m. - Females:
| Nemacolin: | 31.0% (38) |
| Pennsylvania: | 6.7% (167,321) |
Travel time to work
Percentage of workers working in this county: 84.1%


Less than 5 minutes:
| Nemacolin: | 3.0% (10) |
| Pennsylvania: | 3.5% (196,492) |
5 to 9 minutes:
| Nemacolin: | 11.4% (38) |
| Pennsylvania: | 11.1% (615,919) |
10 to 14 minutes:
| Nemacolin: | 16.2% (54) |
| Pennsylvania: | 14.9% (825,199) |
15 to 19 minutes:
| Nemacolin: | 9.3% (31) |
| Pennsylvania: | 15.0% (836,006) |
20 to 24 minutes:
| Nemacolin: | 12.9% (43) |
| Pennsylvania: | 14.1% (782,790) |
25 to 29 minutes:
| Nemacolin: | 9.0% (30) |
| Pennsylvania: | 5.9% (327,459) |
30 to 34 minutes:
| Nemacolin: | 4.5% (15) |
| Pennsylvania: | 11.8% (655,811) |
40 to 44 minutes:
| Nemacolin: | 2.7% (9) |
| Pennsylvania: | 3.4% (187,483) |
45 to 59 minutes:
| Nemacolin: | 11.1% (37) |
| Pennsylvania: | 7.3% (407,516) |
60 to 89 minutes:
| Nemacolin: | 11.1% (37) |
| Pennsylvania: | 4.8% (265,759) |
90 or more minutes:
| Nemacolin: | 9.0% (30) |
| Pennsylvania: | 2.6% (142,325) |
Means of transportation to work


Drove car alone:
| Nemacolin: | 76.0% (254) |
| Pennsylvania: | 76.5% (4,247,836) |
Carpooled:
| Nemacolin: | 21.0% (70) |
| Pennsylvania: | 10.4% (577,364) |
Walked:
| Nemacolin: | 3.0% (10) |
| Pennsylvania: | 4.1% (229,725) |
Private vehicle occupancy

Drove alone:
| Nemacolin: | 100.0% (202) |
| Pennsylvania: | 90.2% (4,322,003) |

Drove alone:
| Nemacolin: | 78.4% (254) |
| Pennsylvania: | 88.0% (4,247,836) |
In 2 person carpool:
| Nemacolin: | 17.0% (55) |
| Pennsylvania: | 9.7% (470,174) |
In 3 person carpool:
| Nemacolin: | 4.6% (15) |
| Pennsylvania: | 1.4% (67,610) |
Class of workers

Employee of private company:
| Nemacolin: | 95.9% (282) |
| Pennsylvania: | 67.7% (4,333,849) |
State government workers:
| Nemacolin: | 2.1% (6) |
| Pennsylvania: | 3.0% (193,490) |
Self-employed workers in own not incorporated business:
| Nemacolin: | 2.1% (6) |
| Pennsylvania: | 5.0% (318,118) |

Employee of private company:
| Nemacolin: | 67.0% (242) |
| Pennsylvania: | 69.7% (3,942,119) |
Private not-for-profit wage and salary workers:
| Nemacolin: | 3.6% (13) |
| Pennsylvania: | 10.3% (580,382) |
Local government workers:
| Nemacolin: | 8.9% (32) |
| Pennsylvania: | 5.8% (326,222) |
State government workers:
| Nemacolin: | 11.9% (43) |
| Pennsylvania: | 3.2% (182,232) |
Federal government workers:
| Nemacolin: | 1.7% (6) |
| Pennsylvania: | 2.3% (130,634) |
Self-employed workers in own not incorporated business:
| Nemacolin: | 6.9% (25) |
| Pennsylvania: | 6.0% (339,631) |

Employee of private company - Males:
| Nemacolin: | 96.3% (159) |
| Pennsylvania: | 71.5% (2,388,579) |
Self-employed workers in own not incorporated business - Males:
| Nemacolin: | 3.7% (6) |
| Pennsylvania: | 6.0% (199,421) |

Employee of private company - Females:
| Nemacolin: | 95.3% (123) |
| Pennsylvania: | 63.5% (1,945,270) |
State government workers - Females:
| Nemacolin: | 4.7% (6) |
| Pennsylvania: | 3.1% (95,950) |