Work and Jobs in Oakland, Kentucky (KY) Detailed Stats
Occupations, Industries, Unemployment, Workers, Commute
Settings
X


Recent posts about work in Oakland, Kentucky on our local forum with over 2,400,000 registered users:
 | Panhandlers Around Local Restaurants (45 replies) |
| Will (when) Louisville be "discovered?" (22 replies) |
| Why is it so hard to make friends in Louisville? (16 replies) |
| What are must-see destinations while visiting Lexington? (60 replies) |
| Kentucky obesity problem. What can be done? (45 replies) |
| How Come Louisville Doesn't Have An NBA Team? (102 replies) |
Latest news about work in Oakland, KY collected exclusively by city-data.com from local newspapers, TV, and radio stations
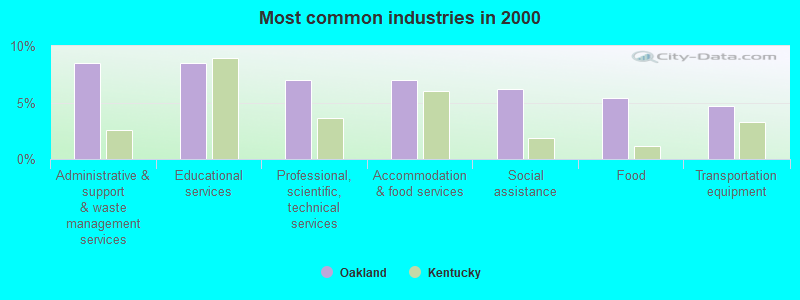
The most common industries in Oakland are: Administrative & support & waste management services (8.5% of civilian employees), Educational services (8.5% of civilian employees), Professional, scientific, technical services (7.0% of civilian employees). 87.5% of workers work in Warren County and 11.5% of all workers work at home. 57.3% of workers are employees of private companies, which is 17.3% less than the rate of 67.2% across the entire state of Kentucky.
Whole page based on the data from 2000 / 2022 when the population of Oakland, Kentucky was 260 / 230
Whole page based on the data from 2000 / 2022 when the population of Oakland, Kentucky was 260 / 230
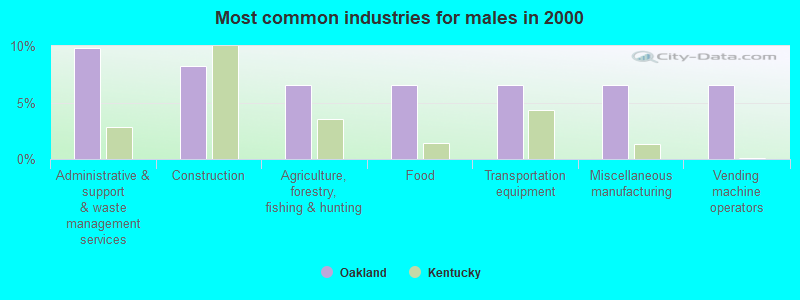
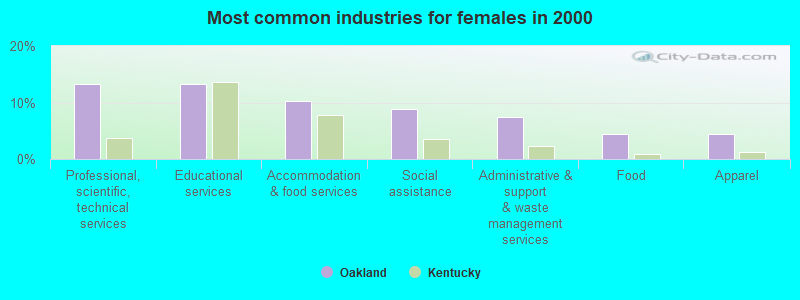
Most common industries
Most common industries | |||
|---|---|---|---|
Industry | All | Males | Females |
| Administrative and support and waste management services | 8.5% (11) | 9.8% (6) | 7.4% (5) |
| Educational services | 8.5% (11) | 3.3% (2) | 13.2% (9) |
| Professional, scientific, and technical services | 7.0% (9) | 0.0% (0) | 13.2% (9) |
| Accommodation and food services | 7.0% (9) | 3.3% (2) | 10.3% (7) |
| Social assistance | 6.2% (8) | 3.3% (2) | 8.8% (6) |
| Food | 5.4% (7) | 6.6% (4) | 4.4% (3) |
| Transportation equipment | 4.7% (6) | 6.6% (4) | 2.9% (2) |
| Construction | 3.9% (5) | 8.2% (5) | 0.0% (0) |
| Agriculture, forestry, fishing and hunting | 3.1% (4) | 6.6% (4) | 0.0% (0) |
| Public administration | 3.1% (4) | 4.9% (3) | 1.5% (1) |
| Miscellaneous manufacturing | 3.1% (4) | 6.6% (4) | 0.0% (0) |
| Vending machine operators | 3.1% (4) | 6.6% (4) | 0.0% (0) |
| Printing and related support activities | 3.1% (4) | 3.3% (2) | 2.9% (2) |
| Personal and laundry services | 3.1% (4) | 4.9% (3) | 1.5% (1) |
| Motor vehicle and parts dealers | 2.3% (3) | 1.6% (1) | 2.9% (2) |
| Apparel | 2.3% (3) | 0.0% (0) | 4.4% (3) |
| Wood products | 2.3% (3) | 0.0% (0) | 4.4% (3) |
| Management of companies and enterprises | 2.3% (3) | 0.0% (0) | 4.4% (3) |
| Real estate and rental and leasing | 2.3% (3) | 4.9% (3) | 0.0% (0) |
| Health care | 2.3% (3) | 3.3% (2) | 1.5% (1) |
| Electrical equipment, appliances, and components | 1.6% (2) | 3.3% (2) | 0.0% (0) |
| Chemicals | 1.6% (2) | 0.0% (0) | 2.9% (2) |
| Food and beverage stores | 1.6% (2) | 0.0% (0) | 2.9% (2) |
| Clothing and accessories, including shoe, stores | 1.6% (2) | 0.0% (0) | 2.9% (2) |
| Other transportation, and support activities, and couriers | 1.6% (2) | 3.3% (2) | 0.0% (0) |
| Broadcasting and telecommunications | 1.6% (2) | 3.3% (2) | 0.0% (0) |
| Machinery | 1.6% (2) | 0.0% (0) | 2.9% (2) |
| Religious, grantmaking, civic, professional, and similar organizations | 1.6% (2) | 1.6% (1) | 1.5% (1) |
| Arts, entertainment, and recreation | 0.8% (1) | 0.0% (0) | 1.5% (1) |
| Miscellaneous nondurable goods merchant wholesalers | 0.8% (1) | 1.6% (1) | 0.0% (0) |
| Used merchandise, gift, novelty, and souvenir, and other miscellaneous stores | 0.8% (1) | 1.6% (1) | 0.0% (0) |
| Department and other general merchandise stores | 0.8% (1) | 1.6% (1) | 0.0% (0) |
| Private households | 0.8% (1) | 0.0% (0) | 1.5% (1) |
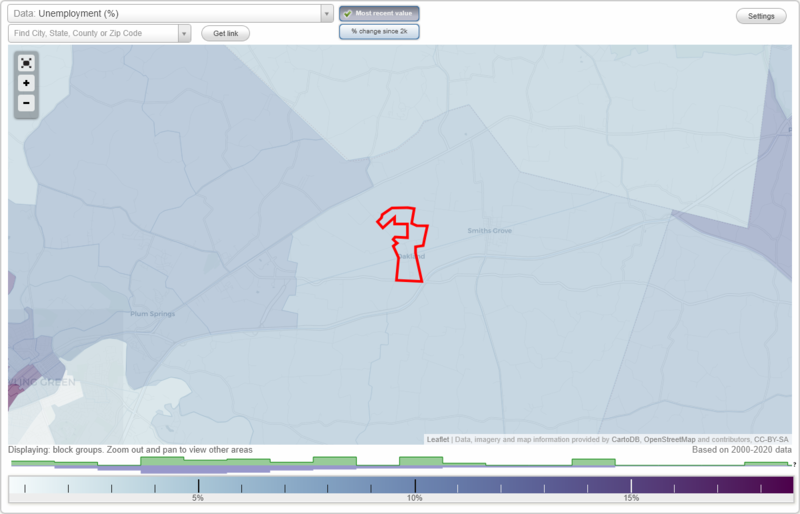
Unemployment in Oakland
- Unemployment by race in 2022
- Unemployment rate for White non-Hispanic residents
- 2.2%Females
- Unemployment by race in 2000
- Unemployment rate for White non-Hispanic residents
- 8.2%Males
- 3.4%Females
- Unemployment rate for Black residents
- 21.4%Females
Time leaving home to go to work
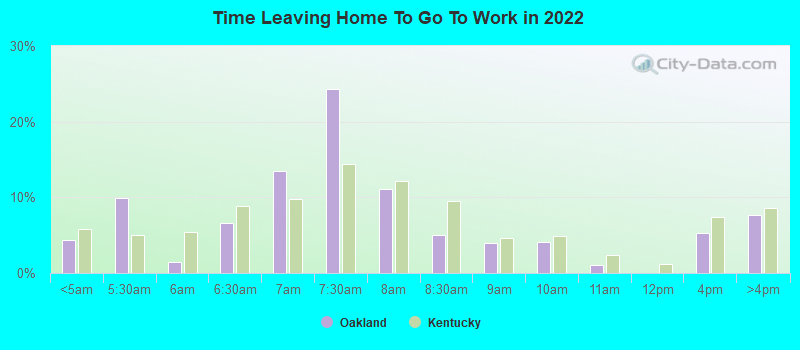
12:00 a.m. to 4:59 a.m.:
| Oakland: | 4.3% (4) |
| Kentucky: | 5.8% (106,411) |
5:00 a.m. to 5:29 a.m.:
| Oakland: | 10.0% (8) |
| Kentucky: | 5.0% (91,562) |
5:30 a.m. to 5:59 a.m.:
| Oakland: | 1.5% (1) |
| Kentucky: | 5.4% (97,792) |
6:00 a.m. to 6:29 a.m.:
| Oakland: | 6.6% (5) |
| Kentucky: | 8.8% (160,781) |
6:30 a.m. to 6:59 a.m.:
| Oakland: | 13.5% (11) |
| Kentucky: | 9.8% (177,898) |
7:00 a.m. to 7:29 a.m.:
| Oakland: | 24.3% (20) |
| Kentucky: | 14.4% (262,079) |
7:30 a.m. to 7:59 a.m.:
| Oakland: | 11.1% (9) |
| Kentucky: | 12.2% (221,546) |
8:00 a.m. to 8:29 a.m.:
| Oakland: | 5.1% (4) |
| Kentucky: | 9.6% (174,071) |
8:30 a.m. to 8:59 a.m.:
| Oakland: | 3.9% (3) |
| Kentucky: | 4.6% (84,129) |
9:00 a.m. to 9:59 a.m.:
| Oakland: | 4.0% (3) |
| Kentucky: | 4.9% (88,917) |
10:00 a.m. to 10:59 a.m.:
| Oakland: | 1.1% (1) |
| Kentucky: | 2.4% (44,296) |
12:00 p.m. to 3:59 p.m.:
| Oakland: | 5.3% (4) |
| Kentucky: | 7.4% (134,033) |
4:00 p.m. to 11:59 p.m.:
| Oakland: | 7.7% (6) |
| Kentucky: | 8.6% (156,276) |
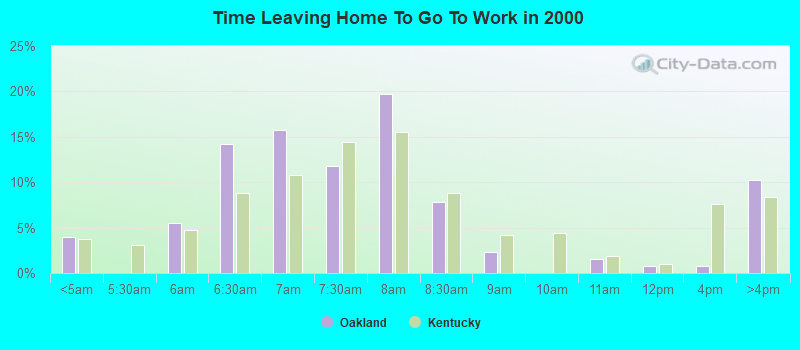
<5am:
| Oakland: | 3.9% (5) |
| Kentucky: | 3.7% (65,918) |
6am:
| Oakland: | 5.5% (7) |
| Kentucky: | 4.7% (84,161) |
6:30am:
| Oakland: | 14.2% (18) |
| Kentucky: | 8.8% (156,072) |
7am:
| Oakland: | 15.7% (20) |
| Kentucky: | 10.8% (191,924) |
7:30am:
| Oakland: | 11.8% (15) |
| Kentucky: | 14.4% (256,256) |
8am:
| Oakland: | 19.7% (25) |
| Kentucky: | 15.6% (277,275) |
8:30am:
| Oakland: | 7.9% (10) |
| Kentucky: | 8.8% (156,855) |
9am:
| Oakland: | 2.4% (3) |
| Kentucky: | 4.2% (75,532) |
11am:
| Oakland: | 1.6% (2) |
| Kentucky: | 1.9% (33,406) |
12pm:
| Oakland: | 0.8% (1) |
| Kentucky: | 1.0% (17,303) |
4pm:
| Oakland: | 0.8% (1) |
| Kentucky: | 7.6% (135,045) |
>4pm:
| Oakland: | 10.2% (13) |
| Kentucky: | 8.4% (150,096) |
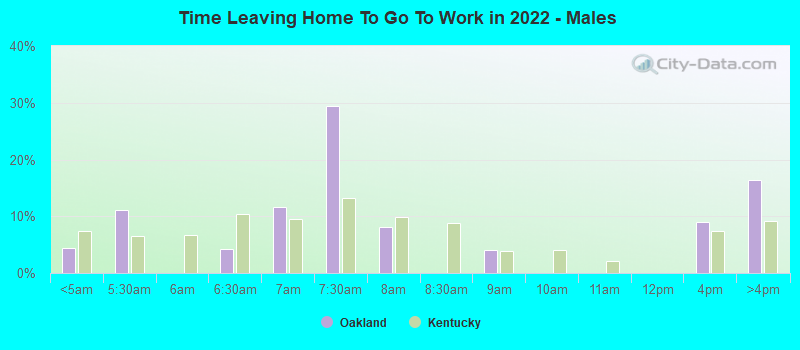
12:00 a.m. to 4:59 a.m. - Males:
| Oakland: | 4.4% (2) |
| Kentucky: | 7.4% (72,814) |
5:00 a.m. to 5:29 a.m. - Males:
| Oakland: | 11.1% (4) |
| Kentucky: | 6.5% (63,906) |
6:00 a.m. to 6:29 a.m. - Males:
| Oakland: | 4.3% (2) |
| Kentucky: | 10.3% (101,417) |
6:30 a.m. to 6:59 a.m. - Males:
| Oakland: | 11.6% (4) |
| Kentucky: | 9.5% (93,068) |
7:00 a.m. to 7:29 a.m. - Males:
| Oakland: | 29.4% (11) |
| Kentucky: | 13.3% (130,226) |
7:30 a.m. to 7:59 a.m. - Males:
| Oakland: | 8.1% (3) |
| Kentucky: | 9.8% (95,903) |
8:30 a.m. to 8:59 a.m. - Males:
| Oakland: | 4.0% (2) |
| Kentucky: | 3.9% (38,346) |
12:00 p.m. to 3:59 p.m. - Males:
| Oakland: | 8.9% (3) |
| Kentucky: | 7.5% (73,140) |
4:00 p.m. to 11:59 p.m. - Males:
| Oakland: | 16.3% (6) |
| Kentucky: | 9.1% (89,441) |
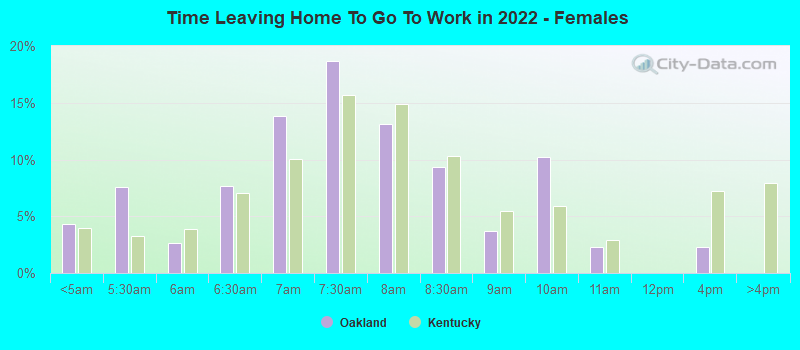
12:00 a.m. to 4:59 a.m. - Females:
| Oakland: | 4.3% (2) |
| Kentucky: | 4.0% (33,597) |
5:00 a.m. to 5:29 a.m. - Females:
| Oakland: | 7.6% (3) |
| Kentucky: | 3.3% (27,656) |
5:30 a.m. to 5:59 a.m. - Females:
| Oakland: | 2.6% (1) |
| Kentucky: | 3.9% (32,597) |
6:00 a.m. to 6:29 a.m. - Females:
| Oakland: | 7.7% (3) |
| Kentucky: | 7.1% (59,364) |
6:30 a.m. to 6:59 a.m. - Females:
| Oakland: | 13.8% (6) |
| Kentucky: | 10.1% (84,830) |
7:00 a.m. to 7:29 a.m. - Females:
| Oakland: | 18.7% (8) |
| Kentucky: | 15.7% (131,853) |
7:30 a.m. to 7:59 a.m. - Females:
| Oakland: | 13.1% (6) |
| Kentucky: | 14.9% (125,643) |
8:00 a.m. to 8:29 a.m. - Females:
| Oakland: | 9.3% (4) |
| Kentucky: | 10.3% (87,114) |
8:30 a.m. to 8:59 a.m. - Females:
| Oakland: | 3.7% (2) |
| Kentucky: | 5.4% (45,783) |
9:00 a.m. to 9:59 a.m. - Females:
| Oakland: | 10.2% (4) |
| Kentucky: | 5.9% (49,369) |
10:00 a.m. to 10:59 a.m. - Females:
| Oakland: | 2.3% (1) |
| Kentucky: | 2.9% (24,349) |
12:00 p.m. to 3:59 p.m. - Females:
| Oakland: | 2.3% (1) |
| Kentucky: | 7.2% (60,893) |
Travel time to work
Percentage of workers working in this county: 87.5%
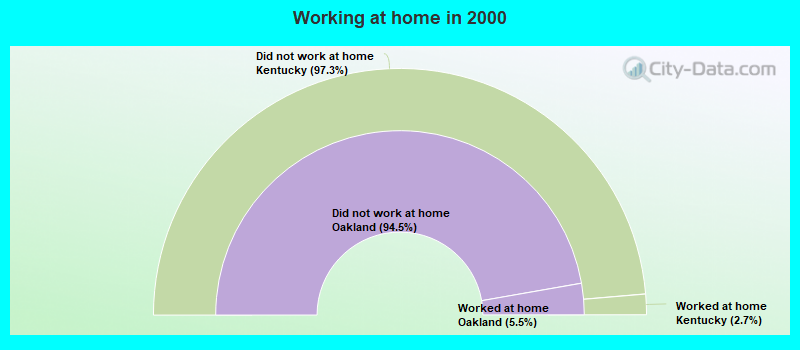
Number of people working at home: 11 (11.5% of all workers)
Number of people working at home: 11 (11.5% of all workers)
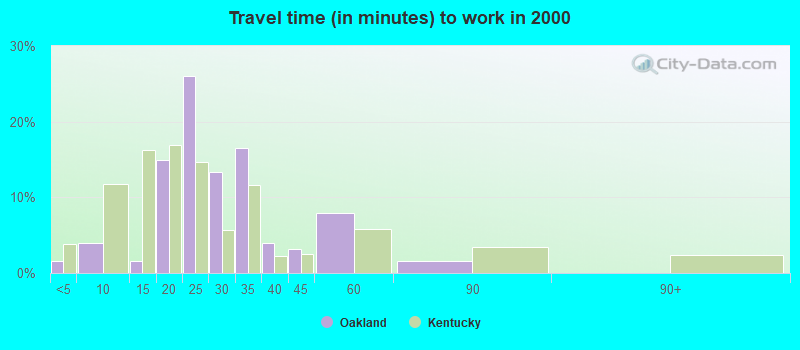
Less than 5 minutes:
| Oakland: | 1.6% (2) |
| Kentucky: | 3.8% (67,210) |
5 to 9 minutes:
| Oakland: | 3.9% (5) |
| Kentucky: | 11.8% (210,440) |
10 to 14 minutes:
| Oakland: | 1.6% (2) |
| Kentucky: | 16.3% (290,128) |
15 to 19 minutes:
| Oakland: | 15.0% (19) |
| Kentucky: | 16.9% (301,009) |
20 to 24 minutes:
| Oakland: | 26.0% (33) |
| Kentucky: | 14.7% (262,418) |
25 to 29 minutes:
| Oakland: | 13.4% (17) |
| Kentucky: | 5.7% (101,130) |
30 to 34 minutes:
| Oakland: | 16.5% (21) |
| Kentucky: | 11.7% (208,362) |
35 to 39 minutes:
| Oakland: | 3.9% (5) |
| Kentucky: | 2.3% (40,576) |
40 to 44 minutes:
| Oakland: | 3.1% (4) |
| Kentucky: | 2.5% (44,172) |
45 to 59 minutes:
| Oakland: | 7.9% (10) |
| Kentucky: | 5.8% (102,842) |
60 to 89 minutes:
| Oakland: | 1.6% (2) |
| Kentucky: | 3.5% (61,841) |
Means of transportation to work
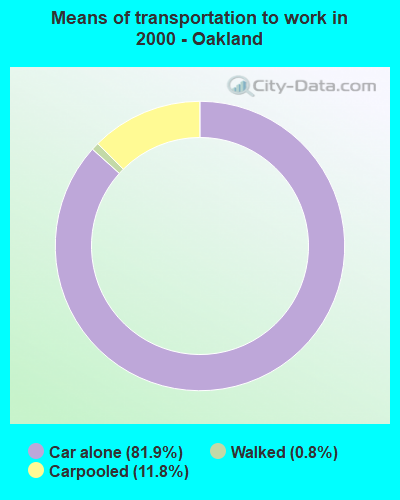
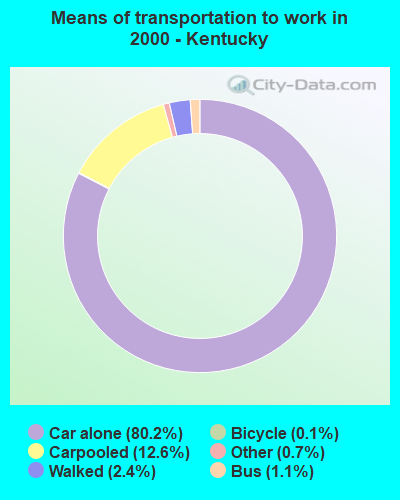
Drove car alone:
| Oakland: | 81.9% (104) |
| Kentucky: | 80.2% (1,429,053) |
Carpooled:
| Oakland: | 11.8% (15) |
| Kentucky: | 12.6% (224,643) |
Walked:
| Oakland: | 0.8% (1) |
| Kentucky: | 2.4% (42,494) |
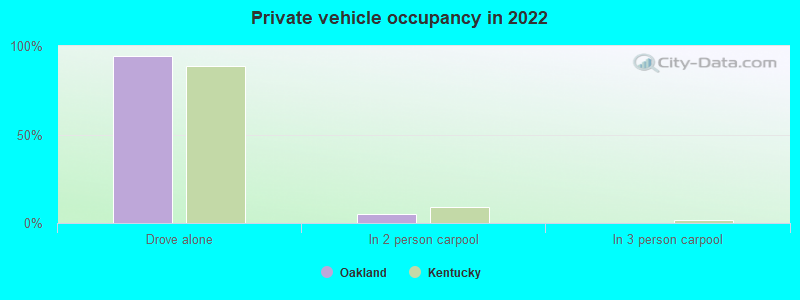
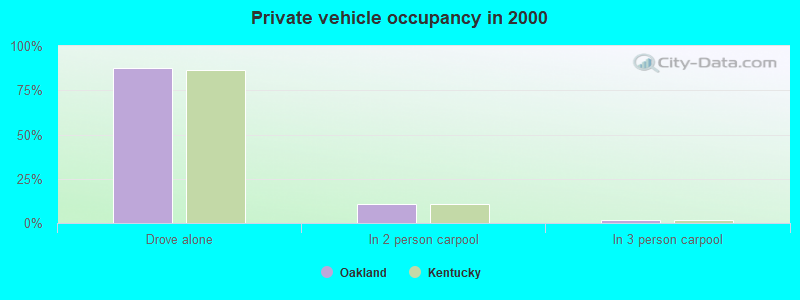
Private vehicle occupancy
Drove alone:
| Oakland: | 94.1% (80) |
| Kentucky: | 88.5% (1,545,744) |
In 2 person carpool:
| Oakland: | 5.2% (4) |
| Kentucky: | 9.0% (157,727) |
Drove alone:
| Oakland: | 87.4% (104) |
| Kentucky: | 86.4% (1,429,053) |
In 2 person carpool:
| Oakland: | 10.9% (13) |
| Kentucky: | 10.8% (178,387) |
In 3 person carpool:
| Oakland: | 1.7% (2) |
| Kentucky: | 1.8% (30,156) |
Class of workers
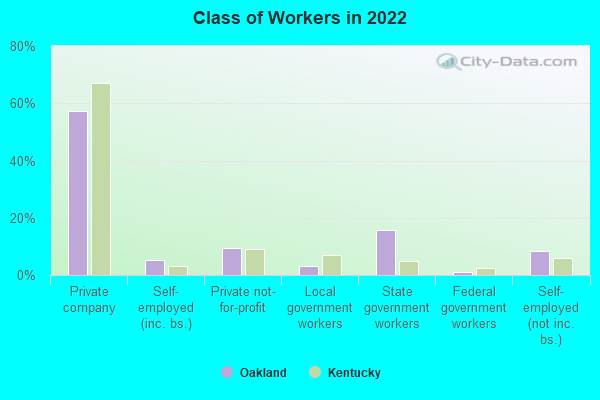
Employee of private company:
| Oakland: | 57.3% (53) |
| Kentucky: | 67.2% (1,385,496) |
Self-employed in own incorporated business:
| Oakland: | 5.2% (5) |
| Kentucky: | 3.1% (63,067) |
Private not-for-profit wage and salary workers:
| Oakland: | 9.4% (9) |
| Kentucky: | 8.9% (184,048) |
Local government workers:
| Oakland: | 3.1% (3) |
| Kentucky: | 7.1% (147,000) |
State government workers:
| Oakland: | 15.6% (14) |
| Kentucky: | 4.9% (100,503) |
Federal government workers:
| Oakland: | 1.0% (1) |
| Kentucky: | 2.6% (53,473) |
Self-employed workers in own not incorporated business:
| Oakland: | 8.3% (8) |
| Kentucky: | 6.0% (123,667) |
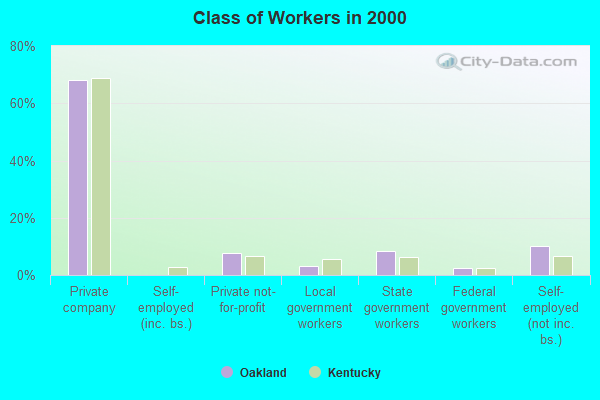
Employee of private company:
| Oakland: | 68.2% (88) |
| Kentucky: | 68.7% (1,235,989) |
Private not-for-profit wage and salary workers:
| Oakland: | 7.8% (10) |
| Kentucky: | 6.8% (121,764) |
Local government workers:
| Oakland: | 3.1% (4) |
| Kentucky: | 5.6% (100,920) |
State government workers:
| Oakland: | 8.5% (11) |
| Kentucky: | 6.4% (114,791) |
Federal government workers:
| Oakland: | 2.3% (3) |
| Kentucky: | 2.5% (44,072) |
Self-employed workers in own not incorporated business:
| Oakland: | 10.1% (13) |
| Kentucky: | 6.7% (120,288) |
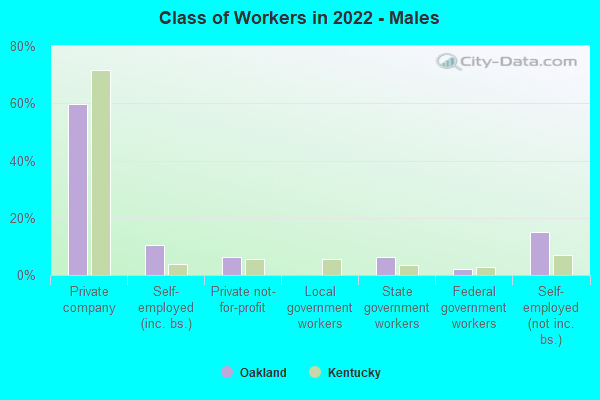
Employee of private company - Males:
| Oakland: | 59.6% (27) |
| Kentucky: | 71.5% (773,461) |
Self-employed in own incorporated business - Males:
| Oakland: | 10.6% (5) |
| Kentucky: | 3.7% (40,392) |
Private not-for-profit wage and salary workers - Males:
| Oakland: | 6.4% (3) |
| Kentucky: | 5.7% (61,487) |
State government workers - Males:
| Oakland: | 6.4% (3) |
| Kentucky: | 3.6% (38,667) |
Federal government workers - Males:
| Oakland: | 2.1% (1) |
| Kentucky: | 2.8% (30,519) |
Self-employed workers in own not incorporated business - Males:
| Oakland: | 14.9% (7) |
| Kentucky: | 7.1% (76,456) |
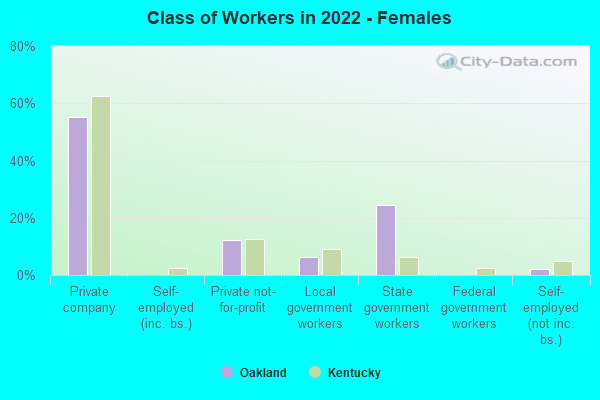
Employee of private company - Females:
| Oakland: | 55.1% (26) |
| Kentucky: | 62.5% (612,035) |
Private not-for-profit wage and salary workers - Females:
| Oakland: | 12.2% (6) |
| Kentucky: | 12.5% (122,561) |
Local government workers - Females:
| Oakland: | 6.1% (3) |
| Kentucky: | 9.0% (87,893) |
State government workers - Females:
| Oakland: | 24.5% (11) |
| Kentucky: | 6.3% (61,836) |
Self-employed workers in own not incorporated business - Females:
| Oakland: | 2.0% (1) |
| Kentucky: | 4.8% (47,211) |