Work and Jobs in Oklahoma City, Oklahoma (OK) Detailed Stats
Occupations, Industries, Unemployment, Workers, Commute
Settings
X


Recent posts about work in Oklahoma City, Oklahoma on our local forum with over 2,400,000 registered users:
 | Oklahoma City Poverty (76 replies) |
| Jobs in Oklahoma City (10 replies) |
| Oklahoma City - Jobs - Schools - Neighborhoods??? (1 reply) |
| Sorry To Break This To All Of You Oklahoma City Oklahoma Haters..... But OKC Is One Of AMERICA'S TOP TEN BOOM CITIES (139 replies) |
| Oklahoma City Labouring Jobs (11 replies) |
| Moving to Oklahoma City - teaching jobs? (16 replies) |
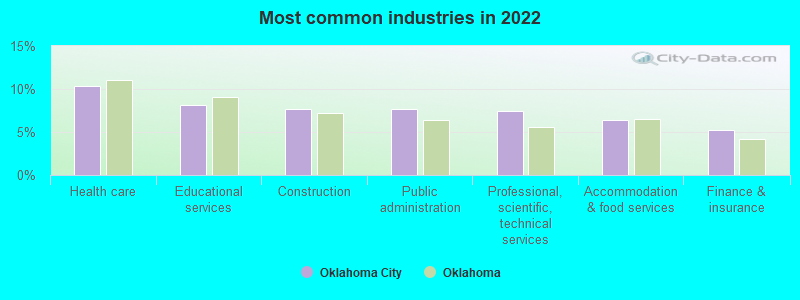
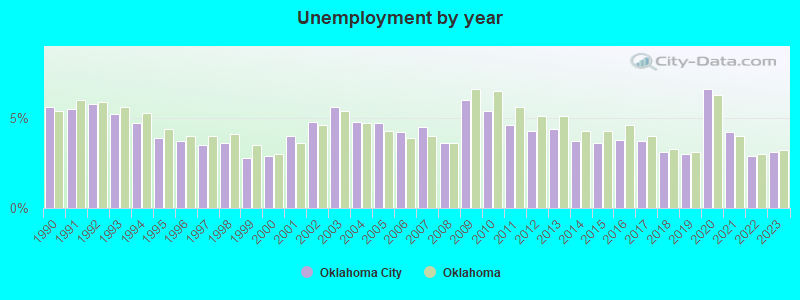
The unemployment rate in 2023 in Oklahoma City, OK was 3.1%, which was 3.2% less than the unemployment rate of 3.2% across the entire state of Oklahoma. Compared to the unemployment rate of 4.4% in 2013, this represents a decrease of 41.9%. According to 2022 data, the most common industries in Oklahoma City are: Health care (10.3% of civilian employees), Educational services (8.2% of civilian employees), Construction (7.7% of civilian employees). 78.3% of workers work in Oklahoma County and 11.7% of all workers work at home. 64.5% of workers are employees of private companies, which is about the same as the rate of 64.5% across the entire state of Oklahoma.
Whole page based on the data from 2000 / 2022 when the population of Oklahoma City, Oklahoma was 506,132 / 694,768
Whole page based on the data from 2000 / 2022 when the population of Oklahoma City, Oklahoma was 506,132 / 694,768
Most common industries


Most common industries | Most common industries | |||||
|---|---|---|---|---|---|---|
Industry | All | Males | Females | All | Males | Females |
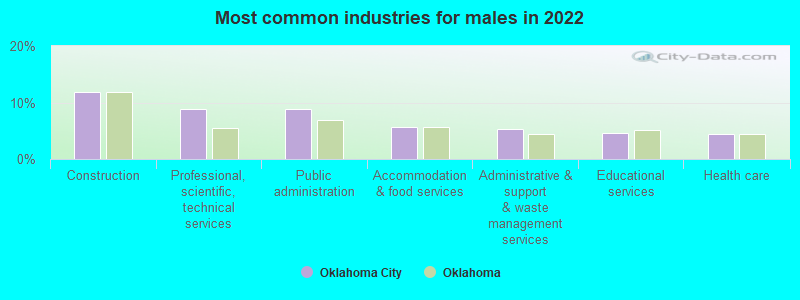
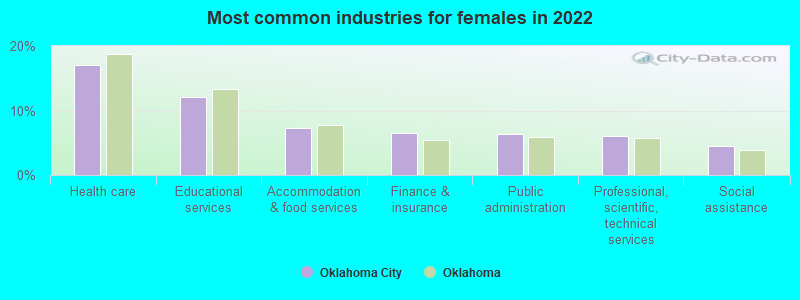
| Health care | 10.3% (35,637) | 4.4% (8,144) | 17.0% (27,493) | 9.3% (21,886) | 4.4% (5,481) | 14.9% (16,405) |
| Educational services | 8.2% (28,139) | 4.7% (8,585) | 12.1% (19,554) | 6.4% (15,057) | 3.7% (4,589) | 9.5% (10,468) |
| Construction | 7.7% (26,637) | 11.9% (21,878) | 2.9% (4,759) | 6.7% (15,848) | 11.4% (14,309) | 1.4% (1,539) |
| Public administration | 7.6% (26,275) | 8.8% (16,091) | 6.3% (10,184) | 7.3% (17,149) | 7.6% (9,541) | 6.9% (7,608) |
| Professional, scientific, and technical services | 7.5% (25,836) | 8.8% (16,184) | 6.0% (9,652) | 5.2% (12,175) | 5.3% (6,627) | 5.0% (5,548) |
| Accommodation and food services | 6.4% (21,969) | 5.6% (10,300) | 7.2% (11,669) | 7.6% (17,791) | 7.0% (8,737) | 8.2% (9,054) |
| Finance and insurance | 5.2% (18,052) | 4.1% (7,584) | 6.5% (10,468) | 5.4% (12,715) | 3.8% (4,804) | 7.2% (7,911) |
| Administrative and support and waste management services | 4.3% (14,679) | 5.4% (9,813) | 3.0% (4,866) | 4.2% (9,914) | 4.6% (5,782) | 3.8% (4,132) |
| Social assistance | 2.3% (7,937) | 0.4% (791) | 4.4% (7,146) | 1.8% (4,250) | 0.4% (452) | 3.5% (3,798) |
| Repair and maintenance | 2.0% (7,033) | 3.4% (6,156) | 0.5% (877) | 1.9% (4,398) | 3.0% (3,759) | 0.6% (639) |
| Mining, quarrying, and oil and gas extraction | 2.0% (6,729) | 2.9% (5,384) | 0.8% (1,345) | 1.0% (2,274) | 1.2% (1,449) | 0.8% (825) |
| Arts, entertainment, and recreation | 1.9% (6,614) | 1.7% (3,040) | 2.2% (3,574) | 1.5% (3,446) | 1.6% (2,017) | 1.3% (1,429) |
| Personal and laundry services | 1.9% (6,588) | 1.1% (2,010) | 2.8% (4,578) | 1.9% (4,359) | 1.0% (1,266) | 2.8% (3,093) |
| Department and other general merchandise stores | 1.7% (5,776) | 1.6% (2,953) | 1.7% (2,823) | 1.9% (4,371) | 1.3% (1,616) | 2.5% (2,755) |
| Real estate and rental and leasing | 1.7% (5,729) | 1.2% (2,189) | 2.2% (3,540) | 3.0% (7,069) | 2.8% (3,457) | 3.3% (3,612) |
| Other transportation, and support activities, and couriers | 1.7% (5,688) | 2.4% (4,375) | 0.8% (1,313) | 1.0% (2,316) | 1.4% (1,726) | 0.5% (590) |
| Religious, grantmaking, civic, professional, and similar organizations | 1.5% (5,308) | 1.2% (2,268) | 1.9% (3,040) | 2.0% (4,644) | 1.5% (1,906) | 2.5% (2,738) |
| Electronic shopping and mail-order houses | 1.5% (5,157) | 1.7% (3,036) | 1.3% (2,121) | 0.1% (291) | 0.1% (85) | 0.2% (206) |
| Food and beverage stores | 1.5% (5,057) | 1.4% (2,512) | 1.6% (2,545) | 1.9% (4,553) | 1.8% (2,316) | 2.0% (2,237) |
| Machinery | 1.3% (4,583) | 1.8% (3,322) | 0.8% (1,261) | 1.2% (2,811) | 1.7% (2,158) | 0.6% (653) |
| Motor vehicle and parts dealers | 1.3% (4,482) | 2.0% (3,647) | 0.5% (835) | 1.6% (3,881) | 2.6% (3,271) | 0.6% (610) |
| Utilities | 1.2% (4,255) | 1.2% (2,233) | 1.3% (2,022) | 0.7% (1,641) | 1.0% (1,256) | 0.4% (385) |
| Used merchandise, gift, novelty, and souvenir, and other miscellaneous stores | 1.2% (4,239) | 0.9% (1,680) | 1.6% (2,559) | 0.7% (1,683) | 0.5% (615) | 1.0% (1,068) |
| Sporting goods, camera, and hobby and toy stores | 1.1% (3,757) | 1.1% (2,054) | 1.1% (1,703) | 0.5% (1,066) | 0.5% (573) | 0.4% (493) |
| Truck transportation | 1.0% (3,455) | 1.6% (2,946) | 0.3% (509) | 1.4% (3,322) | 2.3% (2,928) | 0.4% (394) |
| Transportation equipment | 1.0% (3,420) | 1.4% (2,592) | 0.5% (828) | 2.2% (5,136) | 2.9% (3,634) | 1.4% (1,502) |
| Broadcasting and telecommunications | 0.9% (3,023) | 1.2% (2,140) | 0.5% (883) | 1.8% (4,304) | 1.7% (2,147) | 2.0% (2,157) |
| Air transportation | 0.8% (2,646) | 0.9% (1,617) | 0.6% (1,029) | 0.4% (876) | 0.4% (442) | 0.4% (434) |
| Pharmacies and drug stores | 0.7% (2,576) | 0.5% (966) | 1.0% (1,610) | 0.4% (965) | 0.3% (367) | 0.5% (598) |
| Food | 0.7% (2,548) | 1.0% (1,889) | 0.4% (659) | 0.9% (2,062) | 1.0% (1,216) | 0.8% (846) |
| Metal and metal products | 0.7% (2,547) | 1.2% (2,125) | 0.3% (422) | 1.1% (2,508) | 1.6% (2,024) | 0.4% (484) |
| Warehousing and storage | 0.7% (2,486) | 0.7% (1,354) | 0.7% (1,132) | 0.1% (200) | 0.1% (134) | 0.1% (66) |
| Publishing, and motion picture and sound recording industries | 0.6% (2,091) | 0.7% (1,194) | 0.6% (897) | 0.7% (1,594) | 0.7% (912) | 0.6% (682) |
| Clothing and accessories, including shoe, stores | 0.6% (2,043) | 0.5% (922) | 0.7% (1,121) | 0.7% (1,561) | 0.4% (505) | 1.0% (1,056) |
| Miscellaneous manufacturing | 0.6% (1,983) | 0.8% (1,496) | 0.3% (487) | 1.0% (2,266) | 1.0% (1,271) | 0.9% (995) |
| Building material and garden equipment and supplies dealers | 0.6% (1,924) | 0.8% (1,557) | 0.2% (367) | 0.9% (2,106) | 1.2% (1,493) | 0.6% (613) |
| Gasoline stations | 0.6% (1,917) | 0.3% (576) | 0.8% (1,341) | 0.3% (598) | 0.2% (313) | 0.3% (285) |
| Agriculture, forestry, fishing and hunting | 0.5% (1,662) | 0.6% (1,081) | 0.4% (581) | 0.4% (919) | 0.5% (688) | 0.2% (231) |
| Furniture and home furnishings, and household appliance stores | 0.5% (1,606) | 0.4% (720) | 0.5% (886) | 0.6% (1,370) | 0.7% (852) | 0.5% (518) |
| Groceries and related products merchant wholesalers | 0.4% (1,235) | 0.4% (785) | 0.3% (450) | 1.0% (2,255) | 1.2% (1,542) | 0.6% (713) |
| Chemicals | 0.4% (1,221) | 0.4% (818) | 0.2% (403) | 0.3% (646) | 0.3% (383) | 0.2% (263) |
| Private households | 0.4% (1,209) | 0.1% (113) | 0.7% (1,096) | 0.3% (798) | 0.1% (84) | 0.6% (714) |
| U. S. Postal service | 0.3% (1,183) | 0.5% (828) | 0.2% (355) | 0.6% (1,371) | 0.7% (856) | 0.5% (515) |
| Data processing, libraries, and other information services | 0.3% (1,094) | 0.3% (578) | 0.3% (516) | 0.5% (1,280) | 0.5% (662) | 0.6% (618) |
| Motor vehicles, parts and supplies merchant wholesalers | 0.3% (1,088) | 0.6% (1,088) | 0.0% (0) | 0.4% (865) | 0.5% (644) | 0.2% (221) |
| Computer and electronic products | 0.3% (1,050) | 0.3% (505) | 0.3% (545) | 1.6% (3,723) | 1.8% (2,252) | 1.3% (1,471) |
| Electrical and electronic goods merchant wholesalers | 0.3% (943) | 0.4% (810) | 0.1% (133) | 0.3% (776) | 0.4% (523) | 0.2% (253) |
| Health and personal care, except drug, stores | 0.3% (891) | 0.3% (537) | 0.2% (354) | 0.3% (625) | 0.1% (162) | 0.4% (463) |
| Printing and related support activities | 0.2% (837) | 0.2% (435) | 0.2% (402) | 0.5% (1,179) | 0.6% (779) | 0.4% (400) |
| Hardware, plumbing and heating equipment, and supplies merchant wholesalers | 0.2% (772) | 0.4% (652) | 0.1% (120) | 0.2% (374) | 0.2% (307) | 0.1% (67) |
| Jewelry, luggage, and leather goods stores | 0.2% (716) | 0.2% (361) | 0.2% (355) | 0.1% (327) | 0.1% (180) | 0.1% (147) |
| Radio, TV, and computer stores | 0.2% (682) | 0.2% (279) | 0.2% (403) | 0.6% (1,523) | 0.8% (1,015) | 0.5% (508) |
| Other direct selling establishments | 0.2% (671) | 0.2% (289) | 0.2% (382) | 0.6% (1,528) | 0.6% (743) | 0.7% (785) |
| Electrical equipment, appliances, and components | 0.2% (635) | 0.2% (369) | 0.2% (266) | 0.1% (231) | 0.1% (188) | 0.0% (43) |
| Lumber and other construction materials merchant wholesalers | 0.2% (633) | 0.3% (497) | 0.1% (136) | 0.2% (363) | 0.2% (272) | 0.1% (91) |
| Professional and commercial equipment and supplies merchant wholesalers | 0.2% (584) | 0.2% (295) | 0.2% (289) | 0.4% (846) | 0.5% (674) | 0.2% (172) |
| Management of companies and enterprises | 0.2% (549) | 0.1% (209) | 0.2% (340) | 0.0% (102) | 0.0% (47) | 0.1% (55) |
| Miscellaneous nondurable goods merchant wholesalers | 0.1% (507) | 0.2% (397) | 0.1% (110) | 0.3% (782) | 0.4% (495) | 0.3% (287) |
| Nonmetallic mineral products | 0.1% (492) | 0.2% (404) | 0.1% (88) | 0.3% (766) | 0.5% (591) | 0.2% (175) |
| Machinery, equipment, and supplies merchant wholesalers | 0.1% (486) | 0.2% (436) | 0.0% (50) | 0.5% (1,255) | 0.8% (956) | 0.3% (299) |
| Plastics and rubber products | 0.1% (486) | 0.1% (180) | 0.2% (306) | 0.8% (1,889) | 1.2% (1,453) | 0.4% (436) |
| Beverage and tobacco products | 0.1% (396) | 0.2% (396) | 0.0% (0) | 0.1% (307) | 0.2% (216) | 0.1% (91) |
| Alcoholic beverages merchant wholesalers | 0.1% (382) | 0.2% (382) | 0.0% (0) | 0.1% (235) | 0.2% (215) | 0.0% (20) |
| Textile mills and textile products | 0.1% (349) | 0.0% (0) | 0.2% (349) | 0.1% (144) | 0.0% (29) | 0.1% (115) |
| Retail florists | 0.1% (342) | 0.0% (0) | 0.2% (342) | 0.2% (418) | 0.1% (108) | 0.3% (310) |
| Paper | 0.1% (338) | 0.2% (298) | 0.0% (40) | 0.2% (393) | 0.3% (324) | 0.1% (69) |
| Furniture and related product manufacturing | 0.1% (303) | 0.1% (99) | 0.1% (204) | 0.4% (856) | 0.5% (651) | 0.2% (205) |
| Office supplies and stationery stores | 0.1% (297) | 0.1% (172) | 0.1% (125) | 0.2% (354) | 0.1% (160) | 0.2% (194) |
| Sewing, needlework, and piece goods stores | 0.1% (217) | 0.1% (217) | 0.0% (0) | 0.0% (88) | 0.0% (9) | 0.1% (79) |
| Drugs, sundries, and chemical and allied products merchant wholesalers | 0.1% (208) | 0.0% (0) | 0.1% (208) | 0.2% (440) | 0.2% (216) | 0.2% (224) |
| Petroleum and coal products | 0.1% (202) | 0.1% (138) | 0.0% (64) | 0.1% (157) | 0.1% (136) | 0.0% (21) |
| Petroleum and petroleum products merchant wholesalers | 0.1% (201) | 0.1% (201) | 0.0% (0) | 0.2% (442) | 0.2% (242) | 0.2% (200) |
| Book stores and news dealers | 0.0% (153) | 0.1% (153) | 0.0% (0) | 0.1% (286) | 0.1% (103) | 0.2% (183) |
| Recyclable material merchant wholesalers | 0.0% (128) | 0.1% (128) | 0.0% (0) | 0.1% (177) | 0.1% (157) | 0.0% (20) |
| Paper and paper products merchant wholesalers | 0.0% (39) | 0.0% (39) | 0.0% (0) | 0.1% (321) | 0.2% (195) | 0.1% (126) |
| Music stores | 0.0% (0) | 0.0% (0) | 0.0% (0) | 0.1% (265) | 0.1% (187) | 0.1% (78) |
| Wood products | 0.0% (0) | 0.0% (0) | 0.0% (0) | 0.2% (545) | 0.4% (470) | 0.1% (75) |
Unemployment in Oklahoma City
- Unemployment by race in 2022
- Unemployment rate for White non-Hispanic residents
- 3.5%Males
- 3.5%Females
- Unemployment rate for Black residents
- 8.7%Males
- 3.7%Females
- Unemployment rate for American Indian and Alaska Native residents
- 9.2%Males
- 8.1%Females
- Unemployment rate for Asian residents
- 2.2%Males
- 4.7%Females
- Unemployment rate for other race residents
- 3.3%Males
- 11.0%Females
- Unemployment rate for two or more race residents
- 2.0%Males
- 4.0%Females
- Unemployment rate for Hispanic or Latino residents
- 3.0%Males
- 6.0%Females
- Unemployment by race in 2000
- Unemployment rate for White non-Hispanic residents
- 3.5%Males
- 3.8%Females
- Unemployment rate for Black residents
- 11.0%Males
- 11.0%Females
- Unemployment rate for American Indian and Alaska Native residents
- 6.6%Males
- 9.0%Females
- Unemployment rate for Asian residents
- 4.8%Males
- 3.7%Females
- Unemployment rate for other race residents
- 5.6%Males
- 13.0%Females
- Unemployment rate for two or more race residents
- 9.2%Males
- 8.1%Females
- Unemployment rate for Hispanic or Latino residents
- 6.2%Males
- 10.4%Females
Unemployment in 2023:
| Oklahoma City: | 3.1% |
| Oklahoma: | 3.2% |
Unemployment in 2022:
| Oklahoma City: | 2.9% |
| Oklahoma: | 3.0% |
Unemployment in 2021:
| Oklahoma City: | 4.2% |
| Oklahoma: | 4.0% |
Unemployment in 2020:
| Oklahoma City: | 6.6% |
| Oklahoma: | 6.3% |
Unemployment in 2019:
| Oklahoma City: | 3.0% |
| Oklahoma: | 3.1% |
Unemployment in 2018:
| Oklahoma City: | 3.1% |
| Oklahoma: | 3.3% |
Unemployment in 2017:
| Oklahoma City: | 3.7% |
| Oklahoma: | 4.0% |
Unemployment in 2016:
| Oklahoma City: | 3.8% |
| Oklahoma: | 4.6% |
Unemployment in 2015:
| Oklahoma City: | 3.6% |
| Oklahoma: | 4.3% |
Unemployment in 2014:
| Oklahoma City: | 3.7% |
| Oklahoma: | 4.3% |
Unemployment in 2013:
| Oklahoma City: | 4.4% |
| Oklahoma: | 5.1% |
Unemployment in 2012:
| Oklahoma City: | 4.3% |
| Oklahoma: | 5.1% |
Unemployment in 2011:
| Oklahoma City: | 4.6% |
| Oklahoma: | 5.6% |
Unemployment in 2010:
| Oklahoma City: | 5.4% |
| Oklahoma: | 6.5% |
Unemployment in 2009:
| Oklahoma City: | 6.0% |
| Oklahoma: | 6.6% |
Unemployment in 2008:
| Oklahoma City: | 3.6% |
| Oklahoma: | 3.6% |
Unemployment in 2007:
| Oklahoma City: | 4.5% |
| Oklahoma: | 4.0% |
Unemployment in 2006:
| Oklahoma City: | 4.2% |
| Oklahoma: | 3.9% |
Unemployment in 2005:
| Oklahoma City: | 4.7% |
| Oklahoma: | 4.3% |
Unemployment in 2004:
| Oklahoma City: | 4.8% |
| Oklahoma: | 4.7% |
Unemployment in 2003:
| Oklahoma City: | 5.6% |
| Oklahoma: | 5.4% |
Unemployment in 2002:
| Oklahoma City: | 4.8% |
| Oklahoma: | 4.6% |
Unemployment in 2001:
| Oklahoma City: | 4.0% |
| Oklahoma: | 3.6% |
Unemployment in 2000:
| Oklahoma City: | 2.9% |
| Oklahoma: | 3.0% |
Unemployment in 1999:
| Oklahoma City: | 2.8% |
| Oklahoma: | 3.5% |
Unemployment in 1998:
| Oklahoma City: | 3.6% |
| Oklahoma: | 4.1% |
Unemployment in 1997:
| Oklahoma City: | 3.5% |
| Oklahoma: | 4.0% |
Unemployment in 1996:
| Oklahoma City: | 3.7% |
| Oklahoma: | 4.0% |
Unemployment in 1995:
| Oklahoma City: | 3.9% |
| Oklahoma: | 4.4% |
Unemployment in 1994:
| Oklahoma City: | 4.7% |
| Oklahoma: | 5.3% |
Unemployment in 1993:
| Oklahoma City: | 5.2% |
| Oklahoma: | 5.6% |
Unemployment in 1992:
| Oklahoma City: | 5.8% |
| Oklahoma: | 5.9% |
Unemployment in 1991:
| Oklahoma City: | 5.5% |
| Oklahoma: | 6.0% |
Unemployment in 1990:
| Oklahoma City: | 5.6% |
| Oklahoma: | 5.4% |
Time leaving home to go to work

12:00 a.m. to 4:59 a.m.:
| Oklahoma City: | 5.4% (16,370) |
| Oklahoma: | 5.5% (90,864) |
5:00 a.m. to 5:29 a.m.:
| Oklahoma City: | 2.7% (8,342) |
| Oklahoma: | 3.9% (64,967) |
5:30 a.m. to 5:59 a.m.:
| Oklahoma City: | 4.3% (13,068) |
| Oklahoma: | 4.6% (76,546) |
6:00 a.m. to 6:29 a.m.:
| Oklahoma City: | 8.4% (25,576) |
| Oklahoma: | 8.3% (138,023) |
6:30 a.m. to 6:59 a.m.:
| Oklahoma City: | 8.8% (26,934) |
| Oklahoma: | 10.0% (165,000) |
7:00 a.m. to 7:29 a.m.:
| Oklahoma City: | 15.3% (46,508) |
| Oklahoma: | 15.3% (252,659) |
7:30 a.m. to 7:59 a.m.:
| Oklahoma City: | 13.5% (41,208) |
| Oklahoma: | 14.4% (237,885) |
8:00 a.m. to 8:29 a.m.:
| Oklahoma City: | 12.7% (38,630) |
| Oklahoma: | 10.8% (179,269) |
8:30 a.m. to 8:59 a.m.:
| Oklahoma City: | 4.8% (14,600) |
| Oklahoma: | 4.9% (80,683) |
9:00 a.m. to 9:59 a.m.:
| Oklahoma City: | 7.3% (22,267) |
| Oklahoma: | 5.8% (95,795) |
10:00 a.m. to 10:59 a.m.:
| Oklahoma City: | 2.3% (7,024) |
| Oklahoma: | 2.5% (41,347) |
11:00 a.m. to 11:59 a.m.:
| Oklahoma City: | 1.1% (3,476) |
| Oklahoma: | 1.2% (19,756) |
12:00 p.m. to 3:59 p.m.:
| Oklahoma City: | 7.2% (21,779) |
| Oklahoma: | 6.2% (102,947) |
4:00 p.m. to 11:59 p.m.:
| Oklahoma City: | 6.2% (18,779) |
| Oklahoma: | 6.7% (110,989) |

<5am:
| Oklahoma City: | 2.5% (5,971) |
| Oklahoma: | 3.2% (49,592) |
5:30am:
| Oklahoma City: | 1.8% (4,225) |
| Oklahoma: | 2.6% (39,776) |
6am:
| Oklahoma City: | 3.2% (7,577) |
| Oklahoma: | 4.1% (63,119) |
6:30am:
| Oklahoma City: | 7.1% (16,627) |
| Oklahoma: | 7.4% (113,788) |
7am:
| Oklahoma City: | 9.9% (23,080) |
| Oklahoma: | 9.7% (148,896) |
7:30am:
| Oklahoma City: | 15.0% (35,114) |
| Oklahoma: | 14.8% (228,201) |
8am:
| Oklahoma City: | 18.6% (43,506) |
| Oklahoma: | 18.7% (288,028) |
8:30am:
| Oklahoma City: | 11.2% (26,133) |
| Oklahoma: | 10.3% (158,266) |
9am:
| Oklahoma City: | 5.4% (12,569) |
| Oklahoma: | 4.5% (69,899) |
10am:
| Oklahoma City: | 5.5% (12,993) |
| Oklahoma: | 4.8% (73,878) |
11am:
| Oklahoma City: | 2.5% (5,968) |
| Oklahoma: | 2.1% (31,864) |
12pm:
| Oklahoma City: | 1.1% (2,517) |
| Oklahoma: | 0.9% (14,019) |
4pm:
| Oklahoma City: | 6.7% (15,727) |
| Oklahoma: | 6.8% (105,387) |
>4pm:
| Oklahoma City: | 6.8% (15,861) |
| Oklahoma: | 7.0% (107,522) |

12:00 a.m. to 4:59 a.m. - Males:
| Oklahoma City: | 6.5% (10,817) |
| Oklahoma: | 6.8% (61,929) |
5:00 a.m. to 5:29 a.m. - Males:
| Oklahoma City: | 3.6% (6,015) |
| Oklahoma: | 5.0% (45,756) |
5:30 a.m. to 5:59 a.m. - Males:
| Oklahoma City: | 4.9% (8,257) |
| Oklahoma: | 5.8% (52,330) |
6:00 a.m. to 6:29 a.m. - Males:
| Oklahoma City: | 10.5% (17,593) |
| Oklahoma: | 9.8% (89,084) |
6:30 a.m. to 6:59 a.m. - Males:
| Oklahoma City: | 9.2% (15,295) |
| Oklahoma: | 10.8% (97,734) |
7:00 a.m. to 7:29 a.m. - Males:
| Oklahoma City: | 14.9% (24,831) |
| Oklahoma: | 14.7% (133,449) |
7:30 a.m. to 7:59 a.m. - Males:
| Oklahoma City: | 11.6% (19,304) |
| Oklahoma: | 11.9% (108,090) |
8:00 a.m. to 8:29 a.m. - Males:
| Oklahoma City: | 12.9% (21,527) |
| Oklahoma: | 10.4% (94,613) |
8:30 a.m. to 8:59 a.m. - Males:
| Oklahoma City: | 4.2% (7,046) |
| Oklahoma: | 3.9% (34,924) |
9:00 a.m. to 9:59 a.m. - Males:
| Oklahoma City: | 5.5% (9,275) |
| Oklahoma: | 4.9% (44,744) |
10:00 a.m. to 10:59 a.m. - Males:
| Oklahoma City: | 2.1% (3,472) |
| Oklahoma: | 2.0% (18,134) |
11:00 a.m. to 11:59 a.m. - Males:
| Oklahoma City: | 1.0% (1,639) |
| Oklahoma: | 1.0% (9,474) |
12:00 p.m. to 3:59 p.m. - Males:
| Oklahoma City: | 7.2% (11,990) |
| Oklahoma: | 5.9% (53,039) |
4:00 p.m. to 11:59 p.m. - Males:
| Oklahoma City: | 6.0% (10,061) |
| Oklahoma: | 6.9% (62,917) |

12:00 a.m. to 4:59 a.m. - Females:
| Oklahoma City: | 4.0% (5,553) |
| Oklahoma: | 3.9% (28,935) |
5:00 a.m. to 5:29 a.m. - Females:
| Oklahoma City: | 1.7% (2,327) |
| Oklahoma: | 2.6% (19,211) |
5:30 a.m. to 5:59 a.m. - Females:
| Oklahoma City: | 3.5% (4,811) |
| Oklahoma: | 3.2% (24,216) |
6:00 a.m. to 6:29 a.m. - Females:
| Oklahoma City: | 5.8% (7,983) |
| Oklahoma: | 6.5% (48,939) |
6:30 a.m. to 6:59 a.m. - Females:
| Oklahoma City: | 8.5% (11,639) |
| Oklahoma: | 9.0% (67,266) |
7:00 a.m. to 7:29 a.m. - Females:
| Oklahoma City: | 15.8% (21,677) |
| Oklahoma: | 15.9% (119,210) |
7:30 a.m. to 7:59 a.m. - Females:
| Oklahoma City: | 15.9% (21,904) |
| Oklahoma: | 17.3% (129,795) |
8:00 a.m. to 8:29 a.m. - Females:
| Oklahoma City: | 12.4% (17,103) |
| Oklahoma: | 11.3% (84,656) |
8:30 a.m. to 8:59 a.m. - Females:
| Oklahoma City: | 5.5% (7,554) |
| Oklahoma: | 6.1% (45,759) |
9:00 a.m. to 9:59 a.m. - Females:
| Oklahoma City: | 9.5% (12,992) |
| Oklahoma: | 6.8% (51,051) |
10:00 a.m. to 10:59 a.m. - Females:
| Oklahoma City: | 2.6% (3,552) |
| Oklahoma: | 3.1% (23,213) |
11:00 a.m. to 11:59 a.m. - Females:
| Oklahoma City: | 1.3% (1,837) |
| Oklahoma: | 1.4% (10,282) |
12:00 p.m. to 3:59 p.m. - Females:
| Oklahoma City: | 7.1% (9,789) |
| Oklahoma: | 6.6% (49,908) |
4:00 p.m. to 11:59 p.m. - Females:
| Oklahoma City: | 6.3% (8,718) |
| Oklahoma: | 6.4% (48,072) |
Travel time to work
Percentage of workers working in this county: 78.3%
Number of people working at home: 40,368 (11.7% of all workers)
Daytime population change due to commuting: +94,645 (+18.7%)
Workers who live and work in this city: 188,976 (80.7%)
Number of people working at home: 40,368 (11.7% of all workers)
Daytime population change due to commuting: +94,645 (+18.7%)
Workers who live and work in this city: 188,976 (80.7%)


Less than 5 minutes:
| Oklahoma City: | 1.9% (7,761) |
| Oklahoma: | 4.2% (69,382) |
5 to 9 minutes:
| Oklahoma City: | 7.5% (30,353) |
| Oklahoma: | 13.0% (213,316) |
10 to 14 minutes:
| Oklahoma City: | 11.8% (47,967) |
| Oklahoma: | 16.0% (262,476) |
15 to 19 minutes:
| Oklahoma City: | 15.5% (62,786) |
| Oklahoma: | 16.9% (277,535) |
20 to 24 minutes:
| Oklahoma City: | 18.1% (73,575) |
| Oklahoma: | 14.9% (245,029) |
25 to 29 minutes:
| Oklahoma City: | 9.6% (38,814) |
| Oklahoma: | 6.9% (113,963) |
30 to 34 minutes:
| Oklahoma City: | 17.9% (72,441) |
| Oklahoma: | 12.4% (204,552) |
35 to 39 minutes:
| Oklahoma City: | 3.1% (12,534) |
| Oklahoma: | 2.3% (37,808) |
40 to 44 minutes:
| Oklahoma City: | 3.4% (13,606) |
| Oklahoma: | 2.7% (44,908) |
45 to 59 minutes:
| Oklahoma City: | 6.5% (26,359) |
| Oklahoma: | 5.6% (91,976) |
60 to 89 minutes:
| Oklahoma City: | 2.7% (10,819) |
| Oklahoma: | 3.0% (50,156) |
90 or more minutes:
| Oklahoma City: | 2.1% (8,447) |
| Oklahoma: | 2.1% (33,956) |


Less than 5 minutes:
| Oklahoma City: | 2.5% (5,906) |
| Oklahoma: | 4.6% (70,320) |
5 to 9 minutes:
| Oklahoma City: | 10.0% (23,323) |
| Oklahoma: | 13.9% (214,722) |
10 to 14 minutes:
| Oklahoma City: | 16.8% (39,244) |
| Oklahoma: | 17.2% (264,471) |
15 to 19 minutes:
| Oklahoma City: | 21.4% (50,034) |
| Oklahoma: | 16.9% (260,374) |
20 to 24 minutes:
| Oklahoma City: | 19.9% (46,534) |
| Oklahoma: | 14.3% (220,827) |
25 to 29 minutes:
| Oklahoma City: | 6.6% (15,556) |
| Oklahoma: | 5.2% (79,892) |
30 to 34 minutes:
| Oklahoma City: | 12.3% (28,794) |
| Oklahoma: | 11.4% (175,459) |
35 to 39 minutes:
| Oklahoma City: | 1.2% (2,927) |
| Oklahoma: | 1.8% (27,812) |
40 to 44 minutes:
| Oklahoma City: | 1.1% (2,622) |
| Oklahoma: | 2.0% (30,825) |
45 to 59 minutes:
| Oklahoma City: | 2.5% (5,745) |
| Oklahoma: | 4.7% (72,663) |
60 to 89 minutes:
| Oklahoma City: | 1.5% (3,521) |
| Oklahoma: | 2.8% (43,861) |
90 or more minutes:
| Oklahoma City: | 1.6% (3,662) |
| Oklahoma: | 2.0% (31,009) |

Less than 5 minutes - Males:
| Oklahoma City: | 1.9% (4,430) |
| Oklahoma: | 3.9% (35,163) |
5 to 9 minutes - Males:
| Oklahoma City: | 6.9% (16,078) |
| Oklahoma: | 11.9% (107,201) |
10 to 14 minutes - Males:
| Oklahoma City: | 11.4% (26,379) |
| Oklahoma: | 15.4% (138,996) |
15 to 19 minutes - Males:
| Oklahoma City: | 15.1% (34,919) |
| Oklahoma: | 16.5% (148,621) |
20 to 24 minutes - Males:
| Oklahoma City: | 19.1% (44,281) |
| Oklahoma: | 15.2% (136,592) |
25 to 29 minutes - Males:
| Oklahoma City: | 9.5% (22,045) |
| Oklahoma: | 6.8% (61,455) |
30 to 34 minutes - Males:
| Oklahoma City: | 18.0% (41,684) |
| Oklahoma: | 12.8% (115,295) |
35 to 39 minutes - Males:
| Oklahoma City: | 3.0% (6,916) |
| Oklahoma: | 2.5% (22,460) |
40 to 44 minutes - Males:
| Oklahoma City: | 3.2% (7,415) |
| Oklahoma: | 2.8% (24,822) |
45 to 59 minutes - Males:
| Oklahoma City: | 6.7% (15,506) |
| Oklahoma: | 6.2% (55,353) |
60 to 89 minutes - Males:
| Oklahoma City: | 3.0% (7,063) |
| Oklahoma: | 3.5% (31,681) |
90 or more minutes - Males:
| Oklahoma City: | 2.1% (4,978) |
| Oklahoma: | 2.4% (22,013) |

Less than 5 minutes - Females:
| Oklahoma City: | 1.9% (3,331) |
| Oklahoma: | 4.6% (34,219) |
5 to 9 minutes - Females:
| Oklahoma City: | 8.2% (14,275) |
| Oklahoma: | 14.2% (106,115) |
10 to 14 minutes - Females:
| Oklahoma City: | 12.4% (21,588) |
| Oklahoma: | 16.6% (123,480) |
15 to 19 minutes - Females:
| Oklahoma City: | 16.0% (27,867) |
| Oklahoma: | 17.3% (128,914) |
20 to 24 minutes - Females:
| Oklahoma City: | 16.9% (29,294) |
| Oklahoma: | 14.5% (108,437) |
25 to 29 minutes - Females:
| Oklahoma City: | 9.7% (16,769) |
| Oklahoma: | 7.0% (52,508) |
30 to 34 minutes - Females:
| Oklahoma City: | 17.7% (30,757) |
| Oklahoma: | 12.0% (89,257) |
35 to 39 minutes - Females:
| Oklahoma City: | 3.2% (5,618) |
| Oklahoma: | 2.1% (15,348) |
40 to 44 minutes - Females:
| Oklahoma City: | 3.6% (6,191) |
| Oklahoma: | 2.7% (20,086) |
45 to 59 minutes - Females:
| Oklahoma City: | 6.2% (10,853) |
| Oklahoma: | 4.9% (36,623) |
60 to 89 minutes - Females:
| Oklahoma City: | 2.2% (3,756) |
| Oklahoma: | 2.5% (18,475) |
90 or more minutes - Females:
| Oklahoma City: | 2.0% (3,469) |
| Oklahoma: | 1.6% (11,943) |
Means of transportation to work

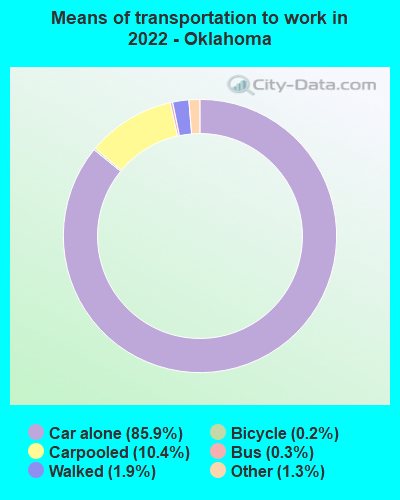
Drove car alone:
| Oklahoma City: | 87.8% (355,848) |
| Oklahoma: | 85.9% (637,250) |
Carpooled:
| Oklahoma City: | 8.9% (36,131) |
| Oklahoma: | 10.4% (83,369) |
Bus:
| Oklahoma City: | 0.3% (1,406) |
| Oklahoma: | 0.3% (1,627) |
Subway or elevated rail:
| Oklahoma City: | 0.0% (40) |
| Oklahoma: | 0.0% (40) |
Long-distance train or commuter rail:
| Oklahoma City: | 0.0% (39) |
| Oklahoma: | 0.0% (0) |
Ferryboat:
| Oklahoma City: | 0.1% (268) |
| Oklahoma: | 0.0% (157) |
Bicycle:
| Oklahoma City: | 0.1% (402) |
| Oklahoma: | 0.2% (1,049) |
Walked:
| Oklahoma City: | 1.3% (5,472) |
| Oklahoma: | 1.9% (12,760) |
Other means:
| Oklahoma City: | 1.4% (5,856) |
| Oklahoma: | 1.3% (9,153) |

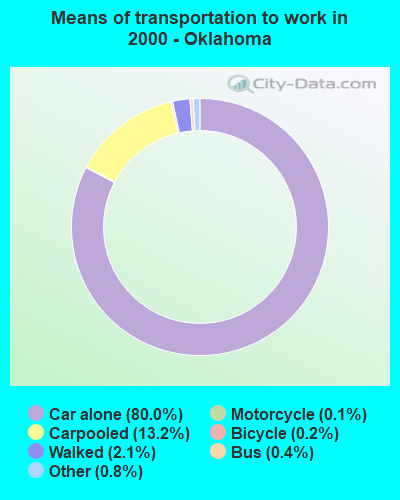
Drove car alone:
| Oklahoma City: | 80.4% (188,424) |
| Oklahoma: | 80.0% (1,231,711) |
Carpooled:
| Oklahoma City: | 13.1% (30,713) |
| Oklahoma: | 13.2% (203,444) |
Bus or trolley bus:
| Oklahoma City: | 0.7% (1,729) |
| Oklahoma: | 0.4% (5,675) |
Streetcar or trolley car:
| Oklahoma City: | 0.0% (71) |
| Oklahoma: | 0.0% (185) |
Subway or elevated:
| Oklahoma City: | 0.0% (42) |
| Oklahoma: | 0.0% (135) |
Railroad:
| Oklahoma City: | 0.0% (18) |
| Oklahoma: | 0.0% (83) |
Ferryboat:
| Oklahoma City: | 0.0% (52) |
| Oklahoma: | 0.0% (106) |
Taxicab:
| Oklahoma City: | 0.2% (420) |
| Oklahoma: | 0.1% (1,272) |
Motorcycle:
| Oklahoma City: | 0.1% (226) |
| Oklahoma: | 0.1% (1,639) |
Bicycle:
| Oklahoma City: | 0.1% (266) |
| Oklahoma: | 0.2% (2,910) |
Walked:
| Oklahoma City: | 1.6% (3,714) |
| Oklahoma: | 2.1% (32,796) |
Other means:
| Oklahoma City: | 0.9% (2,193) |
| Oklahoma: | 0.8% (12,279) |


Drove car alone - Males:
| Oklahoma City: | 88.0% (203,776) |
| Oklahoma: | 86.2% (637,250) |
Carpooled - Males:
| Oklahoma City: | 8.5% (19,605) |
| Oklahoma: | 9.8% (83,369) |
Bus - Males:
| Oklahoma City: | 0.4% (906) |
| Oklahoma: | 0.3% (1,627) |
Long-distance train or commuter rail - Males:
| Oklahoma City: | 0.0% (39) |
| Oklahoma: | 0.0% (0) |
Ferryboat - Males:
| Oklahoma City: | 0.1% (268) |
| Oklahoma: | 0.0% (157) |
Bicycle - Males:
| Oklahoma City: | 0.1% (193) |
| Oklahoma: | 0.3% (1,049) |
Walked - Males:
| Oklahoma City: | 1.7% (3,965) |
| Oklahoma: | 2.1% (12,760) |
Other means - Males:
| Oklahoma City: | 1.3% (2,942) |
| Oklahoma: | 1.3% (9,153) |

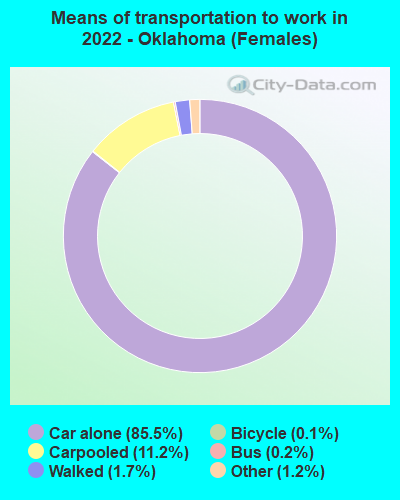
Drove car alone - Females:
| Oklahoma City: | 87.5% (152,072) |
| Oklahoma: | 85.5% (637,250) |
Carpooled - Females:
| Oklahoma City: | 9.5% (16,526) |
| Oklahoma: | 11.2% (83,369) |
Bus - Females:
| Oklahoma City: | 0.3% (500) |
| Oklahoma: | 0.2% (1,627) |
Subway or elevated rail - Females:
| Oklahoma City: | 0.0% (40) |
| Oklahoma: | 0.0% (40) |
Bicycle - Females:
| Oklahoma City: | 0.1% (209) |
| Oklahoma: | 0.1% (1,049) |
Walked - Females:
| Oklahoma City: | 0.9% (1,507) |
| Oklahoma: | 1.7% (12,760) |
Other means - Females:
| Oklahoma City: | 1.7% (2,914) |
| Oklahoma: | 1.2% (9,153) |
Private vehicle occupancy

Drove alone:
| Oklahoma City: | 89.8% (262,124) |
| Oklahoma: | 89.3% (1,422,987) |
In 2 person carpool:
| Oklahoma City: | 7.0% (20,550) |
| Oklahoma: | 8.1% (129,133) |
In 3 person carpool:
| Oklahoma City: | 2.4% (6,960) |
| Oklahoma: | 1.6% (26,288) |
In 4 person carpool:
| Oklahoma City: | 0.4% (1,085) |
| Oklahoma: | 0.6% (9,725) |
In 5-6 person carpool:
| Oklahoma City: | 0.2% (646) |
| Oklahoma: | 0.2% (3,863) |
In 7+ person carpool:
| Oklahoma City: | 0.2% (470) |
| Oklahoma: | 0.1% (2,305) |

Drove alone:
| Oklahoma City: | 86.0% (188,424) |
| Oklahoma: | 85.8% (1,231,711) |
In 2 person carpool:
| Oklahoma City: | 11.2% (24,488) |
| Oklahoma: | 11.1% (159,539) |
In 3 person carpool:
| Oklahoma City: | 1.9% (4,198) |
| Oklahoma: | 2.0% (29,245) |
In 4 person carpool:
| Oklahoma City: | 0.6% (1,247) |
| Oklahoma: | 0.7% (9,499) |
In 5-6 person carpool:
| Oklahoma City: | 0.3% (585) |
| Oklahoma: | 0.3% (3,652) |
In 7+ person carpool:
| Oklahoma City: | 0.1% (195) |
| Oklahoma: | 0.1% (1,509) |
Class of workers
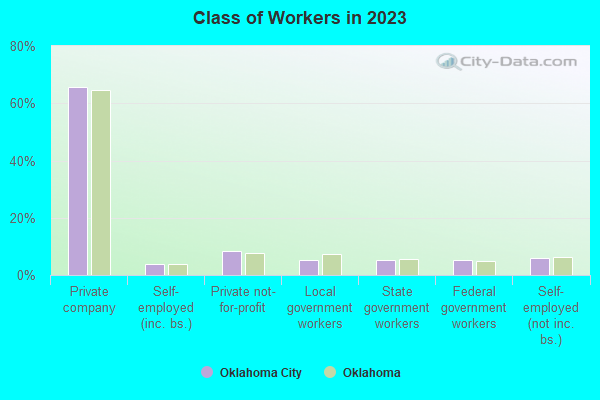
Employee of private company:
| Oklahoma City: | 64.5% (222,172) |
| Oklahoma: | 64.5% (1,184,078) |
Self-employed in own incorporated business:
| Oklahoma City: | 4.1% (13,972) |
| Oklahoma: | 4.0% (73,341) |
Private not-for-profit wage and salary workers:
| Oklahoma City: | 7.8% (27,030) |
| Oklahoma: | 7.4% (135,433) |
Local government workers:
| Oklahoma City: | 5.7% (19,750) |
| Oklahoma: | 6.9% (127,021) |
State government workers:
| Oklahoma City: | 5.1% (17,503) |
| Oklahoma: | 5.6% (103,677) |
Federal government workers:
| Oklahoma City: | 5.9% (20,294) |
| Oklahoma: | 4.7% (86,381) |
Self-employed workers in own not incorporated business:
| Oklahoma City: | 6.8% (23,360) |
| Oklahoma: | 6.7% (122,881) |
Unpaid family workers:
| Oklahoma City: | 0.2% (599) |
| Oklahoma: | 0.2% (3,493) |

Employee of private company:
| Oklahoma City: | 68.4% (161,055) |
| Oklahoma: | 65.0% (1,003,702) |
Self-employed in own incorporated business:
| Oklahoma City: | 3.8% (8,956) |
| Oklahoma: | 3.3% (50,535) |
Private not-for-profit wage and salary workers:
| Oklahoma City: | 6.4% (15,048) |
| Oklahoma: | 6.4% (98,161) |
Local government workers:
| Oklahoma City: | 4.0% (9,484) |
| Oklahoma: | 5.3% (81,853) |
State government workers:
| Oklahoma City: | 5.9% (13,821) |
| Oklahoma: | 7.5% (116,288) |
Federal government workers:
| Oklahoma City: | 4.9% (11,569) |
| Oklahoma: | 3.9% (60,976) |
Self-employed workers in own not incorporated business:
| Oklahoma City: | 6.3% (14,888) |
| Oklahoma: | 8.2% (126,134) |
Unpaid family workers:
| Oklahoma City: | 0.3% (744) |
| Oklahoma: | 0.5% (7,647) |

Employee of private company - Males:
| Oklahoma City: | 67.5% (123,667) |
| Oklahoma: | 67.5% (662,427) |
Self-employed in own incorporated business - Males:
| Oklahoma City: | 5.0% (9,225) |
| Oklahoma: | 4.9% (48,518) |
Private not-for-profit wage and salary workers - Males:
| Oklahoma City: | 4.9% (8,994) |
| Oklahoma: | 5.1% (50,200) |
Local government workers - Males:
| Oklahoma City: | 4.0% (7,398) |
| Oklahoma: | 5.4% (53,045) |
State government workers - Males:
| Oklahoma City: | 3.6% (6,635) |
| Oklahoma: | 4.1% (40,676) |
Federal government workers - Males:
| Oklahoma City: | 7.5% (13,664) |
| Oklahoma: | 5.1% (49,704) |
Self-employed workers in own not incorporated business - Males:
| Oklahoma City: | 7.3% (13,347) |
| Oklahoma: | 7.6% (75,028) |
Unpaid family workers - Males:
| Oklahoma City: | 0.2% (315) |
| Oklahoma: | 0.2% (1,864) |

Employee of private company - Females:
| Oklahoma City: | 61.0% (98,505) |
| Oklahoma: | 61.0% (521,651) |
Self-employed in own incorporated business - Females:
| Oklahoma City: | 2.9% (4,747) |
| Oklahoma: | 2.9% (24,823) |
Private not-for-profit wage and salary workers - Females:
| Oklahoma City: | 11.2% (18,036) |
| Oklahoma: | 10.0% (85,233) |
Local government workers - Females:
| Oklahoma City: | 7.7% (12,352) |
| Oklahoma: | 8.7% (73,976) |
State government workers - Females:
| Oklahoma City: | 6.7% (10,868) |
| Oklahoma: | 7.4% (63,001) |
Federal government workers - Females:
| Oklahoma City: | 4.1% (6,630) |
| Oklahoma: | 4.3% (36,677) |
Self-employed workers in own not incorporated business - Females:
| Oklahoma City: | 6.2% (10,013) |
| Oklahoma: | 5.6% (47,853) |
Unpaid family workers - Females:
| Oklahoma City: | 0.2% (284) |
| Oklahoma: | 0.2% (1,629) |