Work and Jobs in Ontario, New York (NY) Detailed Stats
Occupations, Industries, Unemployment, Workers, Commute
Settings
X


Recent posts about work in Ontario, New York on our local forum with over 2,400,000 registered users:
 | Lake Ontario designated as national marine sanctuary (0 replies) |
| Upstate NY job openings...... (1437 replies) |
| Forbes: Rochester #1 city for jobs outlook this summer (75 replies) |
| Buffalo-Boom/Bust II (619 replies) |
| NYS thruway system (342 replies) |
| What is Batavia like? (218 replies) |
Latest news about work in Ontario, NY collected exclusively by city-data.com from local newspapers, TV, and radio stations
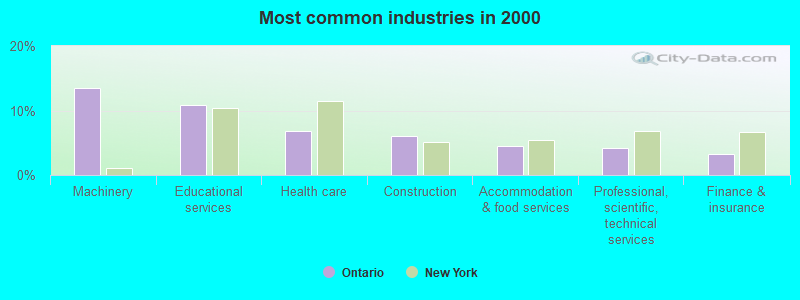
The most common industries in Ontario are: Machinery (13.5% of civilian employees), Educational services (10.9% of civilian employees), Health care (6.9% of civilian employees). 72.3% of workers are employees of private companies, which is 11.9% greater than the rate of 63.7% across the entire state of New York.
Most common industries
Most common industries | |||
|---|---|---|---|
Industry | All | Males | Females |
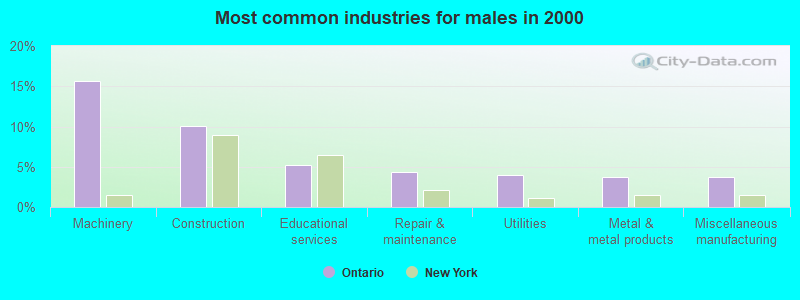
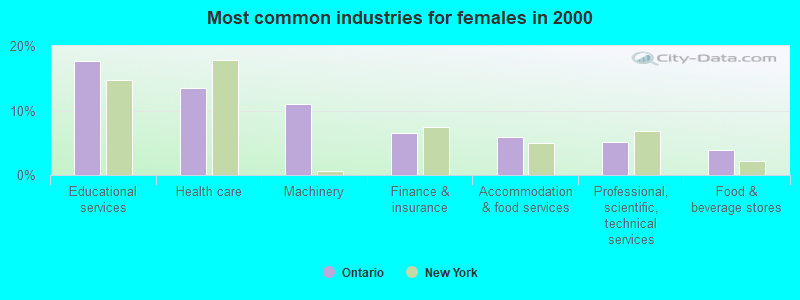
| Machinery | 13.5% (686) | 15.6% (429) | 11.0% (257) |
| Educational services | 10.9% (554) | 5.2% (143) | 17.6% (411) |
| Health care | 6.9% (350) | 1.3% (36) | 13.5% (314) |
| Construction | 6.0% (307) | 10.1% (277) | 1.3% (30) |
| Accommodation and food services | 4.5% (229) | 3.4% (93) | 5.8% (136) |
| Professional, scientific, and technical services | 4.2% (213) | 3.4% (94) | 5.1% (119) |
| Finance and insurance | 3.3% (165) | 0.4% (12) | 6.6% (153) |
| Food and beverage stores | 3.2% (161) | 2.6% (72) | 3.8% (89) |
| Computer and electronic products | 2.8% (142) | 2.7% (73) | 3.0% (69) |
| Administrative and support and waste management services | 2.6% (132) | 3.3% (91) | 1.8% (41) |
| Utilities | 2.5% (128) | 4.0% (110) | 0.8% (18) |
| Metal and metal products | 2.4% (123) | 3.7% (101) | 0.9% (22) |
| Repair and maintenance | 2.4% (120) | 4.4% (120) | 0.0% (0) |
| Miscellaneous manufacturing | 2.3% (117) | 3.7% (101) | 0.7% (16) |
| Public administration | 2.1% (107) | 2.4% (65) | 1.8% (42) |
| Printing and related support activities | 1.6% (81) | 2.0% (54) | 1.2% (27) |
| Chemicals | 1.6% (81) | 1.9% (53) | 1.2% (28) |
| Professional and commercial equipment and supplies merchant wholesalers | 1.5% (78) | 1.3% (35) | 1.8% (43) |
| Plastics and rubber products | 1.5% (77) | 2.3% (62) | 0.6% (15) |
| Transportation equipment | 1.4% (73) | 2.7% (73) | 0.0% (0) |
| Department and other general merchandise stores | 1.4% (69) | 1.3% (37) | 1.4% (32) |
| Broadcasting and telecommunications | 1.3% (66) | 1.4% (38) | 1.2% (28) |
| Real estate and rental and leasing | 1.3% (65) | 1.8% (50) | 0.6% (15) |
| Building material and garden equipment and supplies dealers | 1.2% (63) | 2.0% (55) | 0.3% (8) |
| Arts, entertainment, and recreation | 1.2% (62) | 0.4% (10) | 2.2% (52) |
| Social assistance | 1.1% (55) | 0.7% (18) | 1.6% (37) |
| Motor vehicle and parts dealers | 1.1% (54) | 1.8% (50) | 0.2% (4) |
| Used merchandise, gift, novelty, and souvenir, and other miscellaneous stores | 1.0% (52) | 0.5% (15) | 1.6% (37) |
| Food | 0.9% (44) | 1.1% (30) | 0.6% (14) |
| Personal and laundry services | 0.9% (44) | 0.6% (17) | 1.2% (27) |
| Hardware, plumbing and heating equipment, and supplies merchant wholesalers | 0.8% (43) | 0.9% (26) | 0.7% (17) |
| Religious, grantmaking, civic, professional, and similar organizations | 0.7% (38) | 0.3% (8) | 1.3% (30) |
| Pharmacies and drug stores | 0.7% (34) | 0.3% (7) | 1.2% (27) |
| Electrical equipment, appliances, and components | 0.7% (33) | 0.2% (5) | 1.2% (28) |
| Agriculture, forestry, fishing and hunting | 0.6% (30) | 1.1% (30) | 0.0% (0) |
| Groceries and related products merchant wholesalers | 0.6% (30) | 0.4% (10) | 0.9% (20) |
| Motor vehicles, parts and supplies merchant wholesalers | 0.6% (28) | 0.8% (22) | 0.3% (6) |
| Sporting goods, camera, and hobby and toy stores | 0.5% (27) | 0.6% (17) | 0.4% (10) |
| Electrical and electronic goods merchant wholesalers | 0.5% (25) | 0.3% (8) | 0.7% (17) |
| Data processing, libraries, and other information services | 0.5% (24) | 0.3% (9) | 0.6% (15) |
| Gasoline stations | 0.4% (22) | 0.5% (13) | 0.4% (9) |
| Miscellaneous nondurable goods merchant wholesalers | 0.4% (21) | 0.3% (8) | 0.6% (13) |
| Machinery, equipment, and supplies merchant wholesalers | 0.4% (21) | 0.8% (21) | 0.0% (0) |
| Nonmetallic mineral products | 0.4% (20) | 0.6% (17) | 0.1% (3) |
| Publishing, and motion picture and sound recording industries | 0.4% (19) | 0.4% (12) | 0.3% (7) |
| Private households | 0.4% (19) | 0.0% (0) | 0.8% (19) |
| Radio, TV, and computer stores | 0.3% (17) | 0.6% (17) | 0.0% (0) |
| Other transportation, and support activities, and couriers | 0.3% (17) | 0.3% (8) | 0.4% (9) |
| Alcoholic beverages merchant wholesalers | 0.3% (17) | 0.6% (17) | 0.0% (0) |
| U. S. Postal service | 0.3% (16) | 0.6% (16) | 0.0% (0) |
| Health and personal care, except drug, stores | 0.3% (13) | 0.3% (9) | 0.2% (4) |
| Farm product raw materials merchant wholesalers | 0.2% (11) | 0.4% (11) | 0.0% (0) |
| Truck transportation | 0.2% (9) | 0.3% (9) | 0.0% (0) |
| Paper | 0.2% (8) | 0.3% (8) | 0.0% (0) |
| Furniture and home furnishings, and household appliance stores | 0.2% (8) | 0.0% (0) | 0.3% (8) |
| Lumber and other construction materials merchant wholesalers | 0.2% (8) | 0.3% (8) | 0.0% (0) |
| Beverage and tobacco products | 0.1% (7) | 0.3% (7) | 0.0% (0) |
| Management of companies and enterprises | 0.1% (7) | 0.0% (0) | 0.3% (7) |
| Other direct selling establishments | 0.1% (5) | 0.2% (5) | 0.0% (0) |
Unemployment in Ontario
- Unemployment by race in 2000
- Unemployment rate for White non-Hispanic residents
- 5.2%Males
- 3.0%Females
- Unemployment rate for two or more race residents
- 47.1%Females
Time leaving home to go to work

<5am:
| Ontario: | 2.7% (134) |
| New York: | 2.4% (194,562) |
5:30am:
| Ontario: | 2.9% (144) |
| New York: | 2.1% (174,328) |
6am:
| Ontario: | 4.6% (231) |
| New York: | 3.1% (253,826) |
6:30am:
| Ontario: | 11.2% (564) |
| New York: | 7.0% (573,349) |
7am:
| Ontario: | 14.5% (727) |
| New York: | 8.6% (706,982) |
7:30am:
| Ontario: | 17.6% (883) |
| New York: | 14.0% (1,147,579) |
8am:
| Ontario: | 13.8% (693) |
| New York: | 14.8% (1,213,706) |
8:30am:
| Ontario: | 8.8% (444) |
| New York: | 13.9% (1,144,298) |
9am:
| Ontario: | 3.1% (157) |
| New York: | 7.5% (614,475) |
10am:
| Ontario: | 4.4% (221) |
| New York: | 7.2% (593,377) |
11am:
| Ontario: | 1.0% (51) |
| New York: | 2.7% (224,011) |
12pm:
| Ontario: | 0.7% (36) |
| New York: | 1.3% (105,049) |
4pm:
| Ontario: | 6.0% (302) |
| New York: | 6.3% (517,309) |
>4pm:
| Ontario: | 6.0% (302) |
| New York: | 6.1% (501,196) |
Travel time to work


Less than 5 minutes:
| Ontario: | 3.8% (189) |
| New York: | 2.7% (219,036) |
5 to 9 minutes:
| Ontario: | 11.2% (563) |
| New York: | 8.3% (680,270) |
10 to 14 minutes:
| Ontario: | 15.7% (788) |
| New York: | 11.6% (956,590) |
15 to 19 minutes:
| Ontario: | 10.1% (508) |
| New York: | 12.4% (1,020,084) |
20 to 24 minutes:
| Ontario: | 14.7% (740) |
| New York: | 12.3% (1,013,757) |
25 to 29 minutes:
| Ontario: | 8.7% (437) |
| New York: | 4.9% (399,384) |
30 to 34 minutes:
| Ontario: | 16.2% (815) |
| New York: | 12.9% (1,058,688) |
35 to 39 minutes:
| Ontario: | 3.4% (172) |
| New York: | 2.5% (203,722) |
40 to 44 minutes:
| Ontario: | 5.2% (261) |
| New York: | 4.1% (340,311) |
45 to 59 minutes:
| Ontario: | 5.5% (275) |
| New York: | 9.8% (806,556) |
60 to 89 minutes:
| Ontario: | 1.6% (80) |
| New York: | 10.3% (848,185) |
90 or more minutes:
| Ontario: | 1.2% (61) |
| New York: | 5.1% (417,464) |
Means of transportation to work


Drove car alone:
| Ontario: | 88.6% (4,454) |
| New York: | 56.3% (4,620,178) |
Carpooled:
| Ontario: | 6.6% (334) |
| New York: | 9.2% (756,918) |
Bus or trolley bus:
| Ontario: | 0.5% (24) |
| New York: | 5.8% (475,389) |
Walked:
| Ontario: | 1.4% (71) |
| New York: | 6.2% (511,721) |
Other means:
| Ontario: | 0.1% (6) |
| New York: | 0.5% (40,375) |
Private vehicle occupancy

Drove alone:
| Ontario: | 93.0% (4,454) |
| New York: | 85.9% (4,620,178) |
In 2 person carpool:
| Ontario: | 6.9% (328) |
| New York: | 11.0% (590,255) |
In 3 person carpool:
| Ontario: | 0.1% (6) |
| New York: | 1.8% (96,470) |
Class of workers

Employee of private company:
| Ontario: | 72.3% (3,668) |
| New York: | 63.7% (5,340,134) |
Self-employed in own incorporated business:
| Ontario: | 2.7% (138) |
| New York: | 3.4% (283,619) |
Private not-for-profit wage and salary workers:
| Ontario: | 8.3% (421) |
| New York: | 9.7% (810,356) |
Local government workers:
| Ontario: | 6.4% (325) |
| New York: | 10.2% (858,120) |
State government workers:
| Ontario: | 2.9% (147) |
| New York: | 4.6% (383,673) |
Federal government workers:
| Ontario: | 0.5% (26) |
| New York: | 2.2% (185,100) |
Self-employed workers in own not incorporated business:
| Ontario: | 6.8% (343) |
| New York: | 6.0% (501,068) |
Unpaid family workers:
| Ontario: | 0.1% (7) |
| New York: | 0.2% (20,918) |

Employee of private company - Males:
| Ontario: | 77.0% (2,111) |
| New York: | 66.2% (2,902,064) |
Self-employed in own incorporated business - Males:
| Ontario: | 4.5% (123) |
| New York: | 4.9% (215,651) |
Private not-for-profit wage and salary workers - Males:
| Ontario: | 4.0% (110) |
| New York: | 6.3% (277,787) |
Local government workers - Males:
| Ontario: | 5.3% (144) |
| New York: | 8.7% (380,426) |
State government workers - Males:
| Ontario: | 1.8% (50) |
| New York: | 4.1% (181,784) |
Federal government workers - Males:
| Ontario: | 0.6% (16) |
| New York: | 2.3% (102,647) |
Self-employed workers in own not incorporated business - Males:
| Ontario: | 6.6% (181) |
| New York: | 7.1% (312,497) |
Unpaid family workers - Males:
| Ontario: | 0.3% (7) |
| New York: | 0.2% (9,470) |

Employee of private company - Females:
| Ontario: | 66.7% (1,557) |
| New York: | 60.9% (2,438,070) |
Self-employed in own incorporated business - Females:
| Ontario: | 0.6% (15) |
| New York: | 1.7% (67,968) |
Private not-for-profit wage and salary workers - Females:
| Ontario: | 13.3% (311) |
| New York: | 13.3% (532,569) |
Local government workers - Females:
| Ontario: | 7.8% (181) |
| New York: | 11.9% (477,694) |
State government workers - Females:
| Ontario: | 4.2% (97) |
| New York: | 5.0% (201,889) |
Federal government workers - Females:
| Ontario: | 0.4% (10) |
| New York: | 2.1% (82,453) |
Self-employed workers in own not incorporated business - Females:
| Ontario: | 6.9% (162) |
| New York: | 4.7% (188,571) |